Using citizen science data to improve regional bird species list:A case study in Shaanxi,China
2022-10-03YingDingLichuanXiongFandiJiJunhuiLuXiaojiaZhuHuatengHuang
Ying Ding,Lichuan Xiong,Fandi Ji,Junhui Lu,Xiaojia Zhu ,Huateng Huang
College of Life Sciences,Shaanxi Normal University,Xi'an,710119,China
Keywords:Bird distribution Birdwatching Citizen science Expert knowledge Species checklist
ABSTRACT An accurate and updated regional bird species checklist is the foundation for biodiversity research and conservation.However,with ongoing climate and landscape changes,tracking the distributions of bird species is challenging,and expert-curated species lists are often limited regarding survey area and timeliness.Birdwatching in China is becoming increasingly popular,and observations recorded by citizen birders are quickly increasing as well.Assessing the value of these data for improving regional species lists and studying bird distribution needs a detailed and quantitative comparison of citizen science data and expert-curated data.We collected observation reports from the China Bird Report Center,the largest online open platform for sharing bird sightings in China.We focused on reports from 2016 to 2019 in Shaanxi Province.For expert-curated species lists,we used three sources: the latest bird field guide published by local ornithologists,the province list from Avibase,and a list generated from overlaying distribution range from BirdLife International with the outline of Shaanxi Province.In addition,we also compared the bird sighting coordinates with the species distribution maps from BirdLife International.Surprisingly,species checklists from different sources have considerable discrepancies,even among lists based on expert knowledge.Including birdwatching data,there are 616 bird species in total,but less than half of the species(294)appear in all checklists,and 17.2%of species are unique to one list.One hundred sixty-three species lack birdwatching records,but birdwatching identified 39 species new to the province.One hundred thirty-six bird species have sighting locations outside the distribution ranges from BirdLife International,suggesting that updates might be needed.The data also showed a clear trend of bird species shifting to higher latitudes than their traditional distributions.While being inadequate for generating a regional species checklist on its own,birdwatching data in China can be a valuable source for complementing expert knowledge.In particular,the coordinate information of bird sighting can help track species distribution shifts.On the other hand,comparing expert-curated lists to birdwatching data can generate a species list for targeted birdwatching and monitoring,which will improve the quality of the birdwatching data in the future.
1.Introduction
The value of citizen science,in which nature-loving amateurs report species sightings,has long been recognized in the field of biodiversity surveys (Chandler et al.,2017;Gilfedder et al.,2019;Mischenko et al.,2020).However,the accuracy of citizen science data is often a concern(Crall et al.,2011;Gardiner et al.,2012;Downs et al.,2021),and cross-validation with expert knowledge is needed(Zhou et al.,2020).In particular,citizen science projects in developing countries are often at their early stages,with fewer participants and less organized than those in countries with a high human development index(Requier et al.,2020).Here,we present a case study on the quality of birdwatching data in China by comparing regional species checklists generated from an online birdwatching database with expert-curated lists.We showed the value of these citizen science data in covering regional bird species diversity and tracking species distribution shifts.
There is a strong tradition in publishing national and regional bird species checklists (Chen et al.,2012).Ornithology is also one of the earliest science subjects that employ citizen science(Si and Ding,2011).Successful long-term and large-scale programs,such as Audubon Christmas Bird Count (https://www.audubon.org/conservation/scienc e/christmas-bird-count) and the United States Breeding Bird Survey(https://www.pwrc.usgs.gov/bbs/),provided valuable information on the status and trends of bird populations in North America.With the advance in information technology,online databases to which birders can upload and share sighting information have become popular.The eBird (http://www.ebird.org) is one of the world's largest biodiversity science projects,gathering millions of records every year and providing real-time data for research on bird distribution,abundance,habitat use,and trends.Comparatively,birdwatching has a late start in Chinese mainland.Growing from “non-existent” three decades ago (Boswall,1989),birdwatching emerged as one of mass participation leisure activities(Ma et al.,2013;Walther and White,2018).Many provinces and cities have local birdwatching associations and also online discussion forums for birders.The China Bird Report Center(BRC,http://www.bir dreport.cn/) hosts the most extensive online database for nationwide birdwatching records in China.Various projects explored the collected data's value for research purposes (e.g.,building a spatialized digital database for bird species in China;Dai et al.,2019).However,the number of studies examining the quality of these data is still limited(Gilfedder et al.,2019;Zhou et al.,2020).
Our case study focused on Shaanxi,a province spanning the northsouth geographic dividing range of China (i.e.,the Qinling Mountains).This tall mountain range(reaching >3700 m at the highest peak)marks the boundary between the northern temperate and southern subtropical monsoon climates.Because of its rich landforms and climates,Shaanxi Province provides suitable habitats for a great diversity of bird species,including species from the Palearctic and Indomalaya ecozone(Yu and Li,2016).We assessed the quality and the value of citizen science data in two aspects: first,the completeness of birdwatching data in terms of regional species diversity;second,how much new information birdwatching data can contribute,including discovering species new to a region and detecting probable shifts in species distribution.Integrating information from various sources,we compiled a more inclusive species checklist for Shaanxi Province and a“yet-to-observe”checklist for birders to target in the future.
2.Material and methods
2.1.Data source
We used the China Bird Report Center (BRC,http://www.birdrecor d.cn/),the largest online database of bird sightings in China,as our source of citizen science data.When uploading information to this website,birders first generate a “report” with the geographic location and observation time,then fill in the list of observed species (i.e.,one report could contain multiple species records).We downloaded all the records between 1 January 2016 and 31 December 2019 within Shaanxi Province(we do not use later data because travel restrictions during the pandemic inevitably restricted birdwatching activities),then compiled a table of all the species records containing the following information:species’Chinese name,scientific name,English name,the report number(the report ID assigned by the website),user ID,record time,record location,latitude,and longitude.Hereafter,this dataset is referred to as the“BR”dataset.
For expert-curated regional checklists,we identified three sources.First is a bird guide book published by local ornithologists -An Illustrated Guide to Birds in Qinling Mountains(Yu and Li,2016).The majority of the avian biodiversity in Shaanxi is in the Qinling Mountains,so we used the species checklist of Middle Qinling-the section of the Qinling Mountains in Shaanxi Province -as our first checklist based on expert knowledge (hereafter the “QL” list).Second is the checklist of Shaanxi Province from the Avibase website (https://avibase.bsc-eoc.org),downloaded as of 13 June 2020(hereafter the“AB”list).The third source is the BirdLife International (http://datazone.birdlife.org/home) andHandbook of the Birds of the World(BirdLife and Handbook of the Birds of the World,2018),which provide digitized distribution maps for the world's bird species.Overlaying these range maps with the geographic boundaries of Shaanxi Province using ArcGIS v10.5(ESRI,2011)resulted in a list of species whose distribution overlaps with Shaanxi (Hereafter the“BL”list),and these downloaded ranges are referred to as“traditional distributions”.
Along with species checklists,we extracted other information from these online sources of expert knowledge as well.We obtained each species’habitat type and category in the Global IUCN Red List from the BirdLife website (BirdLife International,2020).Since Shaanxi is an inland province,we excluded four marine habitats and the savanna habitat,leaving 12 habitat types: forest,artificial/terrestrial,shrubland,wetlands (inland),grassland,rocky areas,desert,artificial/aquatic and marine,caves and subterranean habitats (non-aquatic),introduced vegetation,unknown,and other.The Global IUCN Red List has five categories: Critically Endangered (CR),Endangered (EN),Vulnerable(VU),Near Threatened (NT),and Least Concern (LC).Because of the number of species,most online data downloading and information extraction were accomplished in R(R Core Team,2019)with the splashr package(Rudis,2019).
2.2.Data integration and analyses
Integrating and comparing checklists from different sources first have to resolve the inconsistency in their nomenclature system.Since all lists have species'English name and scientific name,we first checked if both names could be matched(fuzzy matches were used to handle occasional typos).For the species with no matching from the previous step(usually because of taxonomic revision),we examined the consistency of Chinese names if available(i.e.,the BR,AB,and QL list include species’Chinese names).Then,we examined the histories of the taxonomic concepts on the Avibase website (under the sections “related taxa” and “Authorities recognizing this taxonomic concept”)to ensure the matches are correct.The final compiled list follows the nomenclature system of Clements checklist,version 2019.
We used rgdal (Bivand et al.,2020) and sp package (Pebesma and Bivand,2005;Bivand et al.,2013) in R to determine whether an observation record locates within species traditional distribution (i.e.,distributions from the BirdLife International).However,misidentifications could occur during birdwatching resulting in wrong locations.We first considered the outlier observations valid if multiple locations existed and partially overlapped with the traditional distribution(i.e.,some locations within the traditional range and some outside).If all observation locations are outside,we checked if the species are in other expert checklists,especially for species whose traditional distribution does not intersect with Shaanxi.Being in another expert-curated checklist suggests a lower probability of being misidentified.Finally,for the species not in any other expert list and only with“outside”observations,we searched local news and recent academic literature published (e.g.,bird guides,conference abstracts,journal articles)for a second source of cross-validation.
After excluding suspicious birdwatching-only species,we analyzed the characteristics of outlier observations of the remaining species.We first tried to identify outlier observations because of incomplete migration passage information on BirdLife International.That is,observations of individuals during migration between breeding ranges and nonbreeding ranges could appear to be “outside”.For species with separated breeding and non-breeding ranges,we used the grDevices package in R (R Core Team,2019) to construct a convex hull of breeding and non-breeding ranges on the map.Among the nine major flyways around the world (https://www.eaaflyway.net/the-flyway),birds in China migrate mostly over three routes:the Central Asian flyway,the East Asian-Australasian flyway,and the West Asian-East African flyway(Wang,2018b).Hence,we excluded ranges in the North and South America to avoid building a convex hull across the Pacific ocean.If an outlier observation were covered by the convex hull,it is very likely to be an observation during migration.For a few outliers on or very close to the boundary,we searched local news to verify whether the species had migration records in Shaanxi.
After excluding migratory observations,the remaining outliers might indicate a shift in the species’distribution range.Hence,we investigated whether the birdwatching data indicated any trend in the direction of range shifts.To quantitatively determine the direction in which an outlier lays relative to the traditional range,we found the point on the distribution boundaries with the shortest distance to the outlier point.The direction of this minimal distance vector was used to determine whether the outlier is east,west,north,or south of the boundary(if the direction is northeast,both north and east were recorded).If a species had multiple outlier points in opposite directions(i.e.,some points south and some north),it was counted as a species with range expansion.
Some of the outliers might be birders’ misidentifications.To ensure our conclusion is not affected,we used a variety of filters to exclude species that have observations with less credibility: (1) species with fewer than three birders;(2) species with fewer than three recorded locations;(3) species with fewer than six observations;(4) species whose outlier observations had an average distance to its traditional distribution boundaries larger than 200 km;and (5) all four previous filters combined.These filters might remove some valid birdwatching records but allows us to assess whether our conclusion about the trends of range shifts is robust to errors in birdwatching data.
3.Results
3.1.Composition of birdwatching records in Shaanxi Province
During 2016-2019,BRC received 792 birding reports from Shaanxi,containing 15,908 species observation records (Fig.1A).Among the 33 Chinese provinces/districts with reports on BRC,Shaanxi ranked near the middle (13th) for both the number of reports and records (Appendix Table S1).Hence,this dataset of Shaanxi Province represents an“average” dataset (i.e.,average quantity and quality) of bird sighting activities on the province level in China.
Shaanxi's number of observation records increased fast during these three years,especially from 2017 to 2018(Fig.1A).The second quarter has the most observations for 2017 and 2019 but not for the other two years(Fig.1A).Geographically,the largest city in the province-Xi'an,has the highest number of records,followed by Shangluo and Hanzhong(Fig.1B).The top three cities account for more than 75%of the records.Comparing different districts in Xi'an shows that Chang'an district alone accounts for 46%of the records(Fig.1C).During these three years,102“reporters”contributed at least one report.Given that sometimes people use one reporter ID as a group,the number of actual birders could be higher than that of reporter IDs.
In total,453 bird species from 21 Orders and 73 Families were observed(Table 1).On the order level,256 passerine species account for 59%of the records(9400 records),surpassing all other orders combined(Table 1).On the family level (Appendix Table S2),the most often observed three families are Corvidae (1120 records),Anatidae (1031 records),and Ardeidae(988 records).
With regards to the Red List Categories(Table 2),the vast majority of birds (427 species,94%) belong to Least Concern (LC),11 species for Near Threatened (NT),and Vulnerable (VU) each.The birdwatching records included two Endangered (EN) species: Scaly-sided Merganser(Mergus squamatus)and Crested Ibis(Nipponia nippon),and two Critically Endangered(CR)bird species:Baer's Pochard(Aythya baeri)and Yellowbreasted Bunting(Emberiza aureola).
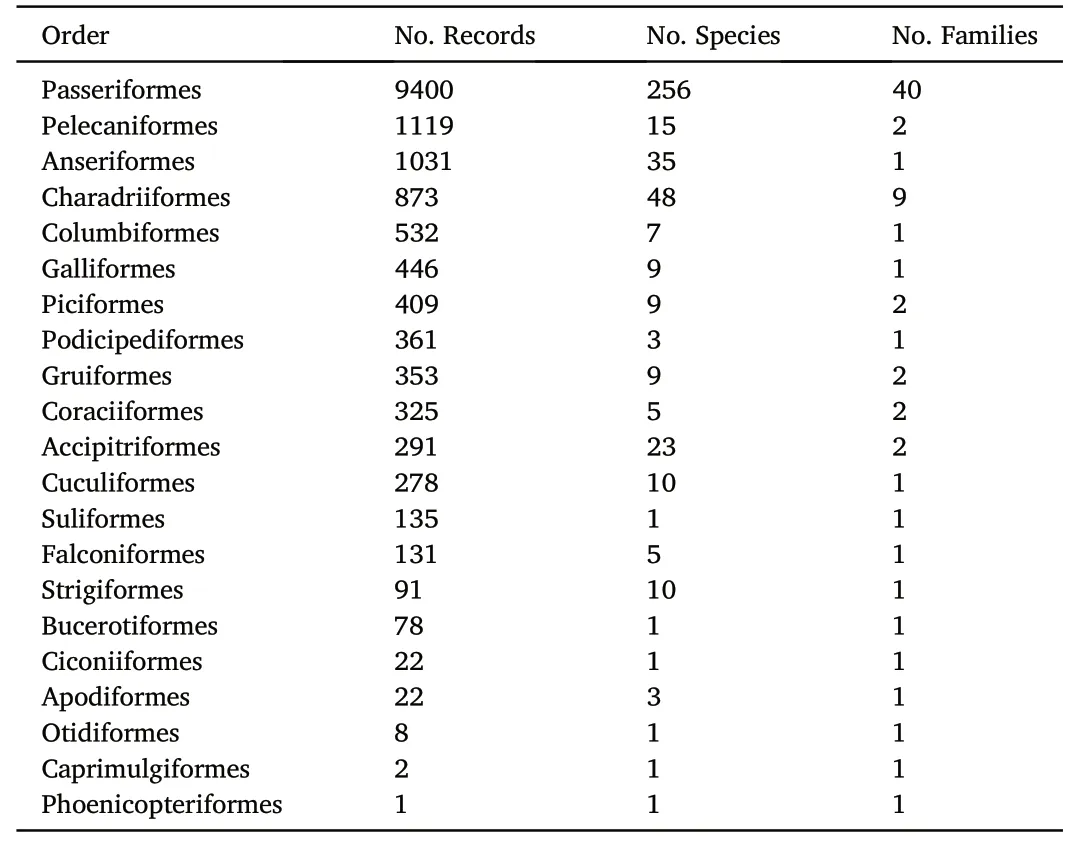
Table 1 The number of records,species and families in different orders in the BR dataset.

Table 2 The number of species in each Red List Category in the BR dataset.
3.2.Comparison of regional species checklists
Surprisingly,regional species checklists have many discrepancies,even among expert-curated ones(Fig.2).The BR,BL,AB,and QL list have 453,389,516,and 494 species,respectively.After correcting nomenclature inconsistency,there are 616 species in total,577 in at least one expert list.However,only 48%(294)species appear in all four lists,and 17.2%(106)species are unique to one list-there are 39,4,31,and 32 species unique to the BR,BL,AB,and QL list,respectively (Fig.2).If excluding the BR list,the percentage of species shared by all three expertcurated lists is higher:59%(342 species),but there are still 97 single-list species (16.8%).Thirty single expert-list species were “confirmed” by birdwatching data.Hence,regards to total species counts,the BR list generated from three years’birdwatching records only covers 72%(414 species)of the bird diversity known to expert knowledge.However,it can serve as a source for validating the discrepancies between expert lists.Moreover,it discovered 39 species new to the region(Fig.2).
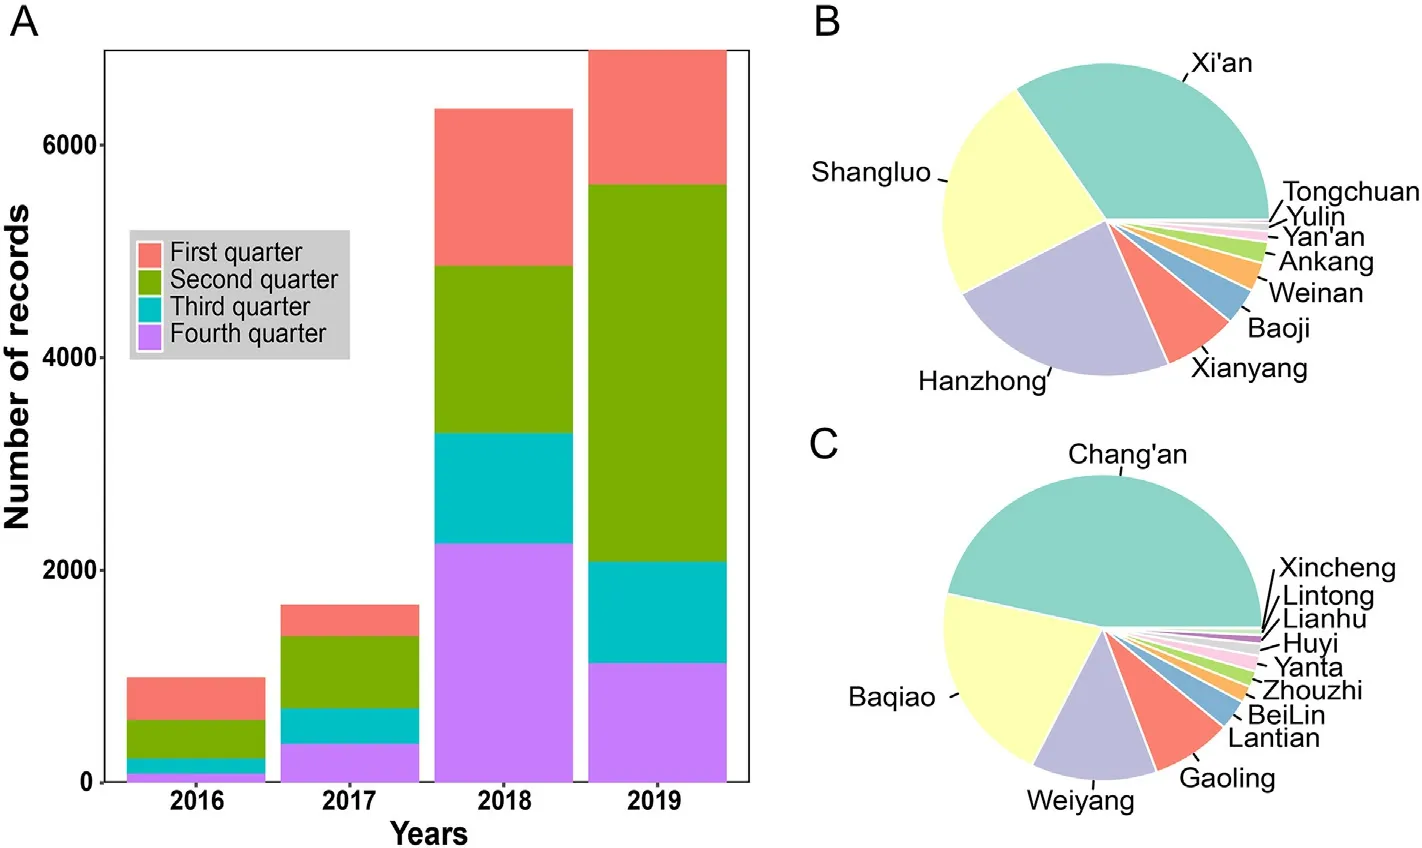
Fig.1.Composition of birdwatching records of Shaanxi Province on BRC (2016-2019).The number of observation records in Shaanxi Province (A) in each year(colored by quarters),(B) in different cities of the province,and (C) from different districts in Xi'an City.
Among the 39 species unique to the BR list(Fig.2),14 can be crossvalidated with a second source in our media and literature search (Appendix Table S3),leaving 25 species unconfirmed (Appendix Table S4;Fig.S1).Detailed examination of the birdwatching records found that only four were reported by more than one user ID or at more than one location.Hence,we compiled a final regional list including 591 species,and another list of 25 birds whose occurrence in Shaanxi remains to be verified (Appendix Table S4;Fig.S1).
3.3.Comparison of observations with traditional distributions
For the 428 species on the BR list that are confirmed by at least one expert list or have secondary source for cross validation,species’ traditional distribution range covered all observation points for 173 species(41%) and partially covered for 95 species (22%),leaving 160 species(37%)with all of their observation(s)outside of their traditional ranges.The majority of the species (121 species) in the last category are not in the BL list -their traditional ranges do not intersect with Shaanxi Province at all,but 107 species are in either AB or QL list.
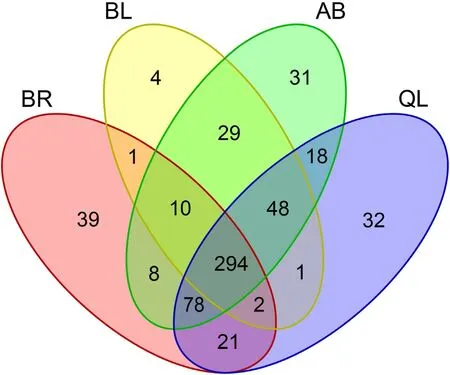
Fig.2.Number of bird species shared among checklists from different sources.BR (the China Bird Report Center 2016-2019);BL (BirdLife International);AB(Avibase);and QL (the Qingling bird guide).
By building convex hulls to encompass breeding ranges and nonbreeding ranges,we determined that outliers observations in 46%(118/255)of the 255 species likely resulted from a lack of or incomplete information on migration passages.Outlier observations of 106 species are within their convex hulls.Twelve species have outliers near the boundaries of convex hull and can be confirmed by local news(Appendix Table S5).After excluding migratory observations,136 species still have observations outside their traditional ranges.Analyzing the directions of the minimum distance vectors revealed a strong trend of species shifting to higher latitude -86 species have outlier observations north of their traditional distribution.At the same time,there are only 39,24,and 12 species with outliers in east,west and south,respectively (Appendix Table S6).Applying different filtering strategies removed 20%-50% of the species.However,the north is still the dominant direction compared to other directions regardless of the filtering(Appendix Table S6).
3.4.The characteristics of birds species lacking observation data
There are 163 species in the expert lists without sighting information(Fig.2;Appendix Table S7).About half of the birds are in the BL list(82 species;Fig.2),meaning their traditional distributions include Shaanxi.Are there particular groups of species more likely to be missed by birders?We examined the distribution of these“missing” species across families,habitat types,and the Red List categories.
Compared to the expert lists,the BR list is almost complete on the family level -73 out of 80 families;22 families have all species being sighted(Fig.3A).The missing 7 families are all families with few species in Shaanxi (9 species in total;Fig.3C;Appendix Table S7).From the perspective of habitat type,all habitats have more than 2/3 of species observed except for three: caves and subterranean habitats,desert,and rocky areas (Fig.3B).However,because the birdwatching data do not have the habitat information,we can only categorize species according to the information from BirdLife International rather than the specific type of habitat the species is in at the time of the observation.Species having multiple habitat types were counted in many categories in Fig.3B,making the percentages of observation less informative.Future birdwatching data with habitat usage might be an efficient approach to build a species’habitat usage database for research and conservation activities.In terms of the Red List category,even though the two CR species have records(Table 2),Endangered (EN),Vulnerable (VU),and Near Threatened (NT) species have fewer species being observed (20%,69%,and 50%,respectively,Fig.3C).
4.Discussion
Birds are excellent indicators of environmental change,as their species distribution and community assembly are susceptible to vegetation types,human activities,and climate change(Jetz et al.,2007;Yang et al.,2020).In the wave of anthropogenic climate and landscape change,species extinction and species turnover in a community could occur rapidly;tracking species and their distributions is an ever-increasing challenge for small groups of specialists (Li et al.,2013;Dai et al.,2019).In some ways,the amount of differences between Shaanxi bird checklists from different sources of expert knowledge speaks to how difficult it is to maintain an accurate and updated species checklist for a region.The shortest list is the BL list (389 species) based on traditional distribution ranges.In comparison,the most extended AB list contains 516 species-this is also the bird species number often cited in various local government reports.It is not surprising that the QL list(494 species)is shorter than the AB list-Middle Qinling is only one mountain range within Shaanxi Province.There are also high number of observation records in cities close to other mountain ranges(e.g.,Hanzhong near the Daba Mountains in Fig.1B),suggesting the QL list is only a partial checklist for the province.However,shorter lists are not just less complete,each of them contains unique species(Fig.2).
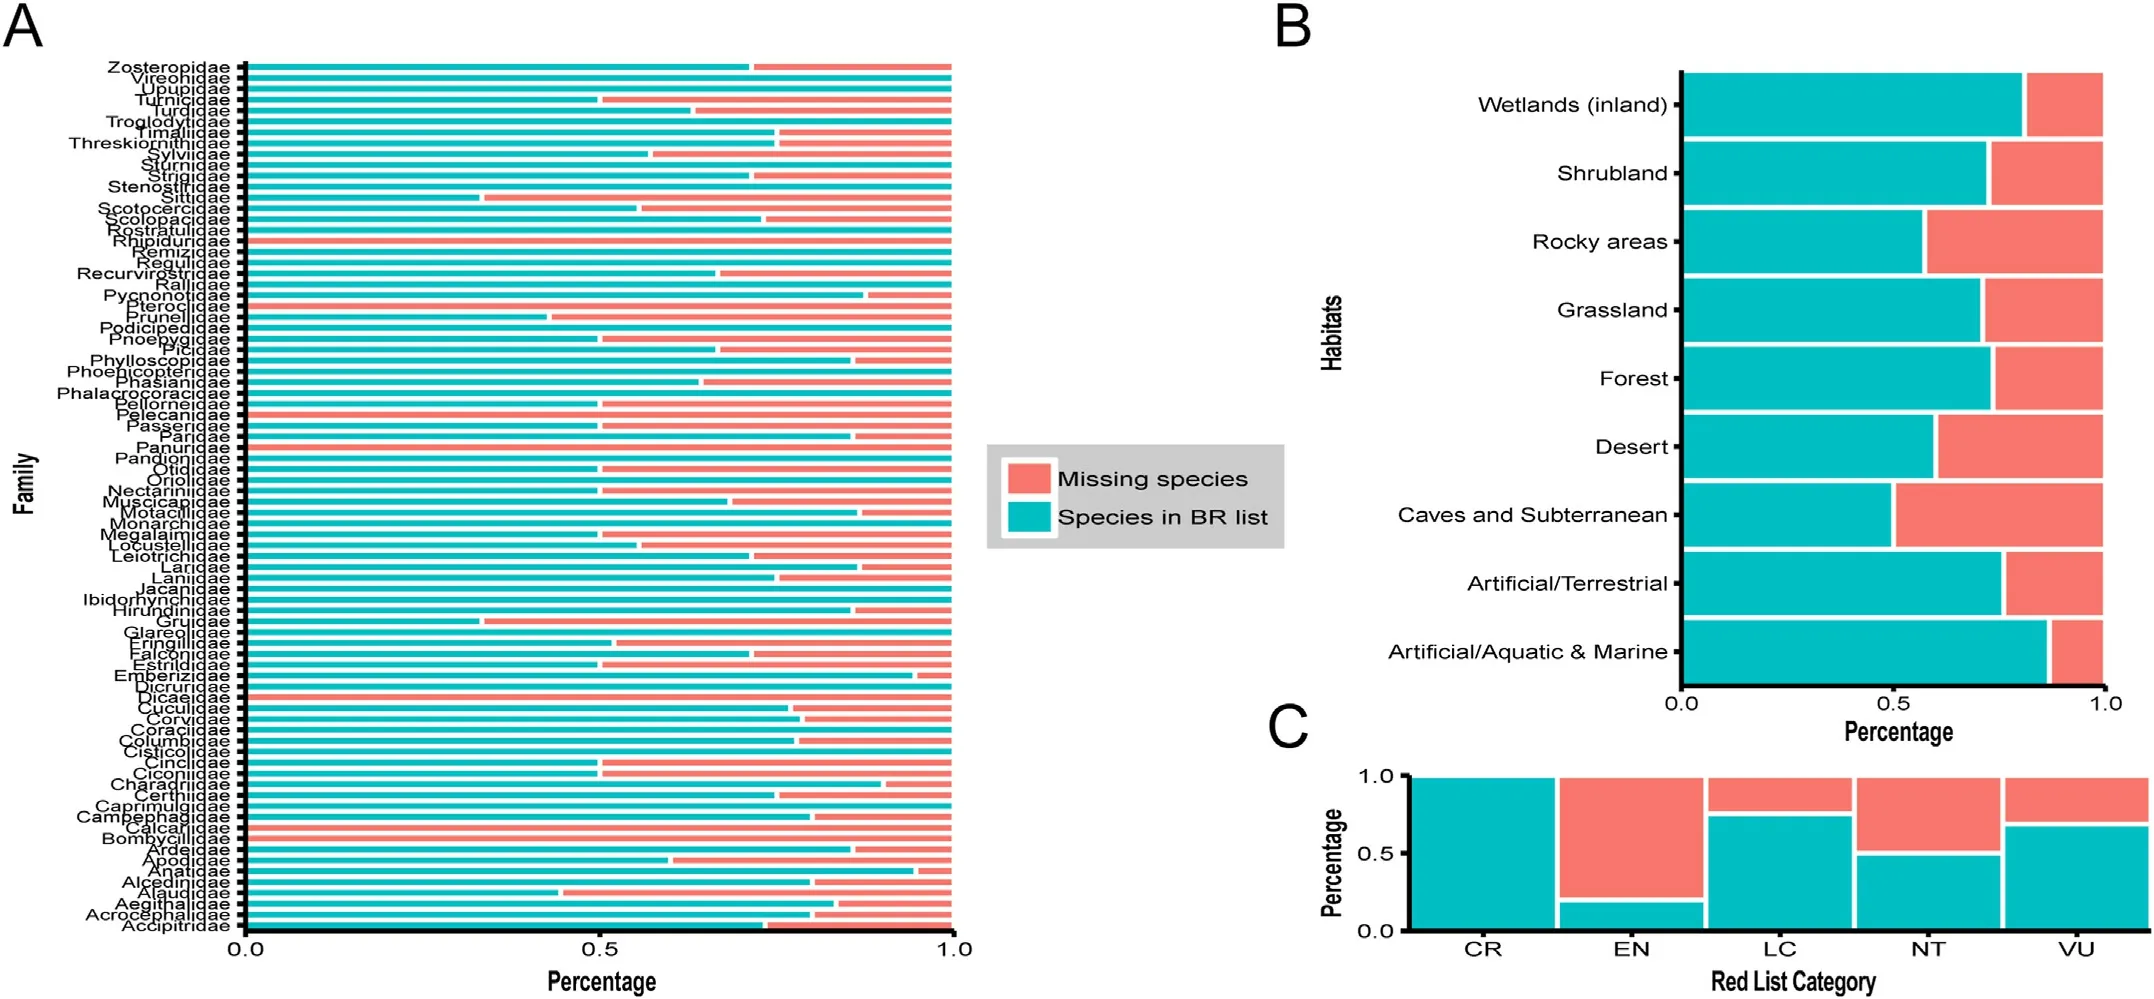
Fig.3.The percentages of expert-list species observed in each(A)family,(B)habitat type and(C)Red List category.(For interpretation of the references to color in this figure legend,the reader is referred to the Web version of this article.)
Admittedly,some of these differences might be due to different criteria.The distribution range of a species probably does not include accidental observations like lost individual birds during migration.Nevertheless,the difference might associate with how often these expertcurated lists are updated.The book for the QL list was published in 2016(Yu and Li,2016).The last modified dates of the distribution maps downloaded from BL show that 19%of the maps have not been updated in the last 11 years (Appendix Fig.S2).Although ornithologists conducted many recent avian biodiversity surveys(e.g.,Hualong Mountain National Nature Reserve,Chen et al.,2015;Qianweizhihui Wetland Park,Kang et al.,2019)in Shaanxi,these surveys are often on a much smaller geographic scale(e.g.,focusing on a single nature reserve or park;Wang,2018a).
In contrast,the birdwatching data provides records for species new to a region promptly.A comparison between community birdwatching with professional bird monitoring in Suzhou also found that because of the broader spatial and temporal coverage,community birders can record some rare birds that are unlikely to be encountered on formalized bird monitoring trips by professionals (Zhou et al.,2020).Moreover,online open databases provide a more efficient way for researchers and policymakers to access updated information.Our literature and media search found eight species unique to BR lists in academic papers published in Chinese in the last four years and two species in local news reports(Appendix Table S3).However,sparse pieces of information like these are difficult to collect for biodiversity research.
Another valuable aspect of birdwatching data from online platforms is the coordinates of observation locations.Our data revealed that 255 birds in Shaanxi have observations outside their traditional distribution.We noted that incomplete information,especially on migration passages in China,is responsible for almost half of the cases(118/225).Excluding migratory and stray birds,136 species in Shaanxi have been sighted outside their traditional ranges.With coordinates and distribution maps at a finer scale,we found that most species(86 species)have observations north of their traditional distribution boundaries.Even with the most stringent filters to exclude possible errors from birders'misidentification of species (leaving only 45% of the data),species with outlier observations north of traditional distribution still far outnumber species with outliers in other directions (Appendix Table S6).This pattern is concordant with an analysis a decade earlier (Li et al.,2013) -it compared observation data (the China Bird Report 2003-2007) to original distributions digitalized from a field guide (MacKinnon et al.,2000).The observation locations available in this earlier study are at a much coarser scale(only descriptions or district/village names).It identified 109 species across China as appearing outside their traditional ranges and showed a trend of species moving to higher latitudes and elevations.Our analyses with more recent birdwatching data suggested that the trend of bird species moving north is still ongoing,and it is apparent even within a province.Species range shifts impose severe challenges on species conservation(Hu et al.,2020).Keeping track of the shifted distributions with the help of accurate observation coordinates from citizen science data would be essential for future conservation programs.Moreover,species distribution shifts are not the only information that can potentially be extracted from bird sighting data.For example,at this stage,changes in the number of observations of each species over the years mostly reflect the overall increasing trend in the total amount of birdwatching activities in Shaanxi (Fig.1).However,with more birders’ involvement in the future,the number of observations could reveal changes in species abundance-very valuable information for conservation.
A detailed comparison between expert-curated lists and existing birdwatching data also can help improve birdwatching.While the BR list adds 14 species that are new to the region and can be cross-validated,a large percentage of the new species (25 out of 39) on the birdwatching list remains “questionable” (Appendix Table S4;Fig.S1).Among them,21 species have only one birder record -many species mainly distributed in southern China,such as Chestnut Bulbul (Hemixos castanonotus)and Crow-billed Drongo (Dicrurus annectans),appear in this list (Zheng,2017).It would be interesting,both for tracking species range and for birders,to confirm these observations.The comparison also allows us to compile a“missing”species list-Shaanxi has 163 species on the expert lists but yet to be observed by any birder (Fig.2;Appendix Table S7).Endangered(EN)or Near Threatened(NT)species are more likely to be missing(Fig.3C).More species living in caves and subterranean,desert,and rocky areas are missing,consistent with the view of Zhou et al.(2020) that birders prefer landscapes where more birds can be sighted(e.g.,wetland).Birders’ bias in choosing locations might be responsible for the lack of data on some species,but some species might be becoming rare in the region because of environmental change.The missing species list can serve as the base for target birdwatching activities to recruit help from amateur birders to monitor the status of these species.
5.Conclusions
Knowing what species exists in a region is crucial for biodiversity research.It lays the foundation for designing conservation and environmental management policies.Citizen science is a powerful tool for researchers and policymakers (Chandler et al.,2017;Gilfedder et al.,2019).Here,we assessed the quality of birdwatching data in Shaanxi for studying species diversity and distribution.While not fully representing regional species diversity yet,the citizen science data can help discover species new to a province promptly and reveal range shifts for existing species.We compiled an inclusive checklist of species in Shaanxi from multiple sources,highlighting species that are yet to be observed or need verification for future birdwatching activities.The data also revealed a strong trend among bird species in Shaanxi: shifting their distribution ranges towards higher latitude,which might require adjustments to local conservation policies.More participants and more records will undoubtedly boost the percentage of species diversity represented and the value of birdwatching data for biodiversity research and conservation in the future.
Authors’ contribution
HH and YD conceived the study.YD,FJ and LX collected the data.YD analyzed data and drafted the manuscript.JL modifies the visual diagram.XZ,HH and YD contributed in paper review.All authors read and approved the final manuscript.
Declaration of competing interest
The authors declare that they have no known competing financial interests or personal relationships that could have appeared to influence the work reported in this paper.
Acknowledgements
We thank the China Bird Report Center and all citizen scientists for data support in this study.We are very grateful to Yuhan Fang,Zitong Wang,Ziyin Tang,Yan Liu for data collection.This study was supported by the Undergraduate Innovation and Entrepreneurship Training Program of Shaanxi Normal University (grant number cx2019162),the National Natural Science Foundation of China(grant number 31970407 to H.H.and grant number 31900313 to X.Z.).
Abbreviations
BRC the China Bird Report Center
BR the species checklist of Shaanxi Province from the BRC
QL the species checklist of the Middle Qinling in theAn Illustrated Guide to Birds in Qinling Mountains
AB the species checklist of Shaanxi Province from the Avibase website
Appendix A.Supplementary data
Supplementary data to this article can be found online at https://do i.org/10.1016/j.avrs.2022.100045.
杂志排行
Avian Research的其它文章
- Myological variation in the hindlimb of three raptorial birds in relation to foraging behavior
- Comparative analysis of the intestinal tract microbiota and feeding habits of five sympatric flycatchers
- Seasonal variations in gonad morphology and hypothalamic GnRH-I and GnIH in Eurasian Tree Sparrow,a multi-brooded passerine
- Within-brood body size and immunological differences in Blue Tit(Cyanistes caeruleus) nestlings relative to ectoparasitism
- Factors affecting post-release survival and dispersal of reintroduced Crested Ibis (Nipponia nippon) in Tongchuan City,China
- Long-term monitoring data reveal effects of age,population density,and environmental aspects on hatching success of Common Cranes (Grus grus)
