Effects of a check dam system on the runoff generation and concentration processes of a catchment on the Loess Plateau
2022-09-26ShuilongYuanZhanbinLiLiChenPengLiZeyuZhangJunzhengZhangAnnaWangkunxiaYu
Shuilong Yuan ,Zhanbin Li ,Li Chen ,Peng Li ,Zeyu Zhang ,Junzheng Zhang ,Anna Wang ,kunxia Yu
a State Key Laboratory of Eco-hydraulics in Northwest Arid Region of China,Xi'an University of Technology,Xi’an,710048,Shaanxi,China
b Key Laboratory of National Forestry Administration on Ecological Hydrology and Disaster Prevention in Arid Regions,Xi'an University of Technology,Xi’an,710048,Shaanxi,China
c Desert Research Institute,Las Vegas,NV,89012,USA
d Institute of Soil and Water Conservation Investigation and Planning of Shaanxi Province,Xi'an,710100,Shaanxi,China
Keywords:Check dam system Runoff generation Runoff concentration Instantaneous unit hydrograph Loess Plateau
A B S T R A C T:As an important soil and water conservation engineering measure,more than 100,000 check dams are constructed across the Loess Plateau;these dams play a vital role in reducing floods and sediment in the region.However,the effects of check dams on hydrologic process are still unclear,particularly when they are deployed as a system for watershed soil and water management.This study examined the watershed hydrologic process modulated by the check dam system in a typical Loess Plateau catchment.By simulating scenarios with various numbers of check dams using a distributed physically-based hydrological model,the effects of the number of check dams on runoff generation and concentration were analyzed for the study catchment.The results showed that the presence of check dams reduced the peak discharge and the flood volume and extended the flood duration;the reduction effect on peak discharge was most significant among the three factors.The system of check dams substantially decreased the runoff coefficient,and the runoff coefficient reduction rate was greater for rainstorms with shorter return periods than for rainstorms with longer return periods.The check dams increased the capacity of the catchment regulating and storing floods and extended the average runoff concentration time in the catchment that flattened the instantaneous unit hydrograph.This study reveals the influencing mechanism of check dam system on the watershed hydrological process under heavy rainstorm conditions and provides a theoretical basis for evaluating the effects of numerous check dams on regional hydrology and water resources on the Loess Plateau.
1.Introduction
Check dams are structures commonly built for flood attenuation in mountain streams that experience torrents(Conesa-García et al.,2007;García-Ruiz et al.,2013)and for soil erosion control in arid and semiarid regions with large sediment yields(Abbasi et al.,2019;Piton & Recking,2016).A check dam is composed of an embankment and a spillway.Some simple check dams consist of only embankments(Xu et al.,2013).Due to their capabilities in intercepting sediment,stabilizing gullies,and reducing flooding risk,check dams are especially widespread throughout China(Xu et al.,2004),Ethiopia(Guyassa et al.,2017),Iran(Hassanli et al.,2009),Italy(Bombino et al.,2009)and Spain(Boix-Fayos et al.,2007;Castillo et al.,2007).
The Loess Plateau is a severely eroded area in China that covers 640,000 km2,of which>70% is dominated by hills and gullies(Fu et al.,2017).This region is well known for its severe soil erosion and high sediment yields from its most erosion-prone area spanning approximately 472 thousand km2,including 91.2 thousand km2with sediment yields exceeding 8000 t/km2/a,according to Zhao et al.(2017b).Such grievous soil erosion on the Loess Plateau leads to the loss of agricultural land and increased flood risks in the lower Yellow River(Chen et al.,2007).To effectively control soil erosion and floods,more than 110,000 check dams over 5 m in height have been constructed in Loess Plateau catchments(Xu et al.,2004).
Research on check dams around the world has focused on their geomorphological and hydrological effects.Bombino et al.(2009)found that there were statistically significant differences in channel form and sediment and vegetation development among the upstream,downstream,and intermediate sections of check dams.The results of Guyassa et al.(2017)showed that the implementation of check dams combined with vegetation reduced peak flow discharges and runoff volumes as a large part of runoff infiltrated the sediments deposited behind the check dams.Nyssen et al.(2010)investigated the hydrological response of a degraded catchment with check dams over a year and concluded that this type of catchment management lead to a higher infiltration rate and an 81% reduction in direct runoff volume In addition,Martín-Rosales et al.(2007)found that the proportion of runoff that infiltrated through check dams varied from 3%to more than 50%.
The Loess Plateau is the region with the largest number of check dams in the world.There have been many studies on the effects of check dams on the hydrological processes of basins.Shi et al.(2019)simulated the water and sediment processes of the Wuding River using the SWAT model,and the results showed that the construction of check dams reduced runoff and sediment transport by 12%and 11.7%,respectively.Li et al.(2017)applied the SWAT model to simulate monthly runoff and sediment loads in the Huangfuchuan Basin,and the results showed that the check dams contributed 65.2% to runoff decline and 78.3% to sediment load reductions within the period from 2000 to 2012.At the catchment scale,Yuan et al.(2019)applied the MIKE model to simulate floods for a rainstorm event and found that the flood peak and flood volume were reduced by 65.3%and 58.7%,respectively,with a check dam system.Tang et al.(2020)investigated the influences of filled check dams with different deployment strategies on floods in a Loess Plateau catchment and found that filled check dams were still able to reduce flood peaks by 31%—93% under different deployment strategies.Wang et al.(2021)quantitatively assessed the impacts of a check dam system on catchment flood characteristics through a hydrodynamic model,and the results showed that implementing check dams significantly and effectively mitigated flood processes and increased runoff infiltration in the regions upstream of the dams.A physics-based distributed model,the integrated hydrology model(InHM),was employed to simulate the impacts of check dam systems on hydrologic processes,and the results showed that check dams significantly altered the water redistribution in the catchment and influenced the groundwater table in different periods(Tang et al.,2019).
Studies on the effects of check dams on runoff and sediment have mainly focused on the reduction efficiencies of flood volumes and sediment yields and on changes in the flood hydrographs of the studied watershed outlet.However,details on the ways in which check dams affect the generation and concentration processes of runoff in watersheds are still unclear,and the potential influence of check dams on the hydrologic process needs to be systematically researched further.In addition to the considerable water storage capacity of check dams,deposition also changes landforms in watersheds;therefore,the effects of check dams act throughout the entire hydrological process in a basin.The main objectives of this study are to analyze(1)the effects of various numbers of check dams on the flood hydrograph of the studied catchment,(2)the effect of various numbers of check dams on the runoff generation capacity of the catchment and(3)the effect of various numbers of check dams on the runoff concentration process in the catchment.
2.Study site and data
2.1.Study area
We conducted this study at the Wangmaogou(WMG)catchment(110°20′26′′—110°22′46′′E,37°34′13′′—37°36′03′′N),located in Suide County,Shaanxi Province,on the Loess Plateau of China(Fig.1a).The catchment covers a 5.97 km2drainage area and ranges in elevation from 936 to 1188 m above sea level.The main channel has a length of 3.75 km,and the average slope of the channel is 2.7%(Xu et al.,2018).The catchment has a temperate,semiarid continental monsoon climate,with four distinct seasons and large temperature differences.The annual average temperature of the WMG catchment is 8°C,ranging between 39°C and-27°C.Although precipitation varies yearly,it is distributed unevenly throughout the year.The rainfall from July to September accounts for 65% of the annual rainfall(Zhao et al.,2017a).At present,23 check dams exist in the WMG catchment,among which 15 check dams are still running normally and have the capacity to store sediments(Fig.1b);this system consists of 1 key check dam(Fig.2a),6 middle check dams(Fig.2b)and 8 small check dams(Fig.2c).
2.2.Data source and processing
The land use in the catchment was visually interpreted from Quick Bird images taken in 2004 with 0%cloud cover.The land uses were divided into seven land use types(Fig.1c),and the statistics of different land use types are provided in Table 1.
Moreover,we sourced topographical data from the China National Bureau of Surveying and Mapping.The survey time was 2000,the geodetic datum was the 1980 Xi'an coordinate system,and the contour distance was 5 m.After scanning the topographic map,we generated a digital topographic map using spatial registration,splicing,and manual tracking.We further established an irregular triangulation network through ArcGIS 10.1 and then interpolated the output to derive a digital elevation model(DEM)(Fig.1d).The cross sections of channels used in MIKE 11 were extracted from the DEM of the catchment with ArcGIS 10.1.The dimension of discharge structures was obtained by field measurement.
For hydrological modeling,we obtained the 1980—2010 rainfall,runoff,and sediment data of the WMG catchment from Hydrological Experimental Data of the Suide Runoff Experimental Station of the Yellow River Basin,published by the Yellow River Commission of the Ministry of Water Resources.From this dataset,eight flood events that occurred from 1997 to 2001 were selected for the model calibration and verification.
Furthermore,the soil volumetric water content was measured using TDR(Soil Moisture Time Domain Reflectometer,TRIME-PICO IPH,Germany).A total of 54 monitoring points were set up in the catchment,including 21,21,3,and 9 monitoring points in the terraces,forested lands,grasslands,and dam fields,respectively.From July 2014 to November 2017,57 measurements were carried out,with measurements being taken once or twice a month.The measuring depth was 1—3 m,and measurement were collected at 0.2-m intervals.
Other meteorological data for the study area came from the“Daily Data Set of Surface Climatic Data of China”(http://data.cma.cn/).Daily data of 14 meteorological factors,including the daily average pressure,the highest pressure,the lowest pressure,and other variables,collected from 752 meteorological observation stations in 1951 were downloaded.

Fig.2.(a)Key check dam,(b)Middle check dam,(c)small check dam.
Soil characteristics,such as the saturated water conductivity(Ks)and bulk density(γ),were derived from soil sampling and laboratory tests.The soil sampling covered six land use types in the WMG catchment.The sampling scheme was composed of three sampling points in each plot and three sample replicates in the 0—50-cm soil layer at each sampling point.The first soil sample was dried to determine the bulk density and saturated water content.The second and third soil samples were used to measure the respective saturated hydraulic conductivity(constant-head saturated hydraulic conductivity test)and soil moisture characteristic curve(high-speed centrifuge method).The soil-water characteristic curves of various soils were fitted with the Van Genuchten functions to obtain the V-G model parameters of the different soils(Table 2).

Table 1Land use types in the WMG catchment and Manning coefficients of different land use types.
Finally,we observed the groundwater levels using an automatic gauge(Level logger,Solinst Company,Canada).The observations were conducted in two wells situated at the outlet and the middle part of the catchment.
3.Method
3.1.Modeling approach
A large number of models that can simulate the rainfall-runoff process in small watersheds exist.In this study,the distributed hydrological model MIKE SHE and the one-dimensional hydrodynamic model MIKE 11 were coupled to simulate the rainfall-runoff process in the studied small watershed under different silting conditions in check dams.
MIKE SHE has a clear physical basis and excellent applicability from the soil column scale to the large watershed scale(Graham&Butts,2005,pp.245—272).MIKE SHE can describe all hydrological processes(such as evaporation,precipitation,infiltration,flow generation,and confluence).It describes overland flow using the 2-dimensional Saint-Venant diffusion wave equation,soil water movement using the 1-dimensional Richards equation,and groundwater movement using the 3-dimensional Darcy's equation.MIKE 11 simulates the flow motion of an open channel through a 1-dimensional Saint-Venant dynamic wave equation.More details of MIKE are provided in the user manual of the model(DHI Software,2014).
The horizontal resolution of the computational grid of MIKE SHE was set to 40 m×40 m in the entire modeling region.This was applied to all modules,including overland flows,unsaturated zones,and saturated zones.The vertical resolution of the grid was 0.1 m in the near-surface zone,0.5 m at depths of 0.5—10 m,and 1 m at depths below 10 m.The upper boundary of the model was a time series of spatially uniform rainfall.The evaporation that occurred during rainfall was small and was ignored in this study.
Additionally,the value of the Manning coefficient was set considering the land use type based on the literature(Table 1)(Hou et al.,2018).As described above,the soil hydraulic parameters in the unsaturated zone(Table 2)were obtained in laboratory tests.The initial soil conditions were set as those given by the water contents,as estimated by meteorological factors.The period of monitored soil moisture did not cover the modeling period used in this study;however,it was possible to estimate the previously unmeasured soil moisture with continuous meteorological monitoring data.The estimation was performed by regression between the measured soil moisture contents and meteorological factors.
We observed that the groundwater level had a minimum depth of 3 m.The active hydrologic layer of the unsaturated zone on the Loess Plateau was within a depth of 0.5 m underground.Therefore,groundwater has little chance to interact with surface water or soil water.In this study,the groundwater level at the lower boundary of the model was set as 3 m below the lowest point of the basin,and the parameters of the saturation zone were set as the defaults for the model.
MIKE 11 was used to simulate the channel flows.The discharge process of the spillway of each check dam was calculated using the weir flow formula,while the drainage through the vertical and horizontal shafts was calculated using the orifice discharge formula(Zhang et al.,2019,2020).After the model was established,two out of the eight measured rainfall-runoff events were selected for the parameter calibration,and the other six were used for the model verification.
3.2.Sensitivity analysis of parameters
Many parameters exist in the MIKE SHE model.Calibrating all the parameters can lead to overfitting of the model.Therefore,most of the physical parameters can be determined directly or indirectly through objective field measurements to minimize the number of calibrated parameters.Before model calibration,we performed a sensitivity analysis of the parameters to screen out sensitive parameters that influenced the basin's hydrological process.Then,the sensitive parameters were varied,while the insensitive parameters were fixed.
The MIKE SHE model has a sensitivity analysis tool.The sensitivity analysis adopted for the current study was the local sensitivity analysis.The sensitivity coefficient(Si)is defined as follows(DHI Software,2014):

whereFis the objective function and θiis thei'th test parameter.The greater the value ofSiis,the more sensitive the parameter is to the objective function.
Nine parameters were selected for the sensitivity analysis:the saturated hydraulic conductivities(Ks)of the dam field(KS1),terrace field(KS2),slope cropland(KS3),f forest land(KS4),grass land(KS5),rural land(KS6),and transportation land(KS7).The other parameters were the stagnant water storage(DS)and the Manning coefficient of channels(M).We found the parameter sensitivity in the order of KS5>M>KS3>KS2>DS>KS1>KS4>KS7>KS6.The first six parameters were sensitive,while the others were not(Table 3).
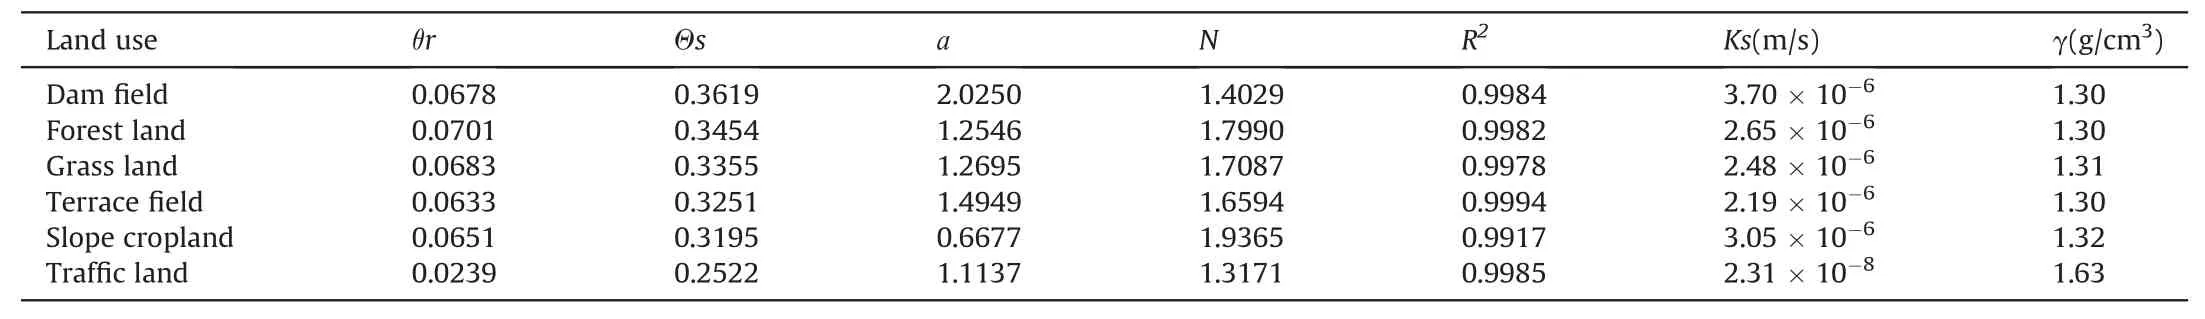
Table 2Parameters of soil physical characteristics.
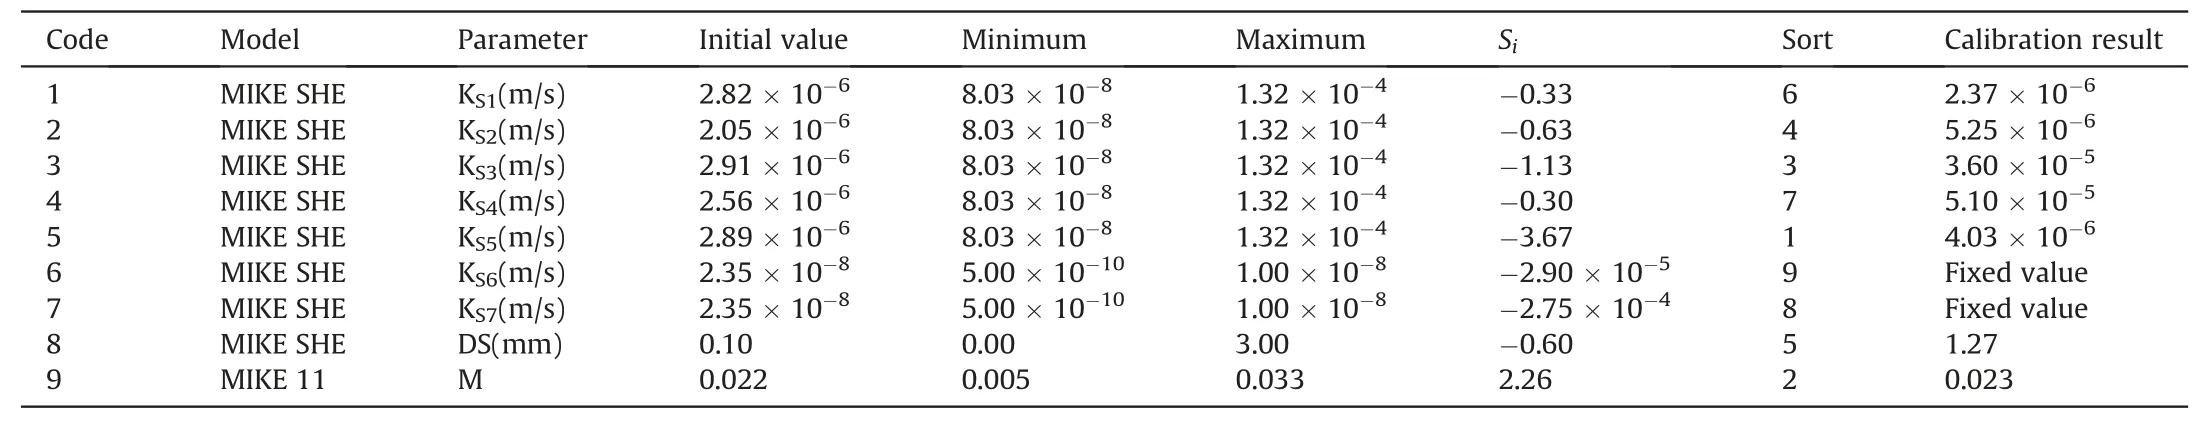
Table 3Sensitivity analysis and calibration results of model parameters.
3.3.Calibration and validation of the model
We selected eight typical rainstorm floods that occurred during the period from 1997 to 2001 for the calibration and verification of the model.The floods that occurred on July 18,1997 and July 29,1997 were used for the calibration,while the rest were used for the verification(Table 4).Based on the sensitivity analysis results,seven parameters(KS5,M,KS3,KS2,DS,KS1,and KS4)were selected for the model calibration.The model was calibrated by the population simplex evolution(PSE)and trial-and-error methods.In this study,the efficiency of the model was evaluated by the flood peak deviation(D),determination coefficient(R2),and Nash efficiency coefficient(NSE)using Eqs.(2)—(4)(Henriksen et al.,2003;Nash&Sutcliffe,1970;Tague et al.,2004):

whereoiandoare themeasuredandaverage runoffs(m3/s),respectively,andsiandsarethesimulatedandaveragerunoffs(m3/s),respectively.
According to Moriasi et al.(2007),when both the determination coefficient and Nash efficiency coefficient are greater than 0.5,the model is considered satisfactory.The results of the model parameter calibration are shown in Table 4.Most of the calibrated parameter values were close to the measured values,while somewere significantly different.The latter are likely related to the lack of representation that arose because of the insufficient quantity of the measured points.During the calibration and verification,the simulated flood and the observed flood processes were highly consistent,and the model simulated the dynamic changes of the flood process efficiently(Fig.3).All theR2values for the modeling results in the calibration stage were>0.9,while theNSEvalues were>0.85,and the averageDwas 14.43%.Additionally,in the validation stage,all theR2values were>0.55,theNSEvalues were>0.5,and the averageDwas 7.53%(Table 4).Therefore,the model was deemed effective in the analysis of the modeled scenarios.
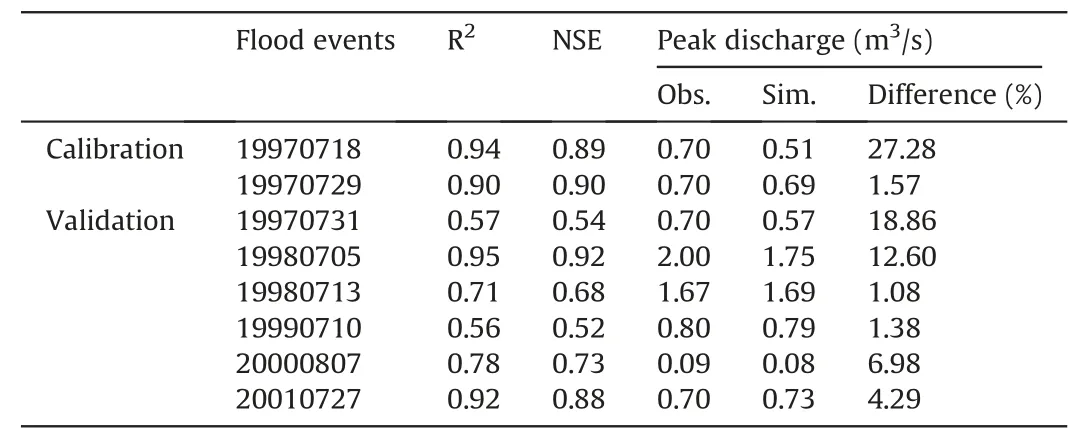
Table 4Evaluation of model effectiveness.
3.4.Scenarios analysis
3.4.1.Designed rainstorm
The rainstorms designed for the WMG catchment were calculated using the Hydrology Manual of Yulin City,to which the studied watershed belongs.The statistical data of the Yulin Hydrology Manual show that 6 h is the most frequent rainstorm duration in the WMG catchment;therefore,this duration was used as the designed rainstorm duration in this study.Likewise,the 1980 to 2017 catchment precipitation data provide maximum precipitation durations of 1,3,and 6 h for individual rainfall events.Based on these data,the 1—6 h designed rainstorms of 6 return periods,including 10,20,30,50,100,and 200 years,were calculated through a frequency analysis using the P-III distribution(Fig.4).
3.4.2.Scenarios for modeling analysis
With the variety in the number of check dams,16 scenarios were designed for the modeling analysis,namely,the original natural channel scenario(D0),the scenario with 1 check dam(D1),the scenario with 2 check dams(D2),…,to the scenario with 15 check dams(D15),as shown in Table 5.The addition of check dams in the design was performed according to the sequence that tributaries are prior to the main stream;tributaries in the upstream region are prior to tributaries in the downstream region;tributaries in the left bank are prior to tributaries in the right bank;and,for a given stream,the upstream region is prior to the downstream region,shown as Fig.1b.
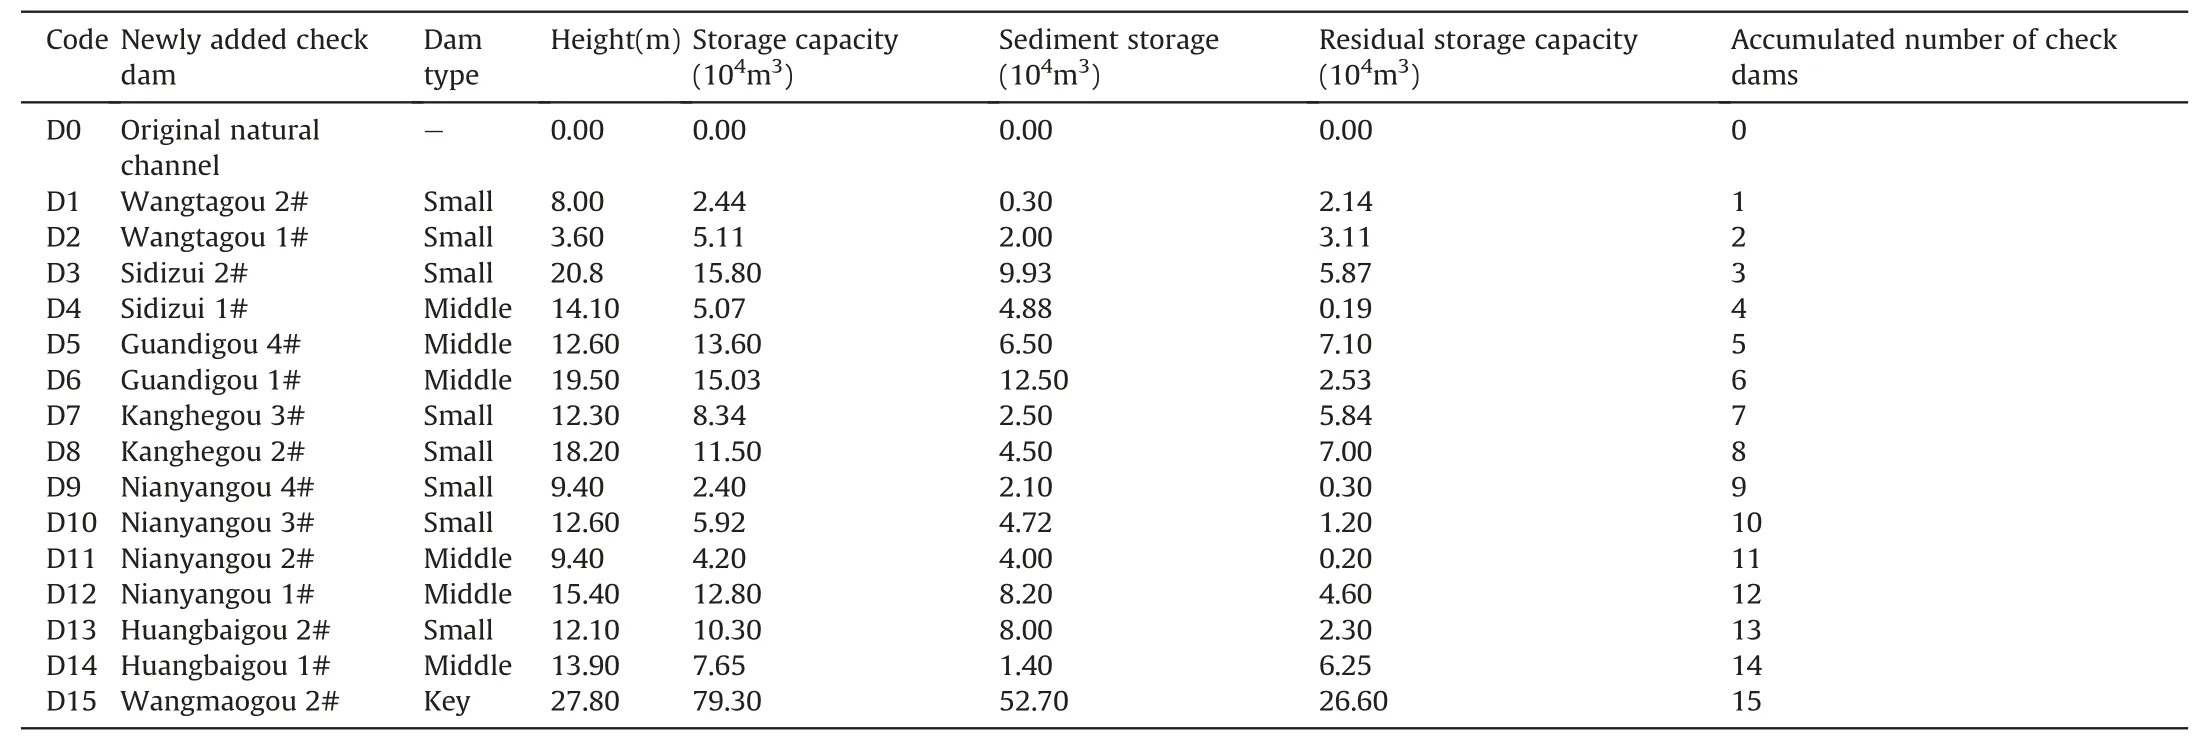
Table 5Details on scenarios used for the modeling analysis.
3.4.3.Instantaneous unit hydrograph
An instantaneous unit hydrograph represents the surface runoff concentration process formed by the unit net rain in infinitesimal time steps(Jena & Tiwari,2006).The differences among instantaneous unit hydrographs in various scenarios can reflect the effects of check dams on the runoff concentration process in a catchment.A Nash instantaneous unit hydrograph,which is expressed with an incompleteΓfunction and only includes two parameters,n and k,is frequently used in valley flood forecasting.Its common form is given as follows(Agirre Bereziartua et al.,2005):
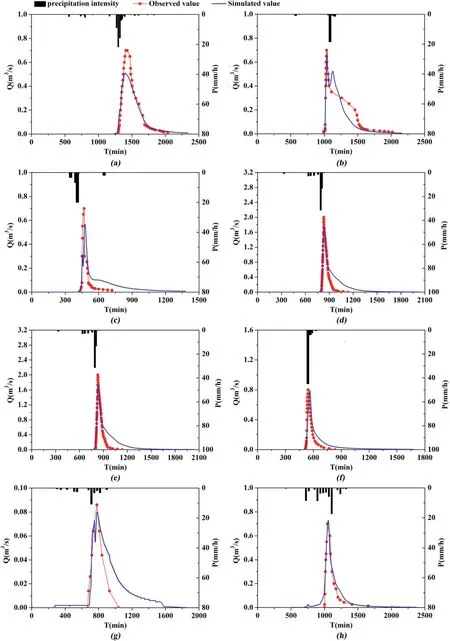
Fig.3.Observed and simulated runoff processes in the WMG catchment,among which(a)19970718 and(b)19970729 were used for the calibration of the model;(c)19970731,(d)19980705,(e)19980713,(f)19990710,(g)20000807,and(h)20010727 were used for the model verification.
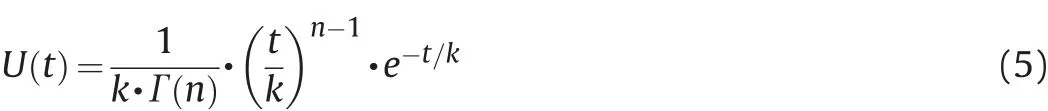
whereU(t)is the ordinate of the unit hydrograph;trepresents time;kis the spreading time of the linear reservoirs;nis the number of reservoirs;Γ(n)is the gamma function ofn;andeis the base number of the Napierian logarithm.
The parameters ofnandkwere calculated by applying the moment method.The equations are given as follows:

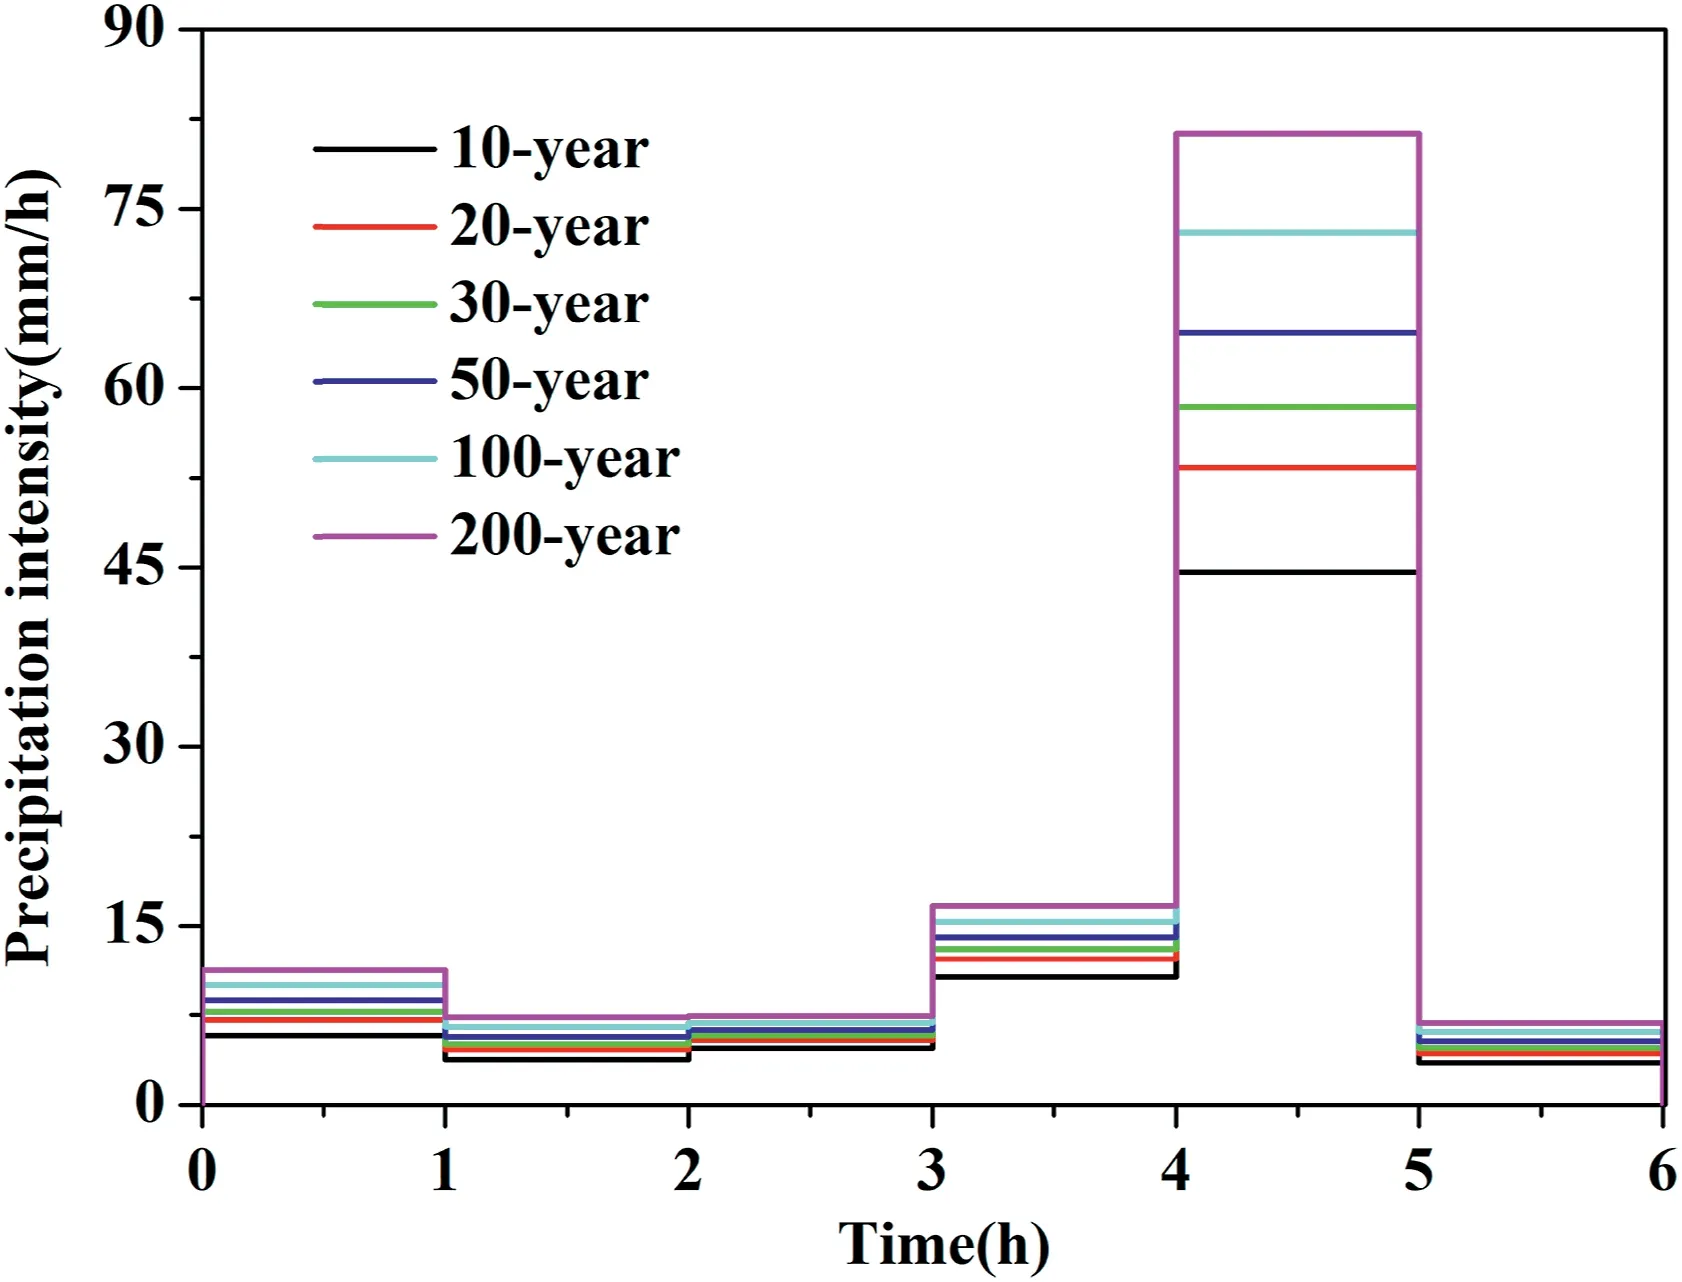
Fig.4.Designed rainstorm processes of different return periods.

whereare the first-order moments of origin of net rain and surface runoff,respectively;are the secondorder central moments of net rain and surface runoff,respectively;andmis the average time of runoff concentration in the catchment.
3.4.4.Determination of theflow velocity
An equation presented in the National Engineering Handbook of the US Soil Conservation Service for calculating overland flow velocity as a function of the land surface slope is applied to calculate the flow velocity in this study.The expression is given as follows:

whereVis the flow velocity(m/s);Sis the slope along the flow direction;andkis the velocity factor(m/s),reflecting the effect of the land use type onV,and is valued with reference to SCS(1972).It is useful to limit the velocity values computed by Equation(9)to an acceptable range to ensure that runoff flows with a minimal velocity from areas with flat slopes and small drainage areas and to ensure that flows in large streams do not move with unrealistically high velocities(Maidment et al.,1996).
3.4.5.Analysis of scenarios
The hydrologic processes in the scenarios designed in section 3.4.2 with rainstorms of different return periods were simulated by a distributed hydrological model to analyze the differences among the hydrologic processes in scenarios with check dams and that in the original channel scenario.The influence of check dam construction on the hydrological process was analyzed by comparing the peak reduction rate(PR),the flood volume reduction rate(FVR),and the flood duration reduction rate(FDR).The peak reduction rate can be calculated as follows:

wherePOandPiare the flood peak discharges at the outlet of the studied watershed in the original channel condition and after the check dam was constructed,respectively.The flood volume reduction rate can be calculated as follows:

whereFVOandFViare the flood volumes at the outlet of the studied watershed in the original channel condition and after the check dam was constructed,respectively.The flood duration reduction rate can be calculated using the following equation:

whereFDOandFDiare the flood durations at the outlet of the studied watershed in the original channel condition and after the check dam was constructed,respectively.
4.Results and analysis
4.1.Effects of check dams on flood process
Peak discharge,flood volume and flood duration are essential elements used to describe a flood hydrograph;therefore,the effects of check dams on these three factors were considered.As shown in Fig.5,compared with the flood hydrograph of the original channel scenario,the construction of check dams increased the flood duration and decreased the peak discharge and volume of floods in the studied catchment.In addition,linear regression relations can be established using the number of check dams with the incremental rate of the flood duration and the reduction rates of the flood peak and flood volume,with coefficients of determination of 0.94,0.77 and 0.55,respectively.The excellent linear response relationship between the reduction rate of the flood peak and the number of check dams indicates that the effect of the construction of check dams is more direct on the peak discharge than on the other factors.The slope of the fitting equation between the flood peak reduction rate and the number of check dams is greater than that between the flood volume reduction rate and the number of check dams,indicating that the effect of the construction of check dams on the peak discharge is greater than that on the flood volume(as shown in Fig.5a and b).The linear fitting degree between the flood duration increment and the number of check dams is relatively low;nevertheless,the flood duration increment increases in stages with increased numbers of check dams,which reflects that the construction of key and middle check dams will sharply increase the flood duration.With the construction of all 15 check dams,the average flood peak reduction rate,flood volume reduction rate and flood duration increment during rainstorms with various return periods were 70.32%,19.61% and 161.32%,respectively,which indicated that the reduction and impedance effects of check dams on floods were greater than the interception effect.Moreover,with a given number of check dams,the flood peak reduction rate and the flood volume reduction rate were greater in rainstorms with shorter return periods,while the flood duration increment was smaller.
4.2.Effects of check dams on runoff generation process
The runoff coefficient is the ratio of the runoff depth and precipitation and can reflect the runoff generation capacity of a watershed.As shown in Fig.6a,the runoff coefficient of the studied catchment decreased continuously with the increasing number of check dams during rainstorms with various return periods,and with a given number of check dams,the runoff coefficient was greater in rainstorms with longer return periods than in rainstorms with shorter return periods.As shown in Fig.6b,a power function relation can be established between the runoff coefficient reduction rate and the number of check dams,with a coefficient of determination above 0.95.Parameter a in the power function decreases with the increasing length of the return period,while parameter b remains constant;therefore,parameter a can be used to represent the effects of rainfall intensity on the runoff coefficient reduction rate,and parameter b can represent the effects of the underlying surface conditions.The runoff coefficient reduction rate of the catchment increased with the increasing number of check dams during rainstorms with various return periods,and with a given number of check dams,the runoff coefficient reduction rate was greater in rainstorms with shorter return periods.With the construction of all 15 check dams,the runoff coefficient decreased by 24.13% during rainstorms with a return period of 10 years and decreased by 14.96%during rainstorms with a return period of 200 years,indicating that the effect of the construction of check dams is greater on the runoff generation process during rainstorms with shorter return periods than during rainstorms with longer return periods.
4.3.Effects of check dams on the runoff concentration process
The differences among flood hydrographs in watershed outlets caused by the same net rainfall reflect the differences in the runoff concentration processes in the watershed;therefore,differences in the unit hydrographs among scenarios with various check dam conditions can reflect the effects of check dam construction on the runoff concentration process in the watershed.As shown in Fig.7a,in rainstorms with a return period of 30 years,the peak discharges of the instantaneous unit hydrographs in scenarios with check dams decreased obviously compared with the original channel scenario,indicating that the construction of check dams increased the regulation and storage capacity of the catchment.With a further analysis of the changes in the peak discharges of the instantaneous unit hydrographs,it can be found that the effects of check dams of different types on the peak discharges reflected in the instantaneous unit hydrographs are different.In particular,the peak discharge shown in the instantaneous unit hydrographs decreased significantly after the construction of key and middle check dams with flood storage capacities.Furthermore,the peak discharge shown in the instantaneous unit hydrographs decreased by 86.20%with the construction of all 15 check dams(Fig.7b).The variations in the instantaneous unit hydrographs representing rainstorms with other return periods are similar to those representing the 30-year case.

Fig.5.(a)Flood peak reduction rate,(b)flood volume reduction rate,and(c)flood duration incremental rate with the changing trend of the number of check dams.

Fig.6.(a)Runoff coefficient and(b)runoff coefficient reduction rate with the changing trend of the number of check dams.

Fig.7.(a)Instantaneous unit hydrograph and(b)peak discharge of the instantaneous unit hydrograph in scenarios with various check dam conditions.
The runoff concentration time is an important index used to reflect the regulation and storage capacity of a catchment.The relations of the average runoff concentration time with the number of check dams during rainstorms with various return periods are shown in Fig.8.The average runoff concentration time increases with an increase in the number of check dams during rainstorms with various return periods.In rainstorms with a return period of 30 years,the average runoff concentration times in the scenario with all 15 check dams increased by 361.86% compared with the original channel scenario.With a given number of check dams,the average runoff concentration time is longer during rainstorms with longer return periods.
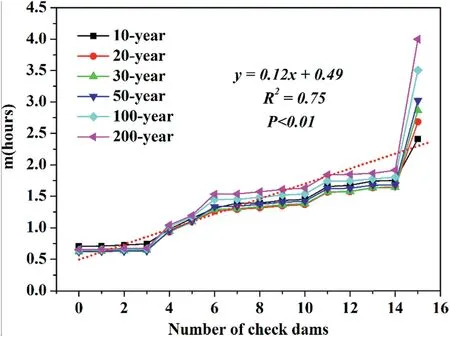
Fig.8.The relations among the average runoff concentration times with the numbers of check dams during rainstorms with various return periods.
5.Discussion
5.1.Effects of check dams on the flood process
Based on the analysis above,the construction of check dams can significantly increase the flood duration and decrease the peak discharge and flood volume.To understand the effects of the construction of check dams on flood hydrographs,we subtracted the flood hydrograph representing the original channel scenario from the flood hydrographs representing scenarios with check dams,and the resulting difference reflected the effects of check dams on the flood process in the catchment.As shown in Fig.9,with the construction of all 15 check dams,the peak discharge decreased significantly,and the volume in the phase after peak flow had passed(the pink filled polygon)increased obviously.The flood process is obviously flattened rather than the case in which the peak discharge rises and drops steeply.With further statistics on the characteristics of flood processes,it can be found that the peak discharge,average discharge and coefficient of variation all decrease with an increase in the number of check dams(Table 6);thus,the construction of check dams can moderate and flatten the flood process.

Table 7Water balance analysis in various check dam scenarios during rainstorms with return periods of 30 years.
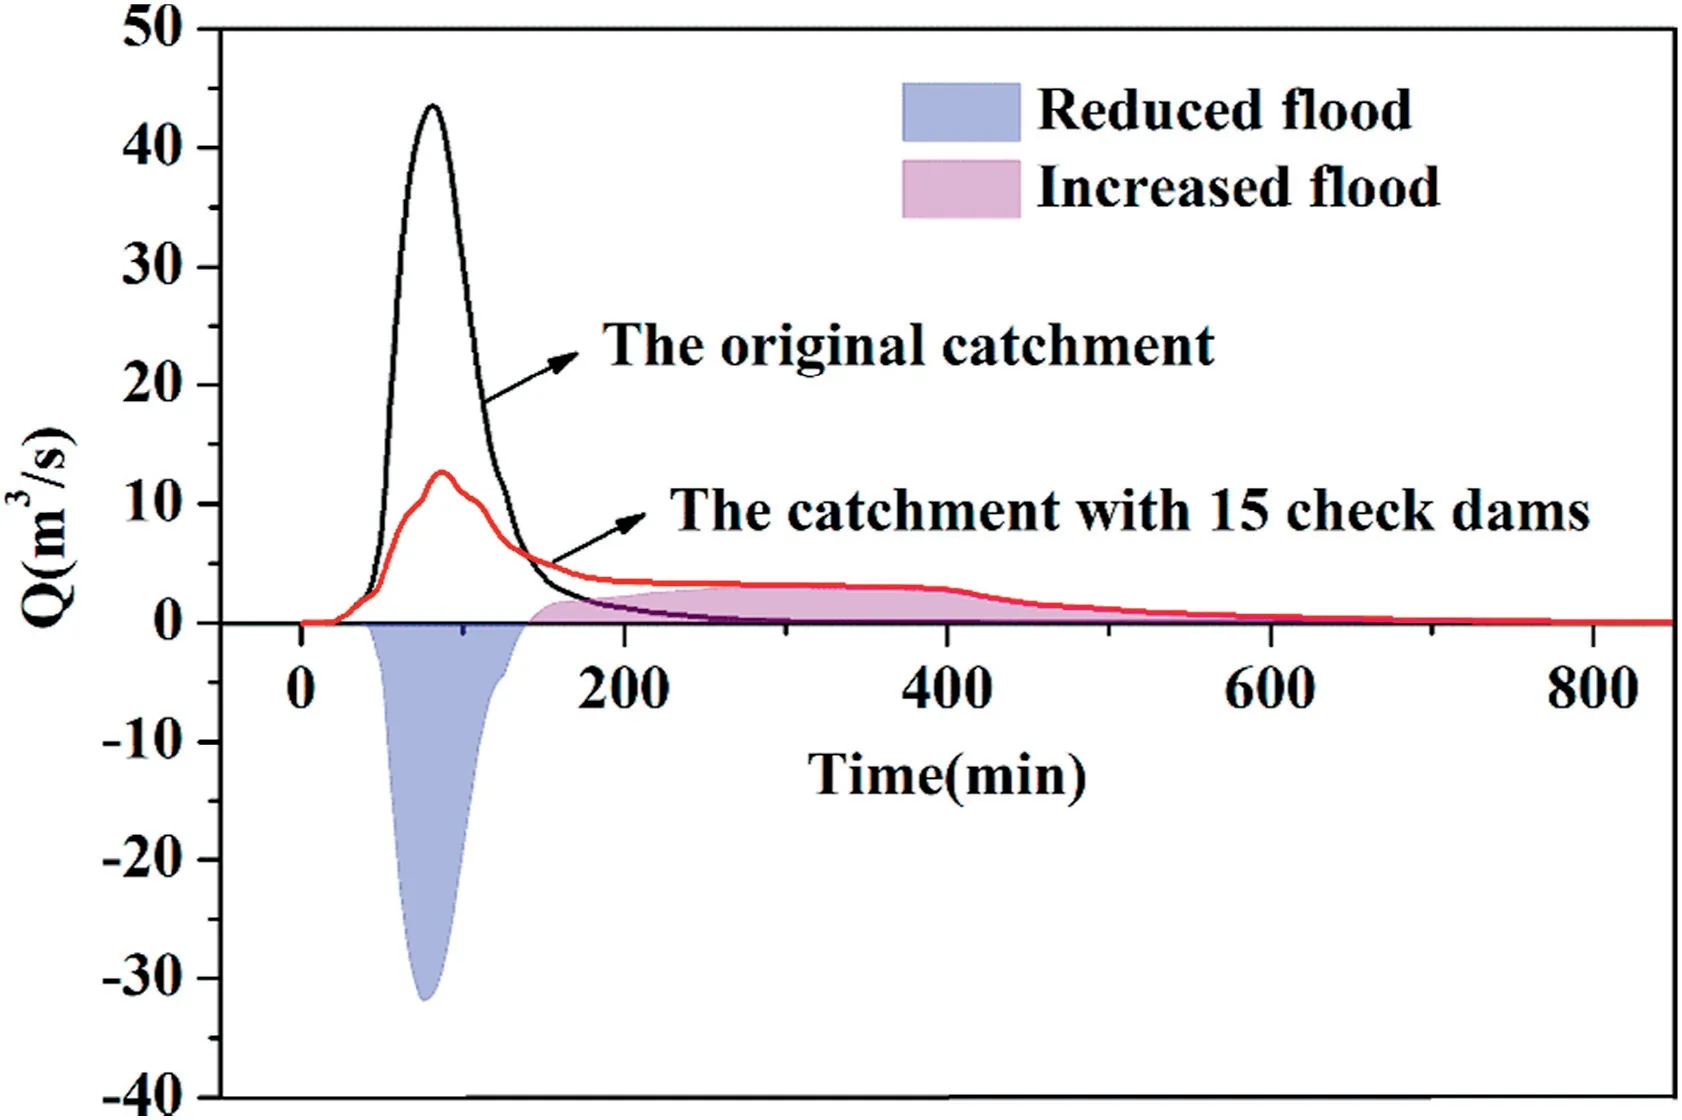
Fig.9.Effects of check dams on flood processes in rainstorms with return periods of 30 years.
Numerous studies have shown that the sediment transport process can be predicted by the flood process in a watershed,according to the relation of the power function between the two processes;moreover,a power exponent above 1 reflects that a decrease in runoff discharge will lead to a significant decrease in the sediment transport rate.Accordingly,the construction of check dams can decrease the sediment load in a watershed(Isik,2013;Syvitski et al.,2000;Walling,1977).With the progression of sediment deposition behind a dam,the reservoir experiences a decrease in its sediment storage capacity,a reduction in the channel gradient,and an increase in the cross-sectional width(Bombino et al.,2014).Tang et al.(2020)studied the effect of check dam system in which designed sediment storage capacities of check dams were fully filled with sediments on the runoff process,and the results showed that filled check dams were still able to reduce flood peak by 31%—93% under different deployment strategies.With the sediment accumulation behind the check dam,the effect to intercept flood of the dam body decreases,while the effect to mitigate flood of the deposited sediment behind the check dam increases.In addition,some studies have showed that the deposited sediment increased the infiltration and decreased the directrunoff(Martín-Rosales et al.,2007;Nyssen et al.,2010).Yuan et al.(2019)studied the effect of check dam dimension on catchment flood,and found that the flood peak can be reduced by key check dams,middle check dams and small check dams by 27.28%,33.39%and 40.13%,respectively,of which the higher flood peak reduction effects of middle and small check dams in comparison to key check dams were mainly due to the much larger numbers of middle and small check dams than that of the key check dams.
5.2.Effects of check dams on the water balance
The construction of check dams decreases the runoff generation capacity of a watershed,and there exists a greater reduction rate in the runoff coefficient during rainstorms with short return periods than during rainstorms with long return periods,resulting in significant changes in the water balance of a watershed during rainstorms.We further analyzed the effects of check dams on the water balance of the studied catchment with a case study of rainstorms with a 30-year recurrence.As shown in Table 7,with an increase in the number of check dams,the infiltration increased,and the surface storage increased significantly,leading to a significant decrease in runoff at the outlet of the catchment.Some of the surface storage evaporated directly,and the rest replenished the soil water through infiltration or was even converted into groundwater or base flow(Huang et al.,2013;Norman et al.,2016;Parimalarenganayaki &Elango,2018).Luo et al.(2020)found that precipitation directly affected changes in the shallow groundwater and base flow in watersheds with check dams.The results of this study show that the runoff coefficient reduction rate is greater during rainstorms with short return periods than during rainstorms with long return periods.Due to the limit of the storage capacity of a check dam and the short duration of a rainstorm,the differences among the sums of the direct infiltration and surface storage of rainstorms with various return periods are small,resulting in the greater effect of check dams on the runoff coefficient during rainstorms with short return periods.The research of(Polyakov et al.,2014)showed that the construction of check dams decreased the number of runoff generation events during rainstorms with short return periods by 60%.The higher infiltration and higher soil fertility cause dam fields to be stable and high-yield farmland on the Loess Plateau(Guyassa et al.,2017;Xu et al.,2004,2018).
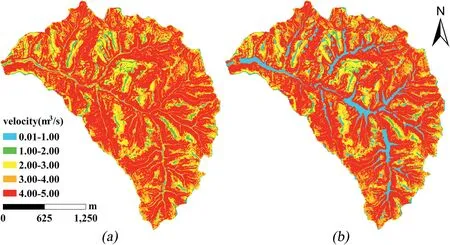
Fig.10.Spatial flow velocity field of(a)the original catchment and(b)the catchment with check dams.
5.3.Effects of check dams on the runoff concentration process
The construction of check dams not only can decrease runoff generation but also can change the concentration process of runoff.The effects of check dams on reducing and delaying flood peaks have been suggested by numerous studies,but the effect of check dams on runoff concentration has rarely been studied(Guyassa et al.,2017;Tang et al.,2020;Wang et al.,2021).The results of this study show that the check dams flattened the instantaneous unit hydrograph and extended the average concentration time by 361.86%.The runoff concentration process is mainly affected by the flow velocity,and the spatial flow velocity field of the study catchment before and after check dam construction was calculated by Eq.(9),as shown in Fig.10.Comparing Fig.10b with Fig.10a,it can be found that the construction of check dams significantly decreased the velocity in channels.With the construction of check dams,the low-velocity area decreased obviously,while the highvelocity area increased obviously(shown as Table 8),and theaverage velocity of the catchment decreased by 6.68%(shown as Table 9).The unit hydrograph represents the flood hydrograph formed at the watershed outlet by unit net rainfall through the regulation of the watershed,reflecting the effect of the watershed on the runoff concentration process.(Rodríguez-Iturbe & Valdes,1979)believed that the instantaneous unit hydrograph is closely related to the geomorphic parameters of a basin.(Cudennec et al.,2004)believed that the use of geomorphic parameters can explain unit hydrograph and geomorphologic unit hydrograph theories.The construction of check dams chronically changes the geomorphic parameters of a natural channel,accordingly changing the unit hydrograph and the runoff concentration process.This study preliminarily analyzed the effects of check dam construction on the unit hydrograph of a watershed;establishing the relationships among check dams,geomorphic parameters and the parameters of unit hydrographs remains a topic to be studied further.
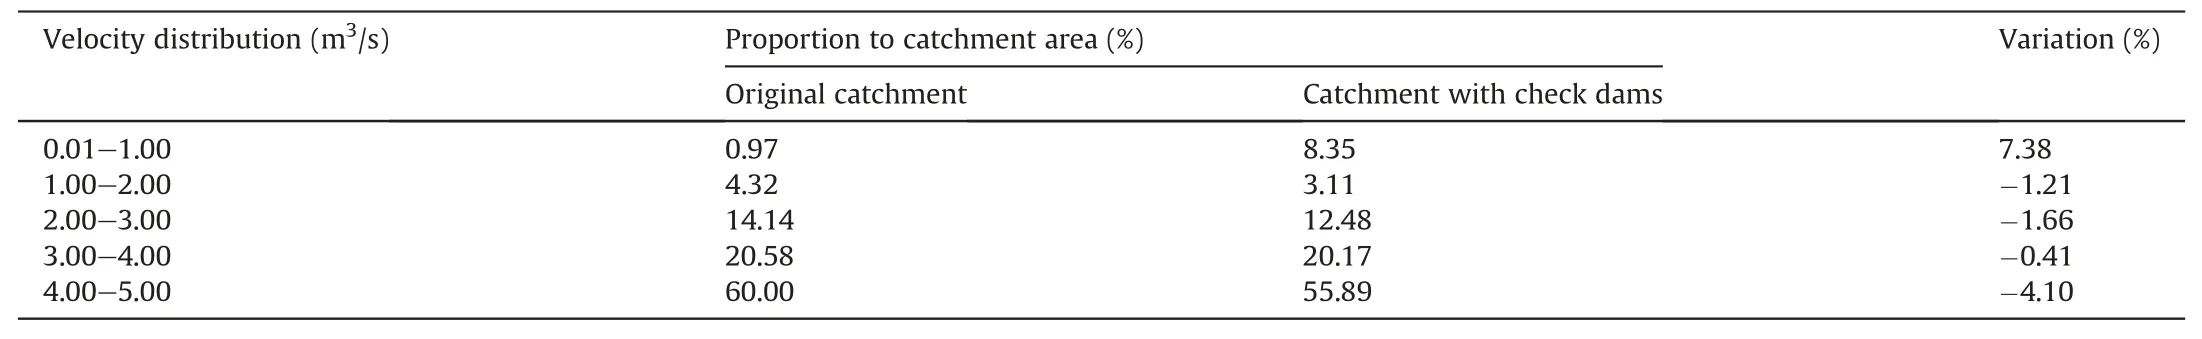
Table 8Statistics of the flow velocity distribution.

Table 9Statistical characteristics of the flow velocity.
6.Conclusion
We simulated the hydrologic process of the study catchment regulated by a multi-check dam system.Scenarios with various numbers of check dams were simulated using a distributed physically-based hydrological model to analyze the effects of the number of check dams on runoff generation and the concentration process and flood process.The results showed that the peak discharge reduction rate,the flood volume reduction rate and the flood duration incremental rate increased linearly with the number of check dams,and the peak discharge reduction rate showed a stronger response to the variation in the number of check dams than to the other factors.The peak reduction and hydrograph impedance effects of check dams on floods are greater than the flood volume interception effect.With the construction of the whole check dam system,the average flood peak reduction rate,flood volume reduction rate and flood duration increment during rainstorms with various return periods were 70.32%,19.61% and 161.32%,respectively.The runoff coefficient reduction rate of the catchment increased with an increase in the number of check dams during rainstorms with various return periods.The effect of the construction of check dams was greater on the runoff generation process during rainstorms with shorter return periods than during rainstorms with longer return periods.With a given number of check dams,the runoff coefficient reduction rate was greater for rainstorms with shorter return periods than for rainstorms with longer return periods.The construction of check dams increased the capacity of the studied catchment in flood storage and flood hydrograph modulation and changed the runoff concentration process in the catchment.Compared with the original channel scenario,the peak discharges of the instantaneous unit hydrographs decreased when check dams presented,and the flood process was flattened.The average runoff concentration time increased with an increase in the number of check dams for rainstorms of all return periods.
Acknowledgements
This research was supported by the National Natural Science Foundation of China(51779204,51879281,5207910),Program for Science & Technology Innovation Research Team of Shaanxi Province(2018TD-037),and the Research Fund of the State Key Laboratory of Eco-hydraulics in Northwest Arid Region,Xi'an University of Technology(Grant No.2018KFKT-1).
杂志排行

International Soil and Water Conservation Research的其它文章
- GUIDE FOR AUTHORS
- A detailed reconstruction of changes in the factors and parameters of soil erosion over the past 250 years in the forest zone of European Russia(Moscow region)
- Changes in hydrologic components from a mid-sized plots induced by rill erosion due to cyanobacterization
- Organic manure input and straw cover improved the community structure of nitrogen cycle function microorganism driven by water erosion
- Soil properties characterization for land-use planning and soil management in watersheds under family farming
- Land surface roughness impacted by typical vegetation restoration projects on aeolian sandy lands in the Yarlung Zangbo River valley,southern Tibetan plateau