Spatial resolution and image processing for pinhole camera-based X-ray fluorescence imaging: a simulation study
2022-07-26ZeHeNingHuangPengWangZiHanChenBoPeng
Ze He· Ning Huang· Peng Wang· Zi-Han Chen· Bo Peng
Abstract Spatial resolution and image-processing methods for full-field X-ray fluorescence (FF-XRF) imaging using X-ray pinhole cameras were studied using Geant4 simulations with different geometries and algorithms for image reconstruction. The main objectives were: (1) calculating the quantum efficiency curves of specific cameras,(2)studying the relationships between the spatial resolution and the pinhole diameter, magnification, and camera binning value, and (3) comparing image-processing methods for pinhole camera systems. Several results were obtained using a point and plane source as the X-ray fluorescence emitter and an array of 100 × 100 silicon pixel detectors as the X-ray camera. The quantum efficiency of a back-illuminated deep depletion (BI-DD) structure was above 30%for the XRF energies in the 0.8–9 keV range, with the maximum of 93.7%at 4 keV.The best spatial resolution of the pinhole camera was 24.7 μm and 31.3 lp/mm when measured using the profile function of the point source,with the diameter of 20 μm, magnification of 3.16, and camera bin of 1. A blind deconvolution algorithm with Gaussian filtering performed better than the Wiener filter and Richardson iterative methods on FF-XRF images,with the signal-to-noise ratio of 7.81 dB and improved signalto-noise ratio of 7.24 dB at the diameter of 120 μm,magnification of 1.0, and camera bin of 1.
Keywords Full-field X-ray fluorescence(FF-XRF)·X-ray pinhole camera · Spatial resolution · Image processing
1 Introduction
Full-field XRF imaging (FF-XRF) is a commonly used technique for large-area elemental analysis,and is typically implemented using energy- and position-sensitive cameras combined with a pinhole mask. The method found applications in the fields of cultural heritage and archeology.After passing through an optical device such as a pinhole[1], a multihole collimator [2], or a code aperture [3], the X-ray fluorescence photons released isotropically from the sample of interest are captured by a position-sensitive detector. A pinhole camera is advantageous owing to its simple structure and low cost. In addition, several camera types, such as charge-coupled device (CCD) [4], pnCCD[5], scientific complementary metal-oxide semiconductor(sCMOS)[6],and Timepix[7],can be used as energy-and position-sensitive cameras for direct detection of X-rays,allowing two-dimensional (2D) elemental mapping of irradiated samples. Back-illuminated (BI) CCD cameras,compared with sCMOS and Timepix, have a better energy resolution of 133 eV at 5.9 keV and a superior spatial resolution of 30 μm [8].
Although multihole collimators and code-aperture optics improve photon collection efficiency and reduce data acquisition time in imaging,a perfectly narrow pinhole can provide ideal spatial resolution and a wide field of view[9].Moreover, a pinhole camera can perform microscopic elemental mapping owing to its capacity to modify magnification. Several studies have shown that pinholes are effective and rapid for analyzing elemental distributions in the samples of pigments, agates, crystals, metals, and fish teeth [4–10, 12].
Recently, experiments and Monte Carlo simulation methods have been used for studying the characteristics of pinhole camera-based imaging. For example, a camera with a combined collimating lens (CCL) for FF-XRF imaging experiments was considered, focusing on the camera parameters, magnification, exposure time, and binning model,and elemental distribution images for metal foils and mineral pigments were obtained using this method [11]. The material, thickness, and aperture of the pinhole mask for X-ray backscattering security imaging were optimized in simulations, for obtaining adequate image properties [9]. Experiments and simulations have been performed to investigate the angle-dependent sensitivity (ADS) of thick pinhole devices, suggesting that the ADS is affected by the pinhole diameter and thickness in the field of internal confinement fusion (ICF) [13]. Furthermore,the pinhole camera parameters such as diameter,magnification, and binning (the method of pixel combination) are critical for XRF imaging, but have not been examined comprehensively. In addition, different imagereconstruction algorithms have been studied for gamma imaging with large and thick pinholes, with the Richardson–Lucy deconvolution method yielding clear restored images [14]. A deep learning neural network, a novel approach to image processing, has been applied to codemask imaging for FF-XRF. The simulated images were presented to the U-Net network; however, the image quality was slightly worse than that obtained using the classic iterative image-reconstruction algorithm [15].Therefore, effective image-processing methods are required for improving the images’ quality.
Even accounting for previous FF-XRF studies, there have not been many studies on the X-ray pinhole camerabased spatial resolution and image-processing methods.This study aims to explore the relationship between the spatial resolution and pinhole camera parameters for FFXRF imaging, and to establish a reliable imaging-processing approach for enhancing the quality of acquired images.
In this study, the Geant4 Monte Carlo simulation code was utilized for investigating these issues in the context of FF-XRF imaging using X-ray pinhole cameras. The obtained results are likely to be helpful for analyzing largearea samples in future studies.
2 Methods and materials
2.1 The imaging system with an X-ray pinhole camera
A camera and pinhole mask constituted the FF-XRF imaging system (Fig. 1). A disk with three different apertures along the center axis was used for simulating the pinhole mask. The central aperture was a straight cylindrical hole, whereas the other two were conical truncated holes at both ends.This pinhole design was inspired by the thick pinholes that have been used for neutron/gamma imaging [14], as explained in our previous work [16]. The pinhole structure should be designed for preventing 3–20 keV X-rays from penetrating the pinhole mask and for ensuring good spatial resolution.Therefore,the pinhole mask should be composed of a high atomic number material,such as lead or tungsten,owing to their large mass attenuation coefficient and relatively weak fluorescence.For example, for a 20 keV X-ray, a tungsten shield thickness of 100 μm can decrease the number of photons by a factor of 10–5. The collimation effect of the pinhole diminishes when the pinhole mask length is reduced [9].The pinhole mask is mounted between the X-ray source and the camera, and theoretically, only the pixels located on the line between the source object and the aperture can receive X-ray photons; when fluorescence X-rays are involved, this called FF-XRF imaging. However, the imaging system’s parameters(such as the pinhole aperture,magnification, and camera binning) importantly affect its spatial resolution. Therefore, these factors in various configurations should be examined for characterizing the imaging system’s performance.

Fig. 1 Schematic of the pinhole camera-based imaging system. The inner and outer diameters of the straight-hole part are r1 and R with thickness h2, the inner and outer diameters of the conical-hole parts are r2 and R with thickness h1 and h3.Typically,the values of h1,h2,and h3 are the same
The X-ray cameras are widely used in X-ray astronomy and particle physics because they can record both the energy and position information of incident photons. The camera is a semiconductor-based detector with many threedimensional (3D) potential wells that can trap the charge carriers induced by X-rays. It also consists of an electrode layer, an oxide layer, a depletion layer, and a substrate layer. The quantum efficiency of such cameras should cover the characteristic X-ray energy range of most elements.
The response of an optical system to a point object is described by its point spread function (PSF), which refers to the 2D distribution function of the image of a point source.Because point sources with different positions may have specific PSFs, X-ray pinhole cameras are spacevariant systems, and images obtained using the following equation:

where r1is the inner diameter of the straight cylinder hole,P is the lateral size of the detector pixel, and M is the pinhole-mask magnification. Theoretically, the image resolution can be improved by decreasing the diameter and increasing the value of M.
The optical transfer function (OTF) is obtained by taking the Fourier transform of the PSF,while the modulation transfer function (MTF) is the normalization of the OTF modulo [18], and can be obtained using the following equation:

where PSF(x, y)is the 2D PSF, MTF(u, v)is the 2D MTF,(x, y) and (u, v) are the 2D coordinates in the spatial and frequency domains, respectively, and M and N are the horizontal and vertical pixel numbers of the camera,respectively. The MTF is a function of spatial frequency,which is expressed as the modulation degree (contrast) at varying spatial frequencies. It provides information on the system’s ability to transfer the spatial frequency content from the object to the image plane.In general,MTF at 50%refers to the frequency at which the magnitude of the MTF curve drops to 50% of its peak value, and is defined as follows:

2.2 Modeling the X-ray pinhole camera using Geant4
The X-ray pinhole camera for FF-XRF imaging can be simplified as a camera chip [19] and a pinhole mask in a shield box positioned in front of the camera, as illustrated in Fig. 2. The system was implemented using the C + + code in Geant4 [20] (version 10.06.p03). The X-ray pinhole camera model was based on the experimental setup [8] (typical pinhole diameter, 75 μm; thickness, 125 μm). In this study, we used the same simulation structure with different pinhole camera settings. It consisted of the following components:
- A tungsten mask disc with the diameter of 12.5 mm(R) and thickness of 100 μm (h): a 20–200 μm (r1)diameter straight inner hole, thickness of 33.3 μm (h2),two 31–212 μm (r2) diameter conical outside holes,thickness of 33.3 μm (h1, h3) at both ends, and a 10° α angle.
-The sample was placed 100 mm away from the camera at magnifications of 0.79, 1.27, and 3.16.
-A 0.3 μm thick gate electrode and a 0.835 μm thick oxide layer (the dead layer), a 40 μm thick depletion layer, and a 500 μm thick bulk silicon comprised the camera structure.
-A 100×100 array of pixel cameras,each with the lateral dimensions of 13×13 μm2,and binning values of 1(full bin), 2, 4, 8, and 16.
2.3 X-ray source emitter
The characteristic lines of the sample excited by the primary X-ray beam are emitted at a solid angle of 4π steradians in the FF-XRF imaging studies. Owing to the long sample-pinhole distance and small aperture, the solid angle of detection determined by them is small, which could have made Geant4 simulation inefficient and timeconsuming if all 4π solid angles were to be sampled. To improve the simulation efficiency, a small X-ray emission angle-sampling method was employed. Photon emission was restricted to a 2°cone angle in the forward direction,to match the sensor area of the camera. Hence, the range of the polar angle θ was 0–1°while the range of the azimuthal angle φ was 0–360° in spherical coordinates. In imageprocessing,the source emitter was defined as either a point source or a plane source, such as a bold letter shape, to reveal the spatial resolution [14]. In the present study, an 8.047 keV X-ray source(i.e.,Cu Kα X-ray)was used.The physics list G4EmPenelopePhysics was used to simulateX-ray imaging, which is reliable for low-energy physical processes.

Fig. 2 Pinhole camera 3D model in Geant4 (left). Right:the front view and the detail view
2.4 Image-reconstruction method
When photons are scattered by a pinhole, a nonlinear reduction in the image brightness from the axis toward the periphery occurs; this is the vignetting effect, which directly affects the image’s quality.For correcting FF-XRF images, Paweł introduced a mathematical model of the pinhole camera vignetting effect [21]. Photon scattering in the pinhole mask and electron diffusion in the camera also cause blurring.
Wiener proposed a linear filtering method for image restoration in 1942[22].In this approach,the truth and the error values produced by the system are modeled as a random process, and then an optimal solution is estimated by searching the minimizes the mean square error between the desired and estimated images.In the frequency domain,this becomes
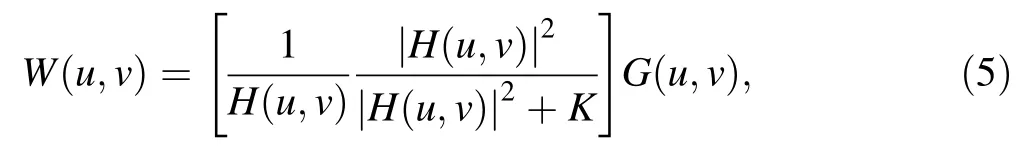
where W(u, v) is the final reconstructed image, H(u, v) is the degradation function of the pinhole camera (i.e., the PSF) in the frequency domain, G(u, v) is the degraded image in the frequency domain,and K is the inverse of the image’s signal to noise ratio (SNR).
The pinhole camera is the degenerate imaging system,and if the source is much larger than the aperture, the acquired image is inverted. The Richardson iterative method [23] is a classical nonlinear image reconstruction method based on the Bayesian theory, which is very adequate for pinhole camera-based image processing. The mathematical model underlying the method is

where h(x, y; m, n) and h(p, q; m, n) refer to the pinhole camera’s space shift degradation function. Taking advantage of the aperture symmetry,the PSFs of a point source at different positions can be deduced from the simulated PSF on the axis, where g(m, n) is the degraded image, and rk+1(x, y) is the final reconstructed image (which is initialized to 1).
Deconvolution is a mathematical term that describes the inverse of the convolution process,and its goal is to reduce the image’s blur effect. For image restoration, this method uses a calculated PSF based on the classical model or a PSF measured using the same instrument. The PSF correction limits the accuracy of the reconstructed image.However,if the PSF is unknown, blind deconvolution can be used for estimating the PSF by gathering information from the image itself [24], given by
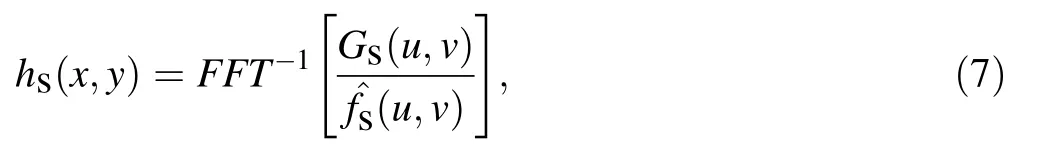
where Gs(u, v) is the degraded sub-image with a strong signal area in the frequency domain, ^fs(u,v) is the processed sub-image with deblurring, FFT-1is the inverse Fourier transform,hs(x,y)is the PSF of the sub-image that can be used to construct h(x, y). Matlab software has a built-in blind deconvolution function deconvblind,which is based on the Richardson–Lucy algorithm and has been used for restoring astronomy images suffering from the Poisson noise; thus, this blind deconvolution method has been widely used in image processing [25].
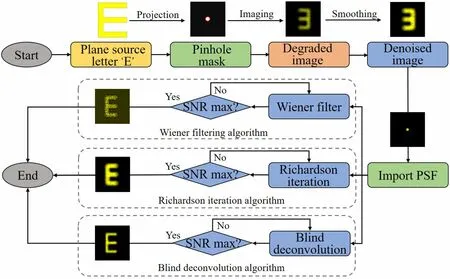
Fig. 3 Flowchart of the image-processing pipeline using the Wiener filter, Richardson iterative, and blind deconvolution methods
The flowchart of image processing is shown in Fig. 3,on an example image. The original image of letter E is degraded into a blurred image after projection through a pinhole mask. At the end of the smoothing denoising process, reconstructed images are obtained using the following three algorithms: the Wiener filter, the Richardson iterative, and the blind deconvolution method; the calculation terminate when maximal SNR values are obtained.To evaluate the image-processing quality, the SNR,improved SNR(ISNR),and root mean square error(RMSE)were used as performance metrics; these metrics were defined as follows:

In the above,f(x,y)is the true object image,g(x,y)is the degraded image, r(x, y) is the final reconstructed image,and M and N are the horizontal and vertical pixel numbers of the camera, respectively.
3 Results
3.1 Quantum efficiency
This section discusses the quantum efficiencies of different camera structures, including the front-illuminated(FI), BI, back-illuminated deep depletion (BI-DD), and beryllium window + BI-DD structures, for determining the X-ray camera responses to photons with energies in the preferred range (0.1–40 keV), involving the most elemental characteristic X-rays (K, L, or M lines). In general, the quantum efficiency of a detector is its ability to absorb photons, similar to the detection efficiency, for which the probability of detecting a photon of a particular energy is reported in percentage points.The measurement process of X-ray photons was simulated using the camera’s one-pixel structure as an independent detector. The camera’s detection efficiency with respect to different energies was determined using the Geant4 code. The camera’s quantum efficiency results are shown in Fig. 4.

Fig. 4 Quantum efficiencies of the camera structures. FI: 1.135 μm thick dead layer and 15 μm thick depletion layer,BI:0.835 μm thick oxide layer and 15 μm thick depletion layer, BI-DD: 1.135 μm thick dead layer and 40 μm thick depletion layer
The response of an X-ray camera to photons in different energy regions depends mainly on the structure of the camera and thickness of the depletion layer. For the FI camera structure,photons travel through the regions of the electrode structure and dead layer before entering the depletion zone. The maximal quantum efficiency of the FI camera was only 81.1% at 3 keV, because a few photons were absorbed in the electrode and dead layers.
For the BI camera structure,the electrode structure is at the bottom and leaves only a dead layer on the top. With the 1.135 μm thick dead layer and 15 μm thick silicon depletion layer, the BI camera exhibited a maximal quantum efficiency of 86.8%at 3 keV,an improvement of 5.7%relative to the FI camera.
The upper detection limit of photons increases as the thickness of the depletion layer increases. For example, a camera with a deep depletion layer enables detecting highenergy X-rays. For the BI-DD camera, the quantum efficiency of the 40 μm thick silicon depletion layer was larger than 30%in the 0.8–9 keV range, and peaked at 93.7% for 4 keV. The quantum efficiency peaked when the X-ray absorption capability of the camera reached a maximum.While most high-energy photons penetrated the depletion layer, the quantum efficiency was near zero. The absorption coefficient of the material in the path of X-rays,including the depletion and dead layers, determined the quantum efficiency. The discontinuities or edges of the curves appeared in the FI,BI,and BI-DD curves,resulting from the intrinsic properties of the camera sensor, such as the absorption edges of the silicon K-edge at 1.8 keV and oxygen of the oxide layer K-edge at 0.543 keV.
A beryllium window installed in front of a sensor can block visible wavelengths and low-energy X-ray photons.On-site XRF imaging applications, where a vacuum analysis environment is unavailable, usually require a beryllium window to seal the camera sensor. Therefore,when a 25 μm thick beryllium window was placed in front of the sensor, the quantum efficiency decreased from 93.7% to 90.2% at 4 keV. When the thickness of the beryllium window was 200 μm, the camera quantum efficiency decreased significantly for energies in the 2–20 keV range,with only 74.4%at 5 keV.For a fluorescence X-ray spectrometer, selecting an appropriate beryllium window thickness is necessary for increasing the camera’s quantum efficiency. However, the thickness of the beryllium window is inversely associated with the camera’s sensor area because it is difficult for a thin beryllium window to withstand the massive pressure required to seal a large-area sensor.
In summary, a BI-DD camera can be directly used in a vacuum chamber as an X-ray camera, with a maximal quantum efficiency of 93.7% at 4 keV for FF-XRF imaging. At the same time, a BI-DD camera with a beryllium window is advantageous for atmospheric measurement conditions, and it has a quantum efficiency above 20% for energies in the 3–10 keV range, coupled with a 200 μm thick beryllium window,with a maximal value of 74.4%at 5 keV.Therefore,the BI-DD camera was more suitable for measuring characteristic X-rays than the other considered devices. The camera structure of the beryllium window + BI-DD was thus used in the following simulations.
3.2 Spatial resolution
3.2.1 PSF
In general,the spatial resolution of an imaging system is measured using a resolving power test card with parallel lines at different intervals. However, for simplicity, the point source method was adopted for quantifying the spatial resolution of the X-ray pinhole camera in this study.Three key factors affect spatial resolution: 1) the pinhole diameter, 2) magnification, and 3) binning. Owing to their convenience of use and low cost, numerical simulation methods are often used to search for the best spatial resolution, across a range of pinhole aperture sizes (r2), magnifications,and binning values.In this work,a point source with mono-energy X-rays was used in Geant4 simulations,and the energy deposition in the camera was recorded as a map with position and energy information.

Fig. 5 PSFs for different pinhole diameters. (a) 3D PSF. (b) PSFs for the pinhole diameters of 20, 80, 120, and 200 μm
The image simulated by a point source was converted into the PSF results, as shown in Fig. 5(a), offering a 3D figure of the 2D PSF that is symmetrical and concentrated in the central area. A one-dimensional (1D) PSF can be obtained by taking any axis from the center of symmetry,as shown in Fig. 5(b). The PSF profiles for differentaperture pinholes were compared, and the widths of the PSF profiles were extended by increasing the aperture size.Larger apertures allow more X-ray photons.The narrowest PSF, that is, the one corresponding to the best spatial resolution, was obtained for the FWHM of 32 μm aaperture the diameter of 20 μm, while the worst one was obtained for the FWHM of 397 μm at the diameter of 200 μm. For the aperture diameter of 20 μm,the FWHM value was only two times larger than the pixel size. The PSF curves remained constant as the aperture decreased and the best spatial resolution was approximately 32 μm.
Magnification, in addition to the pinhole diameter, is known to affect the spatial resolution of X-ray pinhole cameras. Macro- and micro-scale FF-XRF imaging can be achieved using different magnifications [26], but there are differences in terms of the spatial resolution. The magnification of the pinhole camera was set to 0.79, 1.27, and 3.16, corresponding to the ratio between the pinhole-camera and pinhole-source distances. The FWHM values for the PSF results,for different combinations of magnification and aperture diameter,are shown in Fig. 6(a).The FWHM gradually increased with increasing aperture diameter,corresponding to the expansion of the PSF curve. The FWHM reached 453.9 μm for the aperture diameter of 200 μm and magnification of 0.79, corresponding to the worst spatial resolution among the three different magnifications. The image details were magnified when the magnification was above 1, and the spatial resolution peaked at 24.7 μm for the aperture diameter of 20 μm.For a narrow diameter, the FWHM difference between the three magnification curves was minimal.This was because the change in the image was not visible for a small aperture when it was enlarged or shrunken.
X-ray cameras provide users with a variety of functions for image processing, the common among which is binning.Binning amounts to combining the neighboring pixels of a pixel into a single pixel; for example, a 100 × 100 pixel region(bin = 1)of a camera can be binned down to a 50 × 50 region (bin = 2) in steps of 2. The advantage of binning is a faster readout speed, while its disadvantage is that the spatial resolution decreases as the pixel size increases. The FWHM of the PSFs for different binning scenarios was calculated at the magnification of 1, to evaluate the difference in the spatial resolution, including bin = 1 (13 μm), bin = 2 (26 μm), bin = 4 (52 μm),bin = 8 (104 μm), and bin = 16 (208 μm) cases. Figure 6(b) shows the FWHM results for the five binning scenarios. For the aperture diameters of 20, 80, and 120 μm, the FWHM values gradually increase from 35.4 μm to 241.5 μm and the spatial resolution becomes poor.The central pixel is excessively bright,the images are zoomed out to the same point-source figure, and the FWHM values are close for bin = 8 and bin = 16 cases,amounting to 207.7 and 415.2 μm, respectively. The change in the FWHM values with increasing binning for the aperture diameter of 200 μm; however, is not obvious with the mean value of 403.3 μm, because the larger binning values(larger pixel sizes) reduced the spread of the PSF and obtained the same point-source images. Owing to the loss of image-related information caused by the accumulation of pixels,the FWHM values tend to be consistent for larger binning values.Therefore,multiple combinations of diameter and binning can be used for different imaging systems with different spatial resolution demands. In addition, efforts should be made to avoid increasing the binning parameter beyond 8, because in that case the FWHM decreases below 207.7 μm.

Fig. 6 FWHM for PSFs and the spatial resolution of theoretical calculations. (a) FWHM vs. diameter. (b) FWHM vs. binning. (c) Spatial resolution ΔD vs. diameter. (d) Spatial resolution ΔD vs. binning
The spatial resolutions calculated using Eq. 2 are presented in Fig. 6(c) and (d). Figure 6(c) shows the ideal spatial resolution ΔD, for various diameters and magnifications, for bin = 1.The simulation and theoretical calculation results,in contrast to those in Fig. 6(a),indicate highly consistent spatial resolution. The best theoretically computed spatial resolution is approximately 26.7 μm,obtained for the magnification of 3.16 and diameter of 20 μm.In the theoretical calculations,the same function as binning was achieved by setting the size of the pixel, and ΔD for the different binning scenarios was computed using Eq. 2, as shown in Fig. 6(d) for the magnification of 1.00.Different results are shown for diameters in the 20–120 μm range and binning parameter in the 4–16 range, compared with those in Fig. 6(b). The theoretically calculated PSF has the PSF spreading phenomenon, by default; therefore,there is always a deviation in the spatial resolution values,regardless of the pinhole diameter. Nevertheless, in the actual binning calculation, the PSF spreading vanishes owing to the pixel accumulation effect. Hence, the spatial resolution calculation results for these two methods differ for high values of the binning parameter, and the spatial resolution ΔD has a larger gap than the FWHMs of the PSF method for bin = 16.As a result,the theoretical estimation of the spatial resolution needs to be further improved to approximate the actual simulation, and other spatial resolution characteristics, such as the MTF, should be compared.
In conclusion, although the spatial resolution can be theoretically improved using a smaller aperture, larger magnification, and lower binning value, an acceptable spatial resolution can be achieved at a large pinhole diameter when using high magnification. In addition,binning should be applied suitably for large apertures,to reduce the readout time without sacrificing too much of the spatial resolution.
3.2.2 MTF
One of the essential metrics for characterizing the performance of an imaging system is the MTF. It provides information on an imaging system’s capability to transfer the image detail from the imaged object to the image. The PSF and slanted edge technique are two common MTF measurement methods. The PSF of the X-ray pinhole camera was discussed in Sect. 3.2.1. Therefore, based on the exploration of the spatial resolution with the PSF in the space domain,the spatial resolution based on the MTF will be investigated in the frequency domain using various pinhole camera parameters.
The MTFs for different pinhole diameters are shown in Fig. 7, for three different magnifications. From Fig. 7(a)–(c), the bandwidth of the MTF increases as the magnification increases, and the spatial resolution improves. The value of the MTF in the high-frequency band for the diameter of 20 μm is much higher than for the other three cases, capturing explicit image details. As the magnification increases from 0.79 to 3.16,the image size of the point source steadily increases, and the image details become clear. In addition, the spatial resolution improves as the high-frequency band count increases.However,the PSF no longer follows a standard Gaussian curve with a large aperture; thus, the spreading increases gradually, causing fluctuations toward the tail of the MTF curve after the Fourier transform.
Similarly, the MTFs for the three distinct binning scenarios were compared,with various-size pinhole diameters.The spread of the MTF decreases from Fig. 7(d)–(f)as the binning value increases to 4, and the limit of the highfrequency signal gradually decreases. The high-frequency count of the MTF is the highest for the diameter of 20 μm for the bin = 1 and bin = 2 scenarios, and it decreases as the aperture increases. The MTFs are difficult to distinguish for bin = 4, because the PSF images tend to be the same. Therefore, increasing the binning value reduces the spatial resolution and image quality, and it is essential to further discuss the spatial resolution with an explicit indicator.
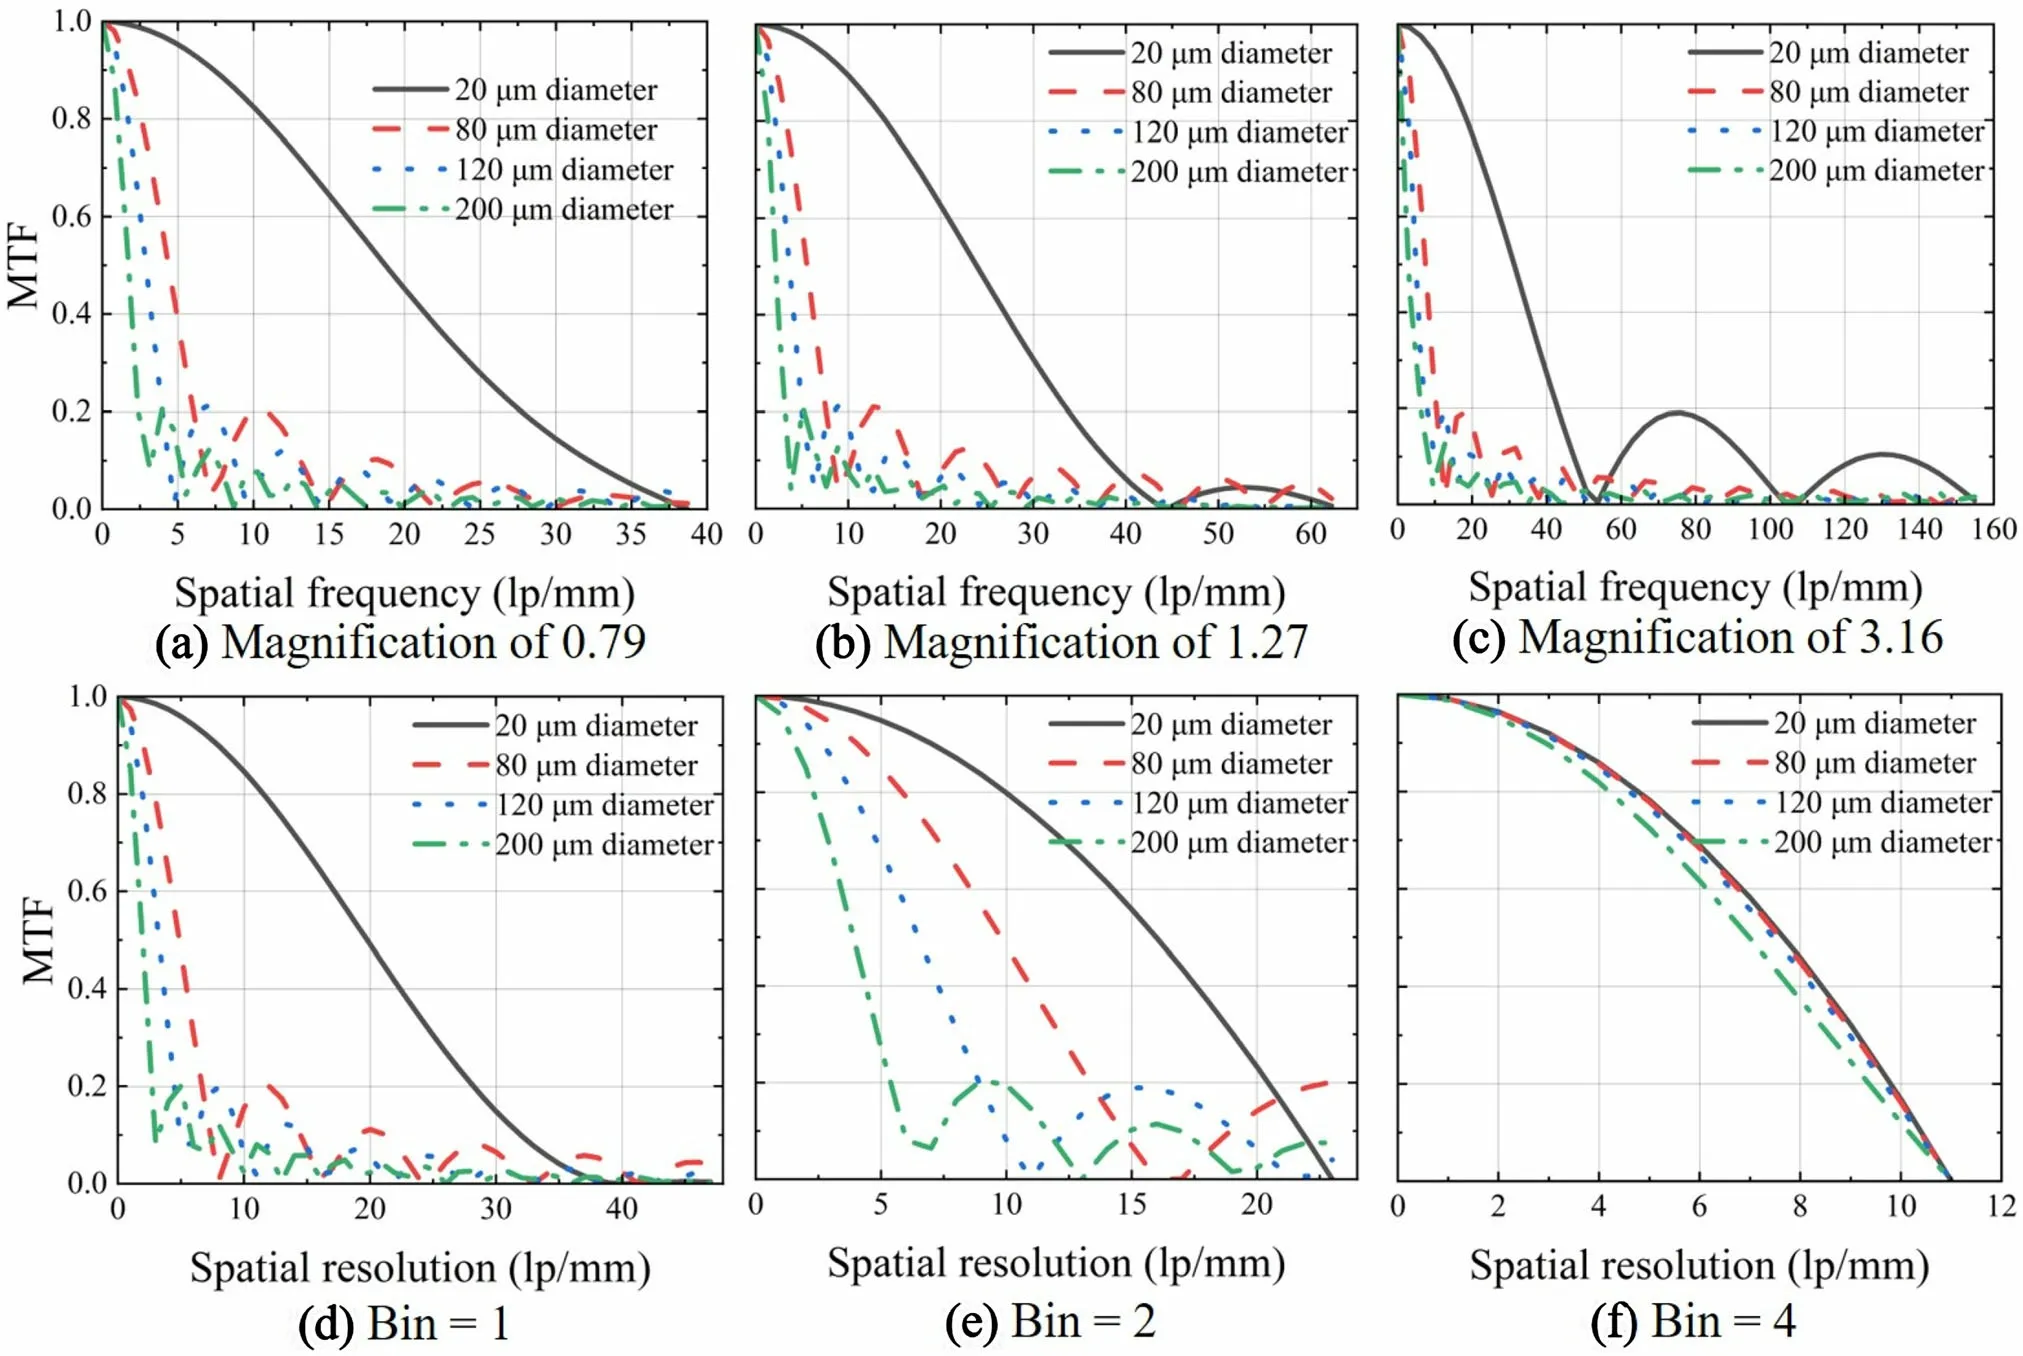
Fig.7 MTFs for the magnification levels of 0.79(a),1.27(b),and 3.16(c),and for the binning levels of 1(d),2(e),and 4(f),for the pinhole diameters of 20, 80, 120, and 200 μm

Fig.8 MTF50 of the MTFs.(a)MTF50 vs.diameter,for the magnification levels of 0.79,1.27,and 3.16.(b)MTF50 vs.binning,for the pinhole diameters of 20, 80, 120, and 200 μm
MTF50 refers to the frequency response bandwidth in which the MTF value is equal to a half of its highest value;thus, the spatial frequency of different pinhole parameters is calculated by interpolating the MTF (Fig. 8). The MTF50 decreases to 0.3 lp/mm for the diameter of 200 μm at the magnification of 0.79, as shown in Fig. 8(a), indicating the lowest spatial resolution. The greater the magnification, the higher the MTF50 value. The maximal MTF50 value is 31.3 lp/mm, for the magnification of 3.16 and diameter of 20 μm. In contrast to the FWHM in Fig. 6(a), the variance of MTF50 caused by the magnification is noticeable when the pinhole diameter is smaller,owing to its excellent capacity to transmit image details at small apertures.
Meanwhile, the MTF50 values for the different camera binning scenarios were obtained(Fig. 8b),and decreased to the minimum of 1.3 lp/mm for bin = 16. The increased binning hid the image’s details for the aperture diameter of 20 μm,resulting in a sharp drop in MTF50 and poor spatial resolution. The MTF50 curves for diameters in the 80–200 μm range started to rise for bin = 2, and tended to remain the same until bin = 4. Because large binning values indicate large pixel sizes, fewer pixels in the pointsource image, and PSF focused on the center pixels, the spatial resolution was slightly improved. The PSF image for diameters in the 20–200 μm range makes it difficult to properly distinguish when the binning value increases to 16, and the MTF50 decreases to 1.3 lp/mm. Overall, this results can be utilized for maximizing the spatial resolution using different pinhole diameters and binning values, with similar function as the FWHM in the spatial resolution, as shown in Fig. 6(b).
Although the FWHM and MTF50 metrics represent spatial resolutions differently,there are certain similarities.The FWHM and MTF50 simulation results were considered in the same rectangular coordinate system for fitting;the fit results are shown in Fig. 9. Furthermore, the reciprocal of lp/mm can be interpreted as the width of each pair of lines, that is, the closest distance that still allows to distinguish two sources, which is the same as the representation of spatial resolution in the spatial domain. As a result, the FWHM and MTF50 metrics can be used interchangeably without the need for complicated calculations.The precondition is that the other parameters of the X-ray pinhole camera should remain the same.
In conclusion, with respect to the spatial resolution, the MTF50 metric of the MTF is similar to the FWHM metric of the PSF. The only difference is that the difference between the MTF50 values at small apertures, caused by different magnifications, is distinguishable. The FWHM and MTF50 metric values obtained in simulations should be used as a reference for selecting the size of the aperture and magnification in the pinhole mask design.For FF-XRF imaging using an X-ray pinhole camera, the spatial resolution peaks at a large magnification and a small binning value. For specific applications, these pinhole parameters must be comprehensively considered. For example, to improve the readout speed, the optimized scheme for the requirements of the detail of a source is the magnification of 3.16 and diameter of 20 μm, with the binning value not exceeding 4.When large fields of view are required, small magnifications and large diameters should be used,e.g.,the magnification of 0.79 and diameter of 200 μm.
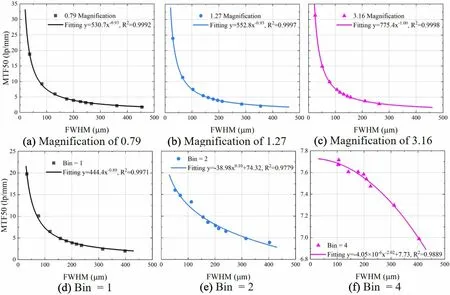
Fig.9 Fit results of MTF50 vs.FWHM,for the magnification levels of 0.79(a),1.27(b),and 3.16(c),and for the binning levels of 1(d),2(e),and 4 (f)
3.3 Image processing
3.3.1 Diameters
The projection image in the FF-XRF imaging using the X-ray pinhole camera deteriorated because the system is degenerate, and image processing is the inverse of degradation. The recovered images were obtained using three image-reconstruction algorithms, and an overview of its principle is shown in Fig. 3. Here, we considered an E-shaped X-ray plane source, with the dimensions of 0.40 × 0.72 mm2. The X-ray pinhole camera featured a group of apertures of 80, 100, and 120 μm in a 0.1 mm thick mask,with the fixed magnification of 1.0 and binning value of 1. The PSFs on the axis and the source letter ‘E’were obtained using 8.047 keV Cu Kα X-ray fluorescence in simulations, as shown in Fig. 10. The PSF, as a degradation function of the imaging system, exhibits an increasing diffusing area from Fig. 10(b)–(d); thus, image blurring increases as the pinhole aperture increases. At the same time,the initial simulated images of the letter‘E’are shown in Fig. 11, and many discontinuous points in the letter‘E’can be noted.The image is sharper than the other images for the diameter of 80 μm,shown in Fig. 11(a),and the internal spacing of the letter ‘E’ is large. The SNR calculated from the original image indicated that the image with the diameter of 80 μm was better than the other images,with the SNR of 1.19 dB,as listed in Table 1.The SNR values were slightly decrease for these three images,with a poor spatial resolution for the image with the diameter of 120 μm. Undoubtedly, these images are reversed and require image processing to restore clear and correct images.

Fig.10 The source letter ‘E’and the PSF images.(a)The original letter ‘E’.The PSF images for the pinhole diameters of 80 μm(b),100 μm(c), and 120 (d)
The small-angle sampling method for the X-ray source emission was adopted in the simulations, and the incident X-rays were almost normal to the camera plane. Considering the simultaneous influence of photon scattering,electron diffusion, and system noise, the pixel-sharing range of energies in the camera did not exceed 3 × 3.Therefore, to improve the images’ SNR, the Gaussian filtering method with a window size of 3 × 3 was used.Then, on these three images, linear (i.e., the Wiener filter)and nonlinear(i.e.,the Richardson iteration)methods,both of which are classical image-reconstruction algorithms,were used. Blind deconvolution has also been used in this section, as a method of the simultaneous restoration of the PSF and image,compared with the above methods in terms of the performance of image processing. There were discontinuities and artifacts in the images reconstructed using the Wiener filter method, as shown in Fig. 11(d)–(f), and the artifacts gradually aggravated with increasing aperture size. As the aperture size increased, the reconstructed image became fuzzier, with the worst results obtained for the 120 μm aperture. However, the brightness of these three images obtained using the Richardson iterative method was relatively uniform,as shown in Fig. 11(g)–(i).The images were easily recognizable, with sharp edge contrast and smoothing without discontinuity points.However, the brightness uniformity of the images worsened with increasing aperture, owing to the worse spatial resolution. The images that were reconstructed using the blind deconvolution approach are shown in Fig. 11(j)–(l);they are characterized by sharpness and good edge contrast,with higher brightness uniformity than the other images for the aperture diameter of 120 μm. The SNR values for the Wiener filter method were smaller than for the Richardson iterative method, whereas the blind deconvolution method performed better than the Richardson iterative method, as shown in Table 1.The blind deconvolution method has the SNR of 7.81 dB and the ISNR value of 7.24 dB for the aperture diameter of 120 μm, and the least RMSE value of 32.76 for the aperture diameter of 80 μm.The ISNR values were smaller than the SNR values, because they involved degenerating images in the calculation process.In terms of the number of iterations,the SNR reached an optimal value after 6–9 iterations for the Richardson method, 6–14 iterations for the blind deconvolution method, while the Wiener filter method required only one iteration. Therefore, the reconstruction performance of the blind deconvolution method was better than those of the Wiener filter and Richardson iterative methods,with higher SNR values.
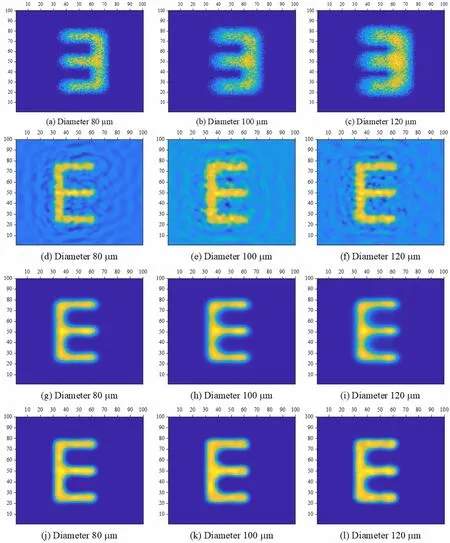
Fig. 11 Deteriorated and reconstructed images, for different pinhole diameters, where reconstructions were performed using different algorithms:(a)–(c)deteriorated images;(d)–(f):images reconstructed using the Wiener filtering method;(g)–(i):images reconstructed using the Richardson iterative algorithm;(j)–(l):images reconstructed using the blind deconvolution method

Table 1 SNR, ISNR, and RMSE values of reconstructed images, for the pinhole diameters of 80, 100, and 120 μm
The X-ray pinhole camera was used under various XRF imaging conditions with adjusted magnification and binning values. These parameters directly affect the spatial resolution of the imaging system, deteriorating the image quality. Therefore, X-ray pinhole camera imaging for different magnification and binning scenarios was simulated,for evaluating the impact of these parameters on the resultant image quality. In these simulations, the pinhole diameter was 80 μm and the values of the other parameters remained the same.
3.3.2 Magnification
For the magnification settings of 0.79 and 1.27 at bin = 1, the deteriorated and processed images obtained using the blind deconvolution algorithm with Gaussian filtering are shown in Fig. 12.The same discontinuity spots are observed in Fig. 12(a) and (b). The image size is smaller for the magnification of 0.79 than for the magnification of 1.27. The processed images are uniformly bright, with clear outlines as shown in Fig. 12(c) and (d).The indicators of the image-processing performance are presented in Table 2. For the magnification of 0.79, the highest SNR was 7.32 dB, reached after 10 iterations. For the magnification of 1.27, the highest SNR was 5.97 dB,reached after one iteration. The calculated RMSE for the image with the larger magnification was higher than that for the image with the smaller magnification(48.88 for the magnification of 1.27,26.17 for the magnification of 0.79),because the image details were magnified by the pinhole,and owing to the increased contrast region of the image.
3.3.3 Binning
The deteriorated image that was reconstructed using the blind deconvolution algorithm is presented in Fig. 13, for the magnification of 1 and binning levels of 2 or 4. The letter ‘E’ is brighter for bin = 2 than in Fig. 11(a), but the discontinuity at the edge of the image is more aggravated in Fig. 13(b) than (a). Only blind deconvolution was used for image processing, as shown in Fig. 13(c) and (d),because the Gaussian filtering produces discontinuities on images under a small number of pixels. The reconstructed image that included less covered area had a good contrast at bin = 2 after 6 iterations, with the SNR of 6.07 dB, the ISNR of 5.13 dB, and the RMSE of 41.72, as shown in Table 2. However, image pixels were over-accumulated,resulting in a poor spatial resolution for bin = 4, with the SNR of 4.50 dB, the ISNR of 4.53 dB, and the RMSE of 52.97.
3.3.4 Energy
The image quality also depends on the camera quantum efficiency because the camera can be differentially sensitive to X-ray energies, resulting in image-quality differences. Four X-ray energies, 5, 10, 15, and 20 keV, were used for estimating the performance of the image-processing methods; these studies were performed for the pinhole diameter of 80 μm,magnification of 1,and binning of 1. The final simulated and restored images (after blind deconvolution with Gaussian filtering) are shown in Fig. 14. The images are uniformly bright, with clear outlines for 5 and 10 keV, but as image discontinuities increase for 15 and 20 keV,the image quality deteriorates.The performance of the image-processing method is illustrated in Table 3.For the energy of 5 keV,the SNR and the ISNR of the reconstructed image were 7.91 dB and 6.74 dB,respectively,with the minimal RMSE of 31.48.As the energy increased to 20 keV (beyond the optimal quantum efficiency energy range, which is 3–10 keV for the BI-DD + Beryllium window), image restoration worsened, with the SNR of 5.91, ISNR of 5.15, and RMSE of 39.62 dB. Thus, it is recommended to use energies for which the camera quantum efficiency is high, to obtain high-quality degraded and restored images.
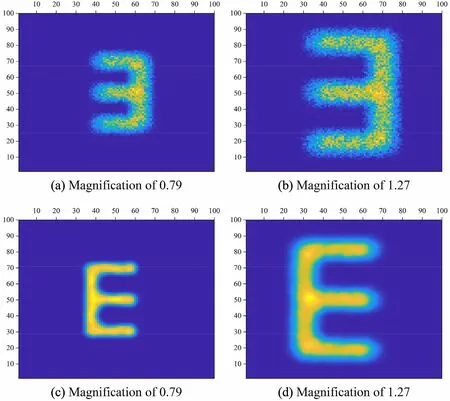
Fig.12 Deteriorated images,at the magnification levels of 0.79(a)and 1.27(b),and reconstructed images for the magnification levels of 0.79(c) and 1.27 (d)
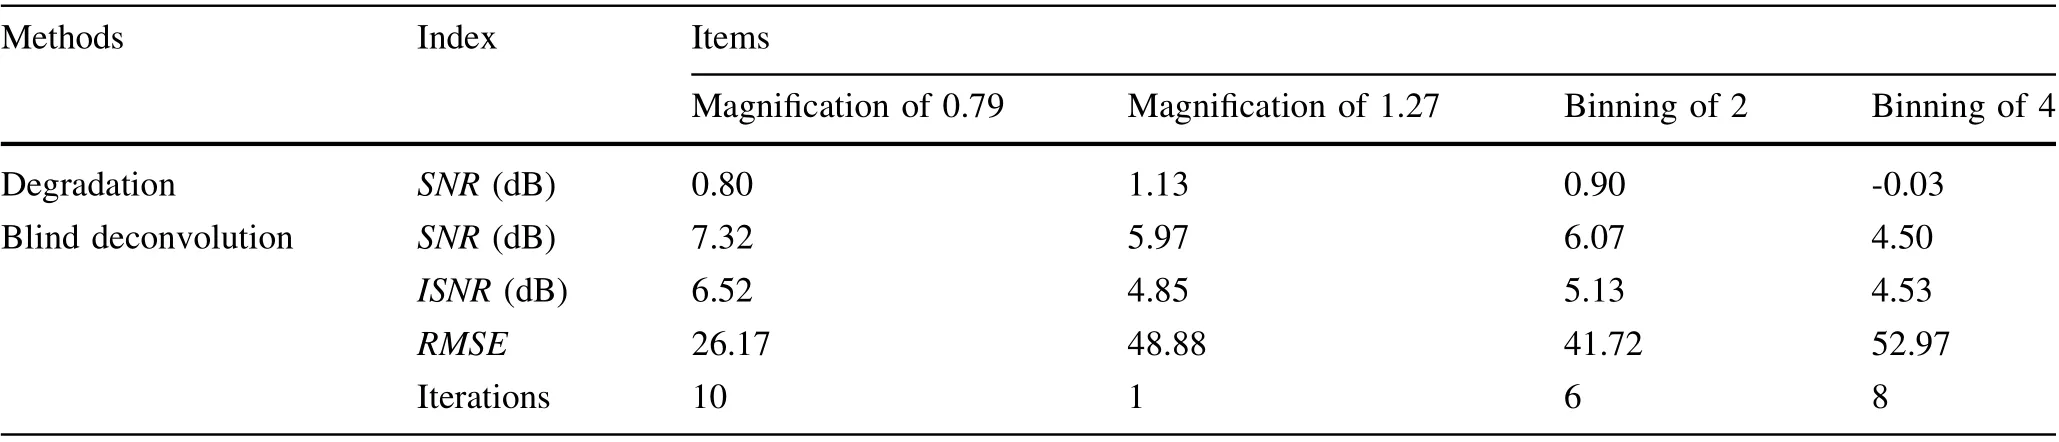
Table 2 SNR, ISNR, and RMSE values of reconstructed images, for the magnification levels of 0.79 and 1.27, and for the binning levels of 2 and 4

Fig. 13 Deteriorated images at the binning levels of 2 (a) and 4 (b), and reconstructed images for the binning levels of 2 (c) and 4 (d)
In general, the blind deconvolution algorithm with Gaussian filtering performed better on image processing than the Wiener filter and Richardson iterative methods,implying that the blind deconvolution method is more suitable for pinhole camera-based imaging systems. The influence of magnification on the image quality was weaker than that of the binning level, and X-ray photons with energies in the 5–10 keV range had a good image SNR.Thus, it is essential to use smaller binning and appropriate X-ray energies, for improving the reconstructed images’quality. In other words, the processing method was preliminarily verified, and can be used in real FF-XRF imaging studies.
4 Conclusion
The main contributions of this work are as follows: (1)the quantum efficiency of a specific camera structure for directly detecting X-rays was calculated, (2) the relationship between the spatial resolution and the parameters of the X-ray pinhole camera was studied, and (3) an imageprocessing method was described and preliminarily validated.
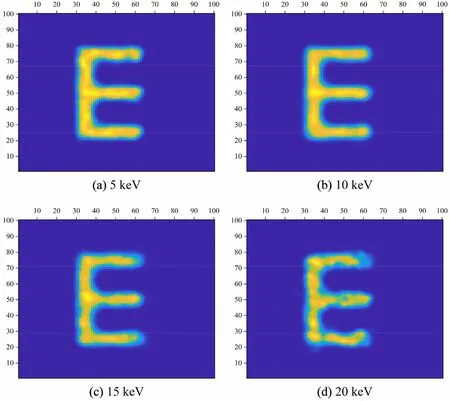
Fig. 14 Reconstructed images, for energies of 5 keV (a), 10 keV (b), 15 keV (c), and 20 keV (d)
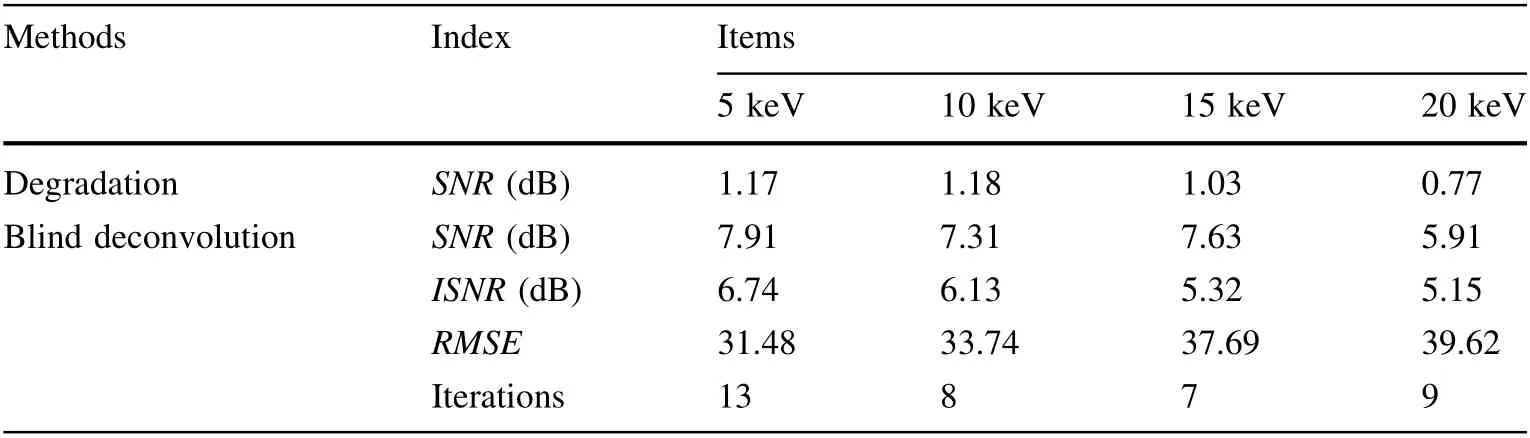
Table 3 SNR, ISNR, and RMSE values of reconstructed images, for the energies of 5,10, 15, and 20 keV
The camera structure of BI-DD, with the 40 μm thick depletion layer, which is the ideal FF-XRF camera structure, in general featured a quantum efficiency higher than that of other structures,which above 30%for energies in the 0.8–9 keV range, with the maximum of 93.7% at 4 keV. The tungsten disk pinhole mask consisted of a straight cylindrical hole in the middle and two conical holes at both ends. Under the simulation conditions of Cu-Kα 8.047 keV X-rays, the PSF performed well, with the diameter of 20 μm,magnification of 3.16,and bin = 1.The highest spatial resolution was 24.7 μm in the space domain and 31.3 lp/mm in the frequency domain.The FWHM and MTF50 were interchangeable for the same parameters condition.For narrow pinhole apertures,the binning should not be too high. With the SNR of 7.81 dB, the ISNR of 7.24 dB, and the RMSE of 34.84, the blind deconvolution algorithm performed better than the Wiener filter and Richardson iterative algorithms for FF-XRF image processing, for the diameter of 120 μm, magnification of 1.0,and camera bin = 1. The image quality and reconstruction performance for small magnification, small binning, and incident photon energies in the 5–10 keV range were improved.
In conclusion, the combination of Monte Carlo simulations and image processing is appropriate for studying FFXRF, as it enables quickly and efficiently obtaining valuable parameters. Future work will focus on the imaging properties of other optical instruments for FF-XRF as well as high-performance image-processing algorithms. This work also provides spatial resolution data support for our recent research on large-area sample analyses.
AcknowledgementsWe would also like to acknowledge Prof. Zhu An for his valuable suggestions on this paper.
Author contributionsAll authors contributed to the study conception and design. Material preparation, data collection, and analysis were performed by Ze He,Ning Huang,Peng Wang,Zihan Chen,and Bo Peng. The first draft of the manuscript was written by Ze He,and all authors commented on previous versions of the manuscript. All authors read and approved the final manuscript.
杂志排行

Nuclear Science and Techniques的其它文章
- Picosecond time-resolved X-ray ferromagnetic resonance measurements at Shanghai synchrotron radiation facility
- Nonrecursive residual Monte Carlo method for SN transport discretization error estimation
- Density fluctuations in intermediate-energy heavy-ion collisions
- Isospin effects on intermediate mass fragments at intermediate energy-heavy ion collisions
- Identification of anomalous fast bulk events in a p-type pointcontact germanium detector
- Free-radical evolution and decay in cross-linked polytetrafluoroethylene irradiated by gamma-rays