Identification of anomalous fast bulk events in a p-type pointcontact germanium detector
2022-07-26RenMingJieLiShuKuiLiuShinTedLinLiTaoYangQianYueChangHaoFangHaiTaoJiaXiJiangQianYunLiYuLiuYuLuYanKangKangZhaoLeiZhangChangJianTangHaoYangXingJingJunZhu
Ren-Ming-Jie Li · Shu-Kui Liu· Shin-Ted Lin · Li-Tao Yang ·Qian Yue · Chang-Hao Fang · Hai-Tao Jia · Xi Jiang · Qian-Yun Li ·Yu Liu · Yu-Lu Yan · Kang-Kang Zhao · Lei Zhang · Chang-Jian Tang ·Hao-Yang Xing· Jing-Jun Zhu
Abstract The ultralow detection threshold, ultralow intrinsic background, and excellent energy resolution of ptype point-contact germanium detectors are important for rare-event searches,in particular for the detection of direct dark matter interactions, coherent elastic neutrino-nucleus scattering,and neutrinoless double beta decay. Anomalous bulk events with an extremely fast rise time are observed in the CDEX-1B detector. We report a method of extracting fast bulk events from bulk events using a pulse shape simulation and reconstructed source experiment signature.Calibration data and the distribution of X-rays generated by intrinsic radioactivity verified that the fast bulk experienced a single hit near the passivation layer. The performance of this germanium detector indicates that it is capable of single-hit bulk spatial resolution and thus provides a background removal technique.
Keywords p-type point-contact germanium detector ·Dark matter · Pulse shape analysis · Anomalous fast bulk events This work was supported by the National Key Research and Development Program of China (No. 2017YFA0402203), the National Natural Science Foundation of China (No. 11975162), and the SPARK project of the research and innovation program of Sichuan University (No. 2018SCUH0051).
1 Introduction
Compelling evidence from astrophysical and cosmological observations suggests that ~26.8% of the energy density of the universe consists of dark matter [1–3]. Its nature and properties remain unknown. The p-type pointcontact germanium (pPCGe) detector exhibits the characteristics of ultralow noise, low energy thresholds, and excellent energy resolution [4–7]. These features uniquely support direct searches for dark matter in the form of weakly interacting massive particles (WIMPs) as well as rare-event experiments. These detectors have been used extensively in rare-event experiments, such as the search for dark matter and studies of neutrino physics[8–13].The China Dark Matter Experiment(CDEX)purses the study of light WIMPs and related dark matter models [14, 15] as well as neutrinoless double beta decay in76Ge, with the goal of establishing a ton-scale germanium detector array at the China Jinping Underground Laboratory [16–21].
Surface event (SE) performance of a pPCGe detector has been studied,where SEs are identified as events within the upper ~1 mm of the N+electrode[22].The signature,a slow rising pulse, is attributed to incomplete charge collection caused by the weak drift field and electron-hole recombination [23]. Detailed algorithms for differentiating surface and bulk events (BEs) are described in [24, 25].
An energy threshold of 160 eVee (electron equivalent energy), as determined by calibration with known cosmogenic X-ray peaks, was achieved using a kilogram-scale single-module pPCGe in the CDEX-1B experiment [26].The bulk distribution, however, has an abnormal structure,with an extremely fast rising pulse compared to BEs. In this work, we report an investigation of the characteristics of these anomalous fast bulk events (FBEs) and the separation of BEs from FBEs inside the CDEX-1B detector through pulse shape simulation. Removing FBEs is expected to significantly reduce the CDEX background and thus improve the sensitivity of dark matter searches.
2 Anomalous fast bulk events
Figure 1 displays a schematic diagram of a typical pPCGe detector. The pPCGe detector has a dead layer,which is a lithium-diffused N+layer of millimeter-scale thickness [27]. In addition, there is a passivation layer of sputtered silicon oxide at the surface of the P+point contact [28]. It is typically several hundred nanometers thick,and alpha or beta particles can easily penetrate it and deposit energy in the detector [29].
Figure 2a and b shows scatter plots of rise time (time interval between 5 and 95%of the pulse amplitude)versus energy in the low- and high-energy regions, from data obtained using the CDEX-1B detector. The three bands,from top to bottom, indicate SEs, BEs, and FBEs, and the typical pulses of these three types of events are shown in Fig. 3.
The origin of the FBEs is revealed by comparing the distribution of the photopeaks in Fig.2b with Fig.4a.Most of the events from all the peaks in the CDEX-1B experiment at energies of 70–95 keVee,which result from γ rays or X-rays from the progeny of238U and232Th [30], are FBEs. The CDEX-10 experiment also revealed the same behavior [31]. The alpha particles, beta particles, and lowenergy photons produced by nearby electronics and structural materials are more likely to enter the detector through the O(100 nm) thin passivation layer and contribute to the low-energy background. Because these events deposit energy close to the passivation layer, the hole carriers,which make the largest contribution to the signal, are collected rapidly by the P+electrode; thus, these events have a shorter rise time than BEs. This behavior is the reason FBEs are observed, which is proved by pulse simulations, as described in the next section.

Fig.1 (Color online)Schematic diagram of a typical pPCGe detector
The 8.98 keVee and 10.37 keVee KX peaks due to the internal cosmogenic isotopes65Zn and68Ge are presented in Fig. 4b. The ratios of FBEs to all bulk events are 19.4(52)%and 16.2(30)%,respectively.Because these two isotopes are uniformly distributed inside the crystal, these ratios indicate the volume ratio of the FBE region to the volume of the entire crystal.
Here we focus on differentiating BEs from FBEs at energies above 1.0 keVee,where SEs are well separated by the red line shown in Fig. 2a. Owing to the effects of electronic noise, BEs and FBEs can be roughly distinguished above 10 keVee and exhibit serious cross-contamination below 6 keVee.
3 Signal formation in pPCGe detector and pulse shape simulation
The interaction between an energetic charged particle and a germanium detector creates a crowd of charge carriers (electron-hole pairs), the number of which is proportional to the deposited energy of the particles in the detector.Then,under an electric field,these mobile charge carriers immediately drift toward their respective electrodes in opposite directions.The instantaneous charge and current they induce on the contacts can be described using the Shockley–Ramo theorem [32, 33]. For a cluster of charge q(q >0), the time-dependent induced charge Q(t)and the current I(t) are expressed as
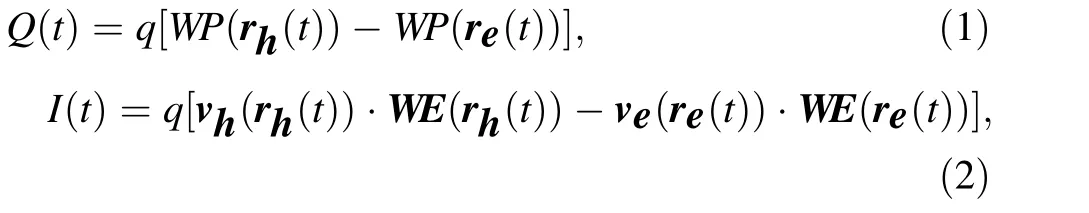
where WP(r(t)) and WE(r(t)) represent the weighting potential and weighting field, respectively, at the hole(electron) position rh(t) (re(t)). In addition, vh(rh(t))(ve(re(t)))represents the drift velocity of holes(electrons)at rh(t) (re(t)). Here, the weighting potential is calculated assuming unity voltage on the P+electrode and zero voltage on all other electrodes, without considering the space charge distribution [34]. Therefore, the distribution of WP(r(t)) depends only on the detector geometry and is independent of the bias voltages applied to the electrodes and the space charge distribution [35]. However, the time evolution of the drift velocity and positions of charge carriers are affected by the characteristics of the electric field inside the detector [36]. Moreover, the motion of charge carriers (the charge cloud) due to thermal diffusion and Coulomb self-repulsion affects the drift paths and thus the time development of the signal [37].
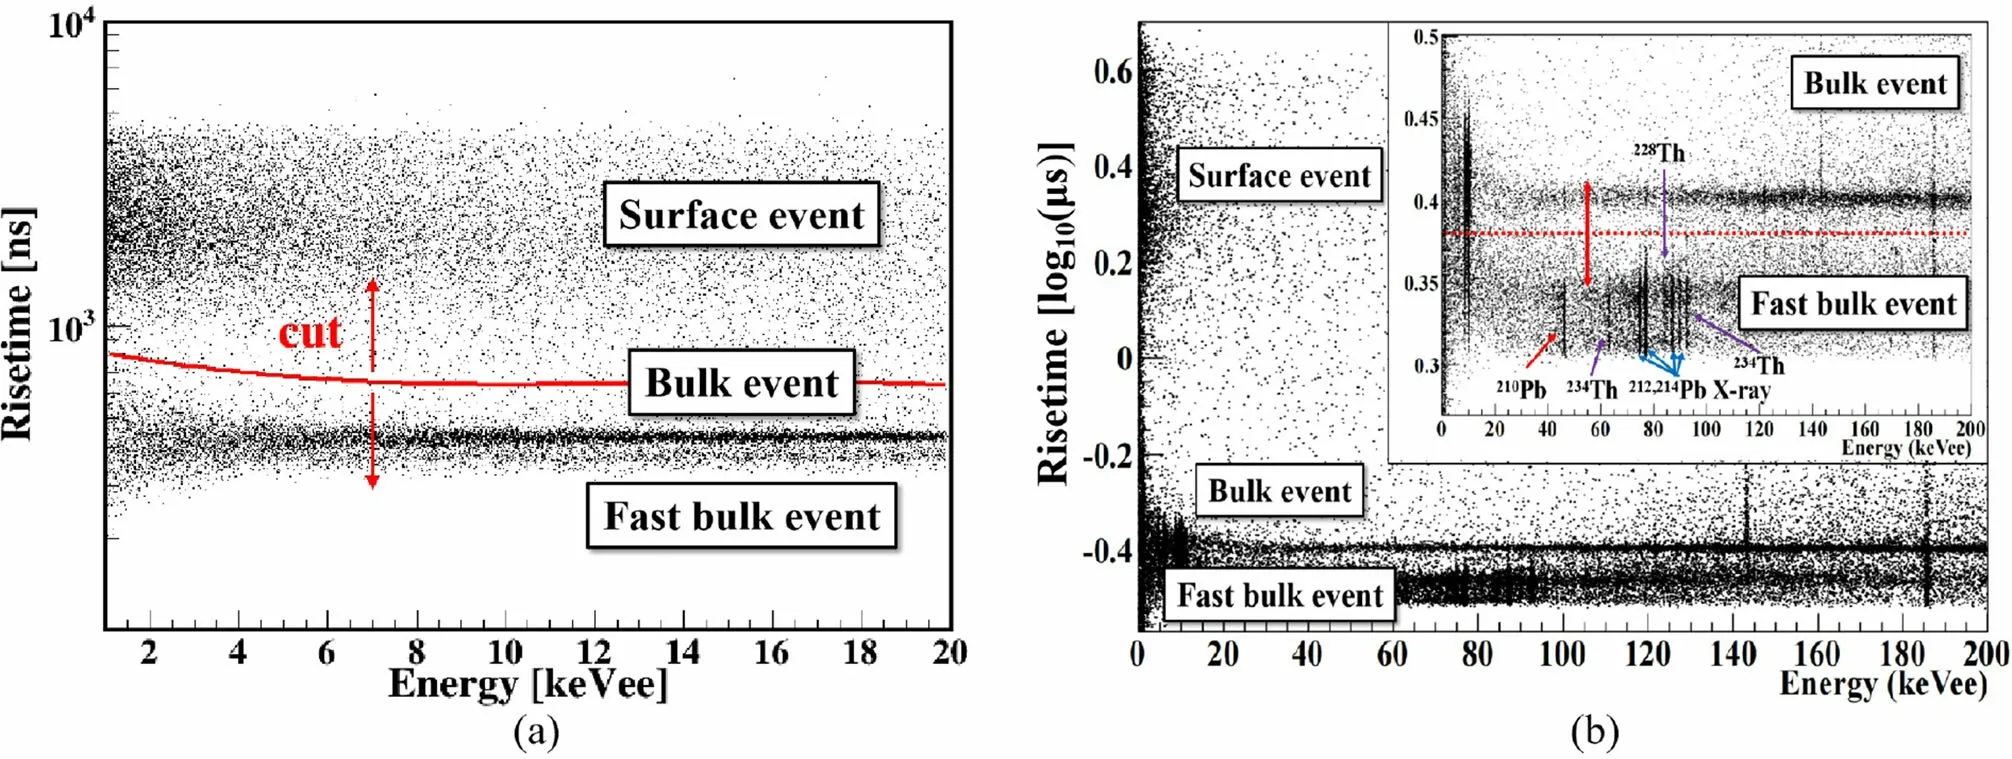
Fig. 2 (Color online) Scatter plots of rise time versus energy in a low- and b high-energy regions, from CDEX-1B detector data

Fig.3 (Color online)Typical pulses of a SE,b BE,and c FBE inside pPCGe detector,with best fit of the hyperbolic tangent function(red line)

Fig. 4 (Color online) Background energy spectrum including BEs and FBEs in a relatively high-energy (30–110 keVee) region and b lowenergy (4–15 keVee) region. FBEs are indicated by red dotted line in the inset of Fig. 2b
The package SAGE [38], which is a Geant4-based simulation framework for the CDEX with germanium detectors, was used for the pulse shape simulation. The calculated weighting potential and the actual electric field and potential distributions of the CDEX-1B detector are shown in Fig. 5, where the P+point contact is located at(r =0 mm,z =0 mm). The red and black trajectories in Fig. 5a and b represent the drift paths of holes and electrons, respectively, in response to a particle at r =10 mm,z =10 mm. According to Eq. (1), at time t =0, because the electrons and holes are at the same position and have the same weighting potential,Q(t =0)=0. Then, as holes drift toward the P+contact,WP(rh(t))increases,whereas electrons drift toward the N+electrode, and WP(re(t)) decreases. If the electrons reach the N+electrode first, WP(re(t))=0;then Q(t) is induced only by hole drift. When both electrons and holes are completely collected by the electrodes, WP(rh(t))=1,Q(t) reaches the maximum value, as shown in Fig. 6.
The components of the charge signal,that is,the change in charge, contributed by holes [Qh(t)] and electrons[Qe(t)] can be expressed as
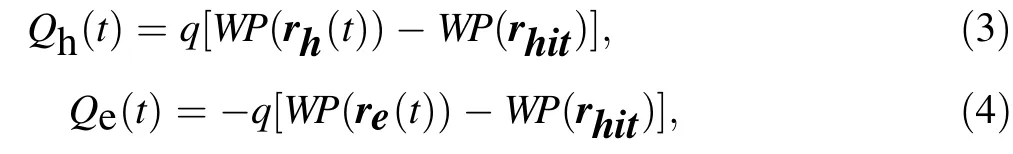
respectively, where WP(rhit) represents the position at which holes and electrons are generated. As shown in Fig. 6a, the absolute value of Qh(t)is usually much larger than that of Qe(t)because WP(rhit)is below 0.1 V in most areas of the detector, except near the P+point contact.Therefore, holes make the dominant contribution to the charge signal. According to Eq. (3), the time evolution of Qh(t) depends on the change in WP(rh(t)). As the holes drift to the P+point contact, the change in WP(rh(t)) is initially very small but becomes quite large. Thus, Qh(t)has a slow component followed by a fast component.

Fig.6 (Color online)Simulated pulse shape with electronic response at(r =10 mm,z =10 mm)in the CDEX-1B detector,where the red and blue lines represent the hole and electron components of the signal, respectively

Fig. 5 (Color online) a–c Weighting potential (WP), actual electric field, and potential of the CDEX-1B detector in the (r, z) plane calculated by SAGE, where the P+ point contact is at(r =0 mm,z =0 mm). The red and black trajectories in (a) and(b) represent the drift paths of holes and electrons, respectively,induced by a particle at (r =10 mm,z =10 mm)
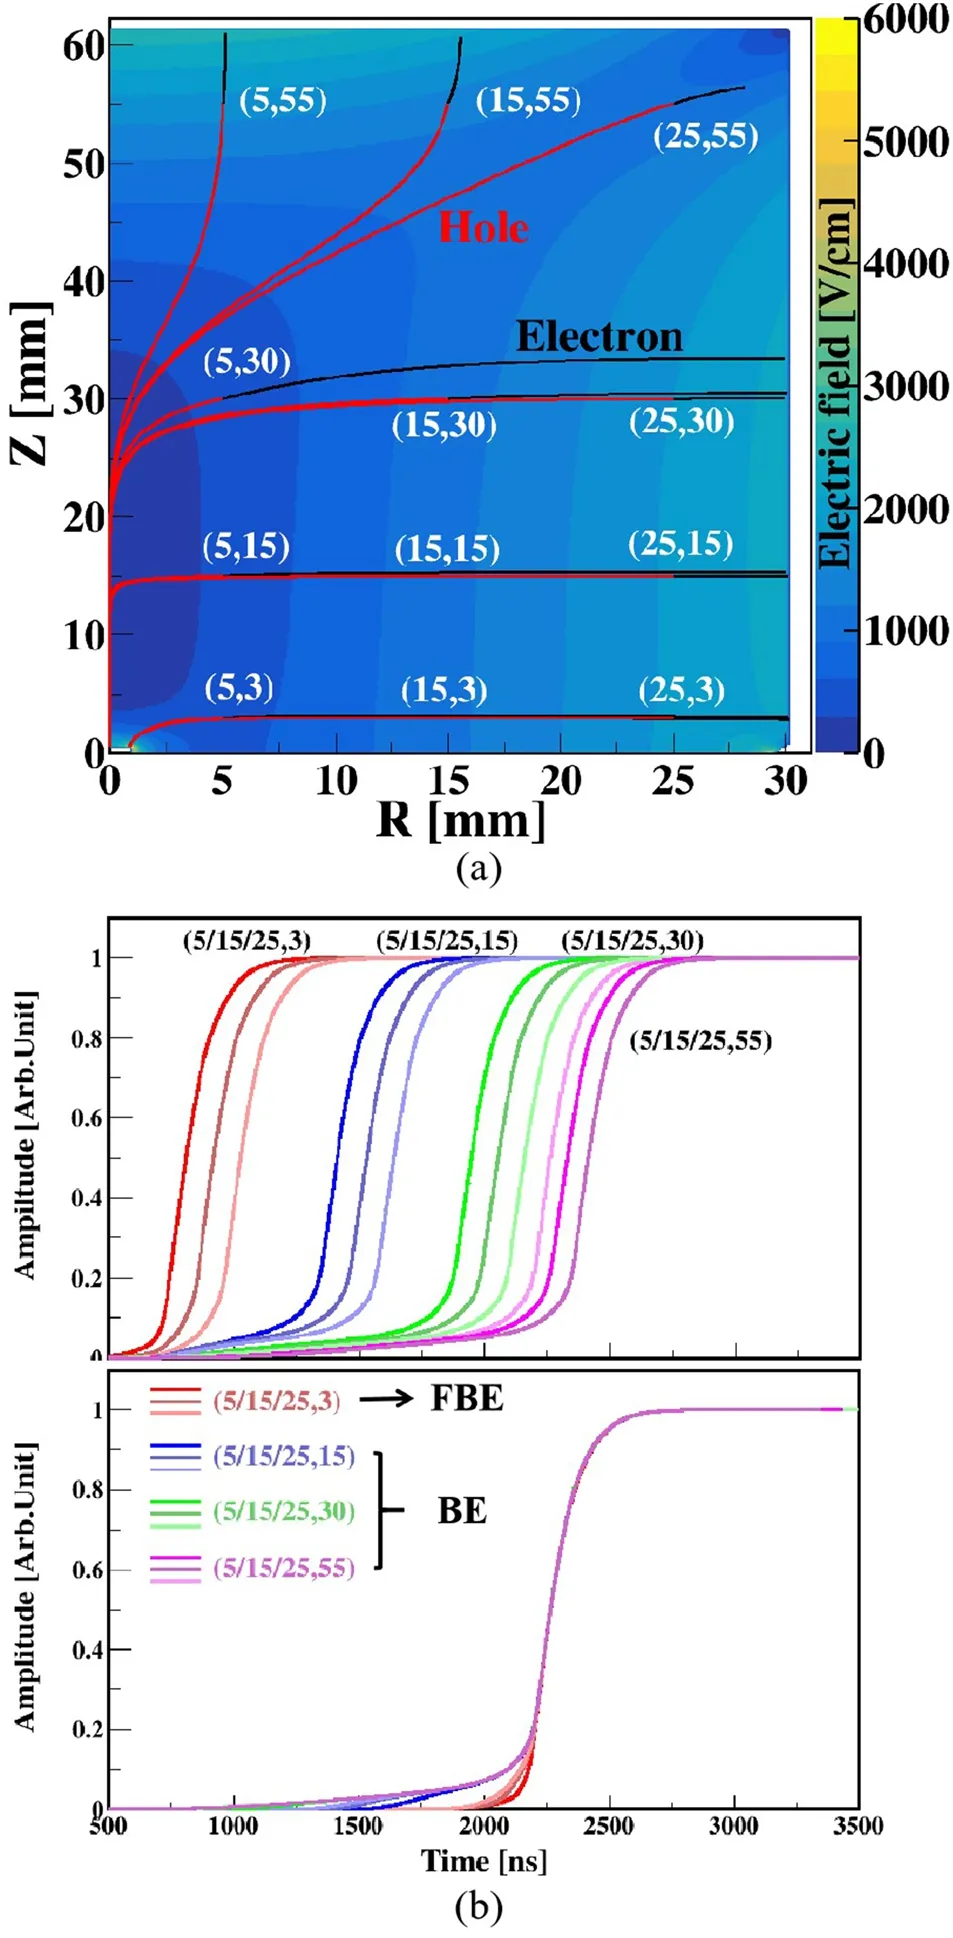
Fig. 7 (Color online) a Drift trajectories of electron-hole pair at different locations inside the detector and b corresponding signals with electronic response.In the bottom panel,points corresponding to half of the amplitude value of each signal are superposed
Figure 7 shows the drift trajectories of an electron-hole pair at different locations inside the detector and their signals. The difference between these signals generated at different locations depends on how long the hole or electron drifts before it is collected by the corresponding electrode. For instance,the hole carriers generated in most areas of the detector must pass through the weak field region in the middle of detector, which causes a long rise time initially. By contrast, the events occur near the passivation layer, and their hole carriers will be collected directly without passing through the weak field region;thus,the rise time is shorter.Therefore,the rising tendency of the waveform can indicate the approximate position of particle interaction. The simulation proves that FBEs originate near the passivation layer, which is consistent with the background spectrum reported above.
4 Comparison of simulation and experiment
The CDEX-1B detector was used to further investigate the characteristics of FBEs.A60Co source experiment was conducted, and the corresponding simulation was also performed using the Geant4 simulation toolkit[39,40]and SAGE package [38].
4.1 Overview of experiment
The CDEX-1B detector is a 939 g single-element pPCGe crystal cylinder with a dead layer of 0.88(12) mm[22].The crystal has a diameter of 62.1 mm and a height of 62.3 mm;it is held by a copper cup with a thickness of 2.0 and 1.0 mm on the lateral and top surfaces, respectively.Then the entire structure is mounted inside a copper vacuum cryostat with a thickness of 2.0 and 1.1 mm on the lateral and top surfaces, respectively. The copper bricks acting as shielding outside the detector are 20 cm thick at the sides, 25 cm thick at the bottom, and 5 cm thick at the top,as shown in Fig.8.The shielding has a collimating slit at the top along which γ rays can enter.
The P+point contact is at the bottom of the crystal and is connected to a brass pin to read out the signals [41].After a pulsed-reset feedback preamplifier, four identical energy-related outputs are generated. Two of them are distributed into two shaping amplifiers(SAs),and the other two are loaded to timing amplifiers (TAs) at different gains. The SAs, which have a high gain, cover the lowenergy region (0–12 keV) at 6 μs (SA6)and 12 μs (SA12),respectively. The outputs of the two TAs provide time information, including the high gain in the 0–20 keV region and the low gain in the 0–1.3 MeV region.The data acquisition system is triggered by the output of SA6or a random trigger generated by a precision pulser [42, 43].These signals from the amplifiers are recorded and digitized by a 14-bit 100 MHz flash analog-to-digital converter.The RMS of the pedestal is 31 eVee,whereas the full width at half-maximum of the test pulser is 80 eVee [26]. In the measurement, an uncollimated60Co source is mounted at the center of the top collimating slit. The average trigger rate is 36.3 Hz,and the run time is ~3 d.The operational voltage applied to the detector is +3750 V.
4.2 Simulation procedures
In the Geant4 simulation, the realistic positions and deposited energies of γ rays emitted by the60Co source in the detector were simulated in accordance with the shielding and structures of the CDEX-1B60Co experiment mentioned above.

Fig. 8 (Color online) Schematic diagram of CDEX-1B detector and shielding. Left and right panels are side and top views, respectively
Using the positions and energies generated by Geant4,an event-by-event pulse shape simulation was conducted using the geometry of the CDEX-1B detector. For each event, the signals corresponding to individual hits were simulated and then summed to obtain the waveform. The N+electrode of the detector was set to a realistic operating voltage of+3750 V.To obtain simulated pulses that are in agreement with the experimental pulses, the net impurity concentration was set to -1.28×1010cm-3at the P+point contact end and decreased linearly at a rate of-0.034×1010cm-3/cm. The pulse shape simulation also considered the nonuniformity of the radial net impurity concentration, as well as changes in charge cloud size due to diffusion and self-repulsion. However, these effects are negligible. For these configurations, the simulated depletion voltage is 3362 V, that is ~400 V below the real operating voltage, which is a reasonable result.
Finally, post-processing was performed. To simulate real pulses, the electronic response and electrical noise were considered. The electronic response was obtained by feeding the approximate δ impulse to the test input of the preamplifier. The waveforms of the electrical noise were sampled from random trigger events. The simulated raw pulses and post-processed pulses at two energies are displayed in Fig.9 with the real pulses.The simulated and real pulses are in good agreement. The charge collection process for the BE can be separated into slow and fast components.The slow component is determined mainly by the drift time during which the hole remains in the weak electric field. The fast component is determined by the strong field near the P+electrode, in which most events exhibit the same behavior. For the FBE, the time required for holes to pass through the weak electric field area is relatively short; consequently, its slow component is too small to be distinguished.
4.3 Measurement and simulation results
To accurately describe the TA waveform and reduce the noise effect, the pulse is fitted by different hyperbolic tangent functions at the front and back edges, because of the asymmetry of the pulse shape. The fitting results(Fig.10)indicate the fine description of the pulse.The rise time τ is parameterized by the time interval between 5 and 95% of the amplitude of the fitted function.
Figure 11a shows scatter plots of rise time versus energy for experimental and simulated events. At energies above 6 keVee, the BEs have a relatively long rise time(>550 ns), and the FBEs have a rise time of approximately 400 ns. Below 6 keVee, these two types of events are indistinguishable.Figure 11b and c shows the rise time distributions and rise time versus drift time scatter plots at energies above 15 keVee, respectively, where the drift time is parameterized by the time interval between 1 and 5% of the amplitude of the fitted function. All of these results show that the simulation results are in good agreement with calibration data.
As illustrated in Fig. 11b, the 525 ns cut is used to distinguish FBEs from BEs.The mean(μ)and width(σ)of the FBE and BE distributions at different energies are presented in Table 1. At relatively high energies, the μ values of both distributions do not change and are independent of energy. Because of interference caused by electrical noise at energies below 3 keVee, where σ is comparable to the band separation, serious cross-contamination occurs between BEs and FBEs, which causes the bands to merge. However, as shown in Fig. 12, the simulated relationship between the rise time and energy without electrical noise proves that the rise time is independent of the deposited energy;consequently,the FBE region is also independent of the deposited energy. Thus, the regions at which FBEs and BEs occur inside the detector can be identified from the simulation result at relatively high energies.
Figure 13 shows the simulated locations of these two types of events in the CDEX-1B detector according to the 525 ns cut above 15 keVee. FBEs (blue dots) are distributed near the passivation layer at the bottom of the detector.This result is consistent with the region predicted above. The volume ratio of the FBE region to the volume of the entire crystal is 18.8%,which is consistent with that derived from the68Ge peak 16.2(30)% and65Zn peak 19.4(52)%. Both isotopes are cosmogenic nuclides and are expected to be uniformly distributed in germanium crystals.
5 BE and FBE discrimination
5.1 Formulation
The goal of this analysis is to discriminate BEs from FBEs and extract their energy spectra in the60Co experiment. The reconstructed count rates CBE(E) and CFBE(E) are given by

Fig.9 (Color online)Raw pulses(blue line)and post-processing pulse(red line)with electronic response and electrical noise at a 18 keVee and b 1.1 keVee, with real pulses (black points), where left panel shows an FBE, and right panel shows a BE

Fig.10 (Color online)Pulse shape of a BE and b FBE,where two hyperbolic tangent functions are applied to fit the front and back edges of the waveform, respectively. The rise time τ is parameterized by the time interval between 5 and 95% of the amplitude of the fitted function

5.2 Fitting results
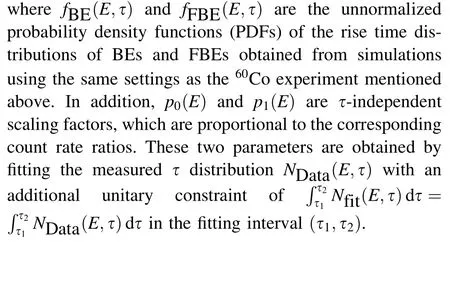
Figure 14 shows the best-fit result for the rise time distribution in the CDEX-1B60Co experiment at 15–16 keVee and the PDFs [fBE(E,τ), fFBE(E,τ)] obtained from the simulation.The fitted τ distribution Nfit(E,τ)is in good agreement with that of the calibration data, with a total χ2/nd of 29.8/24 (where nd represents the degrees of freedom).The results in Fig.15 show good agreement with the experiment, even in the low-energy region below 4 keVee.
The energy spectra of BEs and FBEs were reconstructed on the basis of these results, as shown in Fig. 16. The reconstructed and measured BE energy spectra show a consistent trend.In the low-energy region(<5 keVee),the FBE spectrum may exhibit a slight increase, which may result from SEs in the passivation layer. In addition, the reconstructed event count rate is slightly lower than the calibration data, because Compton events in which one hit occurs in the dead layer and the other in the bulk/fast bulk region are not counted.These events exhibit a normal drift time, like that of BEs/FBEs, and an extremely long rise time at the rear of the pulse, which results in a rise time τ that is typical of the region above 1000 ns.
Table 2 summarizes the statistical and systematic uncertainties of the FBE energy spectrum in the 1–2 keVee and 2–3 keVee energy bins. The total uncertainties of all energy bins in Fig. 16 are given by combining these uncertainties and applying error propagation.

Fig. 11 (Color online) Calibration data (left panels) and simulation results (right panels): a scatter plots of rise time versus energy. Two types of events are shown.One,the BE,has a relatively long rise time(>550 ns). The other is an FBE, with a rise time of approximately 400 ns. b Rise time distributions of events with energy above 15 keVee, where the cut at 525 ns is used to distinguish FBEs from BEs. The simulation results are in good agreement with calibration data. c Scatter plot of rise time versus drift time for events with energies above 15 keVee.The drift time is parameterized by the time interval between 1 and 5%of the amplitude of the fitted function.The FBEs, with typical 300–500 ns rise time and 50–200 ns drift time,have a faster rising pulse than BEs, which have a typical rise time of 600–800 ns and drift time of 500–800 ns

Table 1 Mean (μ) and width (σ) of FBE and BE distributions at different energies

Fig.12 Scatter plot of rise time versus energy in a simulation without electrical noise. The result proves that the deposited energy does not depend on the rise time,which depends on the location in the detector
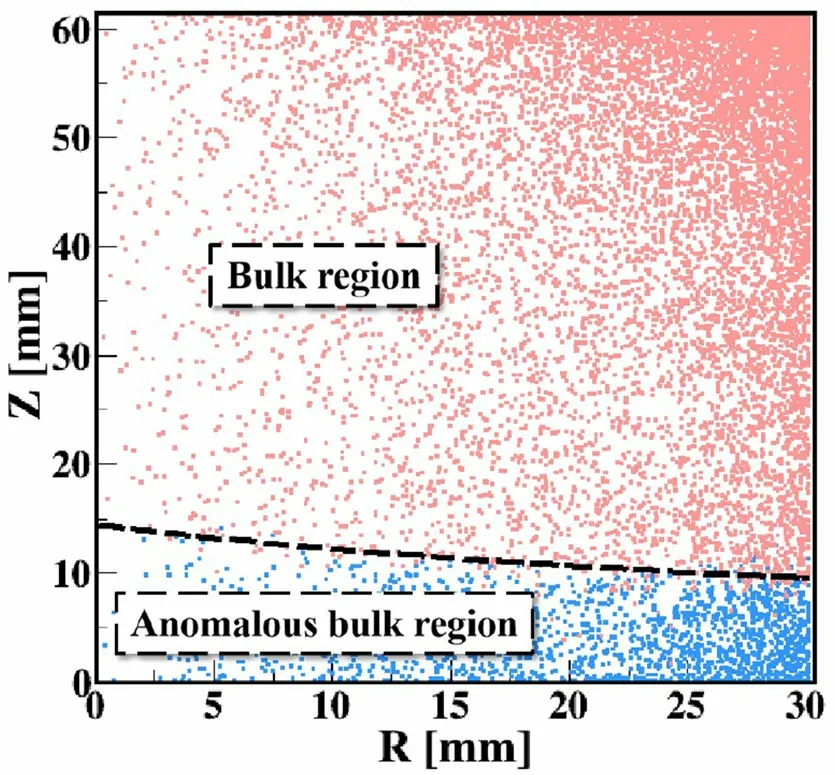
Fig.13 (Color online)Specific locations of FBEs and BEs in CDEX-1B detector obtained by simulations according to the 525 ns cut above 15 keVee, where the P+ point contact is at(r =0 mm,z =0 mm). FBEs (blue dots) are distributed near the passivation layer at the bottom of the detector,whereas BEs(red dots)are distributed in most areas of the detector

Fig. 14 (Color online) a BE (red dotted line) and FBE (blue dotted line)distributions obtained by simulations in the 15–16 keVee range,fBE(E,τ) and fFBE(E,τ), respectively. b Fitting result in the 1516keVee range obtained by fitting the measured τ distribution NData(E,τ) (data samples, black circles) with the assumed τ distribution function Nfit(E,τ)(magenta shading).The corresponding NBE(E,τ) (red dotted line) and NFBE(E,τ) (blue dotted line) are obtained
The fitting parameters p0(E)and p1(E)contribute to the statistical uncertainties, which are assigned according to the minimum χ2based on the fitting of the experiment and simulation.
The systematic uncertainties are derived as follows.
(1) Choice of fBE(E,τ) and fFBE(E,τ). Statistical fluctuations are present in the simulated PDFs,fBE(E,τ), and fFBE(E,τ). The systematic uncertainties are given by the deviations of multiple simulation results. They make the main contribution to the systematic uncertainties below 4 keVee,where the statistical fluctuations of PDFs significantly affect the fitting result because of severe merging of FBEs and BEs.

Fig. 15 (Color online) Fitting results in different energy ranges: a 1–2 keVee; b 2–3 keVee; c 3–4 keVee; d 4–5 keVee; e 5–6 keVee;f 6–7 keVee; g 10–11 keVee; h 12–13 keVee; i 18–19 keVee. All results are in good agreement with the experiment
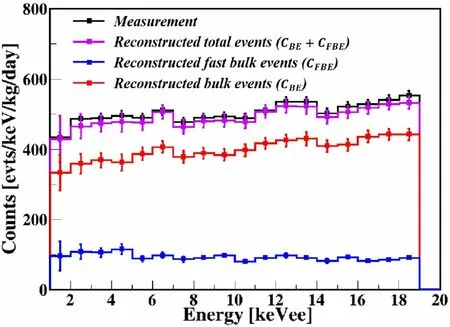
Fig. 16 (Color online) Reconstructed energy spectrum (magenta line),which contains spectral components of BEs(red line)and FBEs(blue line), compared with measured total energy spectrum (black line)
(2) Choice of fitting interval (τ1,τ2). The fitting interval is selected on the basis of sufficient statistics of the τ distributions in both the experiment and the simulation.The τ2values in Table 1 are from the BE distribution between (μ+σ) to (μ+4σ).
(3) Size of τ bin. The deviations of the results caused by the variation in the size of the τ bin are regarded as systematic uncertainties. The size of the τ bin ranges from half to twice the nominal size.
5.3 Discussion
We observe that the pPCGe is capable of a single-hit spatial resolution below 20 keVee and can roughly classify events as FBEs and BEs. However, as the energy decreases, the resolution is degraded by noise. Figure 17 shows the τ distributions at 2–3 keVee of the60Co source placed at the bottom of the crystal and the137Cs source located at the top of the collimating slit, which are compared with that in the60Co experiment mentioned in Sect. 4.3. Theresults demonstrate that because of poor spatial resolution,the τ distributions of both FBEs and BEs are almost independent of the source energy and location. Therefore,when FBEs and BEs below 5 keVee are distinguished, the choice of PDF[fBE and fFBE]is universal;that is,it is not necessary to specify the type and position of the source.This finding is helpful for identifying FBEs and BEs in background events in the low-energy region, which have various unknown and complex sources.
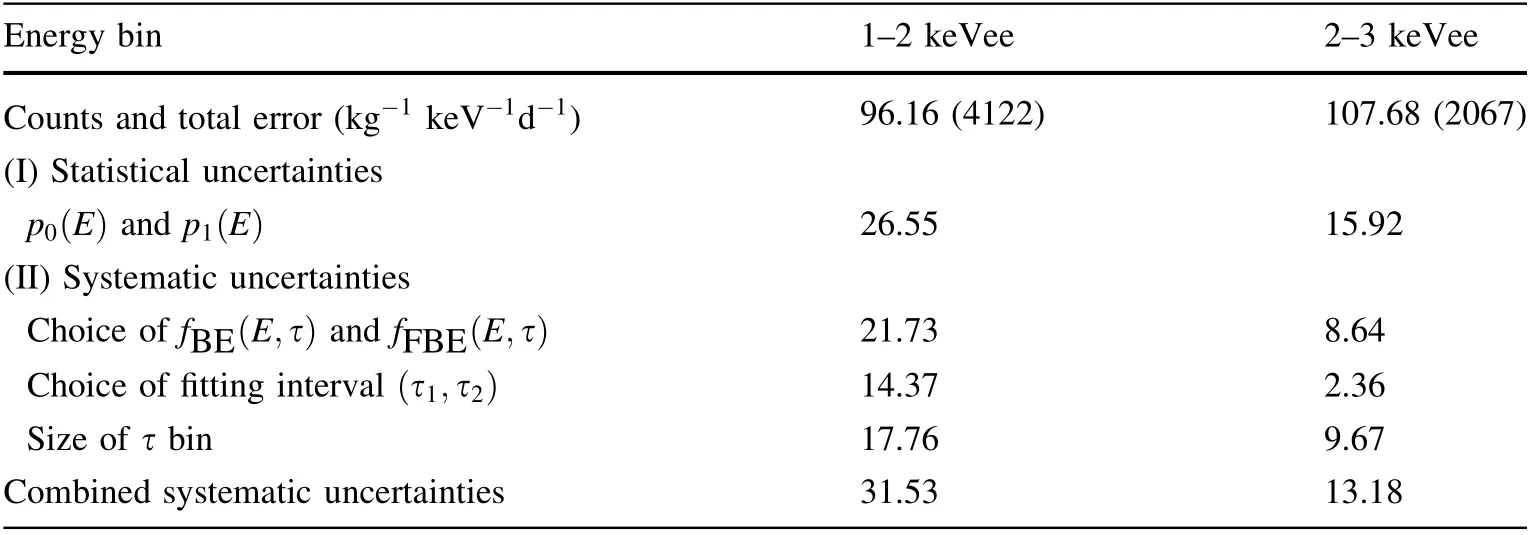
Table 2 Contributions of various sources to statistical and systematic uncertainties of FBE energy spectrum in 1–2 keVee and 2–3 keVee energy bins
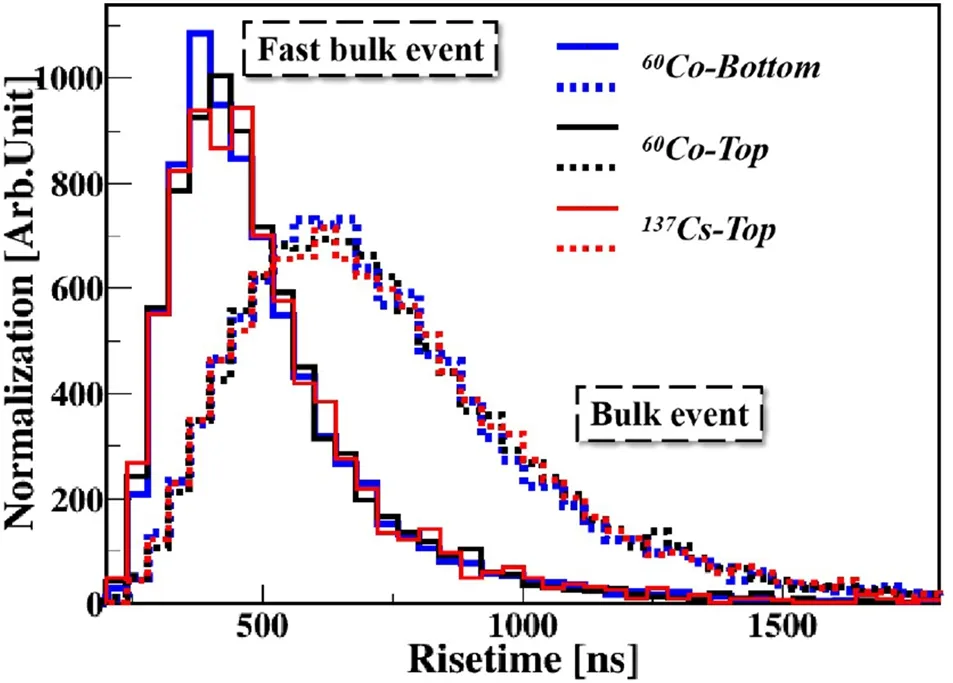
Fig.17 (Color online)Comparison of τ distributions at 2–3 keVee of 60Co source placed at the bottom of the crystal (blue), 137Cs source located at the top of the collimating slit (red), and 60Co experiment mentioned in Sect. 4.3 (black). Their FBE and BE distributions are normalized by the counts of FBEs and BEs, respectively, for a 60Co source placed at the bottom
To study the distinction between FBEs and BEs below 1 keVee, where the elimination of SEs is not involved in this work, we present the simulated expectations for their rise time distributions, as shown in Fig. 18. In addition,Table 3 also lists the mean (μ) and width (σ) of the FBE and BE distributions for the two energy regions. Both results show subtle and insignificant differences between them,especially below 0.6 keVee.These differences make it challenging to differentiate BEs from FBEs and SEs near the threshold or under conditions of SE penetration and low background statistics.
For comparison, a simulation assuming that the electronic noise is reduced by a factor of two proves that better discrimination can be achieved, as shown by the scatter plot above 0.2 keVee in Fig. 18c, where the scatter plot under the current electronic noise is also depicted. The μ and σ values of the corresponding rise time distributions at 0.2–1 keVee energy are presented in Table 3, and the rise time distributions below 1 keVee are shown in Fig.18b.In addition, the simulation shows that the current electronic responses of CDEX-1B and CDEX-10 are sufficiently rapid; thus, further response improvement will not significantly increase the ability to distinguish BEs and FBEs.Therefore, reducing the noise of the electronic system is expected to further improve the discrimination of FBEs and BEs at low energies.
6 Summary and prospects
FBEs with extremely short rise times were observed in several CDEX experiments. A thorough study was conducted to better understand the wave formation, characteristics, and location distribution of FBEs using a semiconductor electric field and pulse shape simulation.The simulation results were compared with those of a source calibration experiment. FBEs in the CDEX-1B detector occurred near the passivation layer in a region with a volume ratio of 18.8%,which is consistent with that derived from the68Ge peak 16.2(30)% and65Zn peak 19.4(52)%. Both of these isotopes are expected to be uniformly distributed in germanium crystals.
This study demonstrates an important property of pPCGe, namely, single-hit bulk spatial resolution. In the low-energy region, this resolution makes it possible to roughly discriminate FBEs and BEs, and we provide a method of eliminating FBEs from BEs.These events occur close to the materials around the P+electrode, which would be among the main background sources in dark matter experiments. Below 1 keVee, the extraction of FBEs is challenging under the conditions of SE penetration and low background statistics, and further research on preamplifier noise reduction, data analysis methods, and the optimization of the parameters for extracting FBEs is underway. In the high-energy region, better spatial resolution is expected because of the relatively small effect of electrical noise. Improved resolution is expected to be helpful for identifying the origins of the background and designing new detectors for deployment in CDEX-50dm.Therefore,research on the high-energy spatial resolution of single-hit source experiments and simulations is being pursued. A novel technique based on pulse shape comparison scanning (PSCS) [44] will provide a guide for defining the spatial resolution capability of a pPCGe detector by scanning the entire detector with a collimated137Cs gamma source. A feasibility analysis of the application of PSCS to the CDEX-1B detector has been conducted using simulations,and the relevant experiments are being prepared.
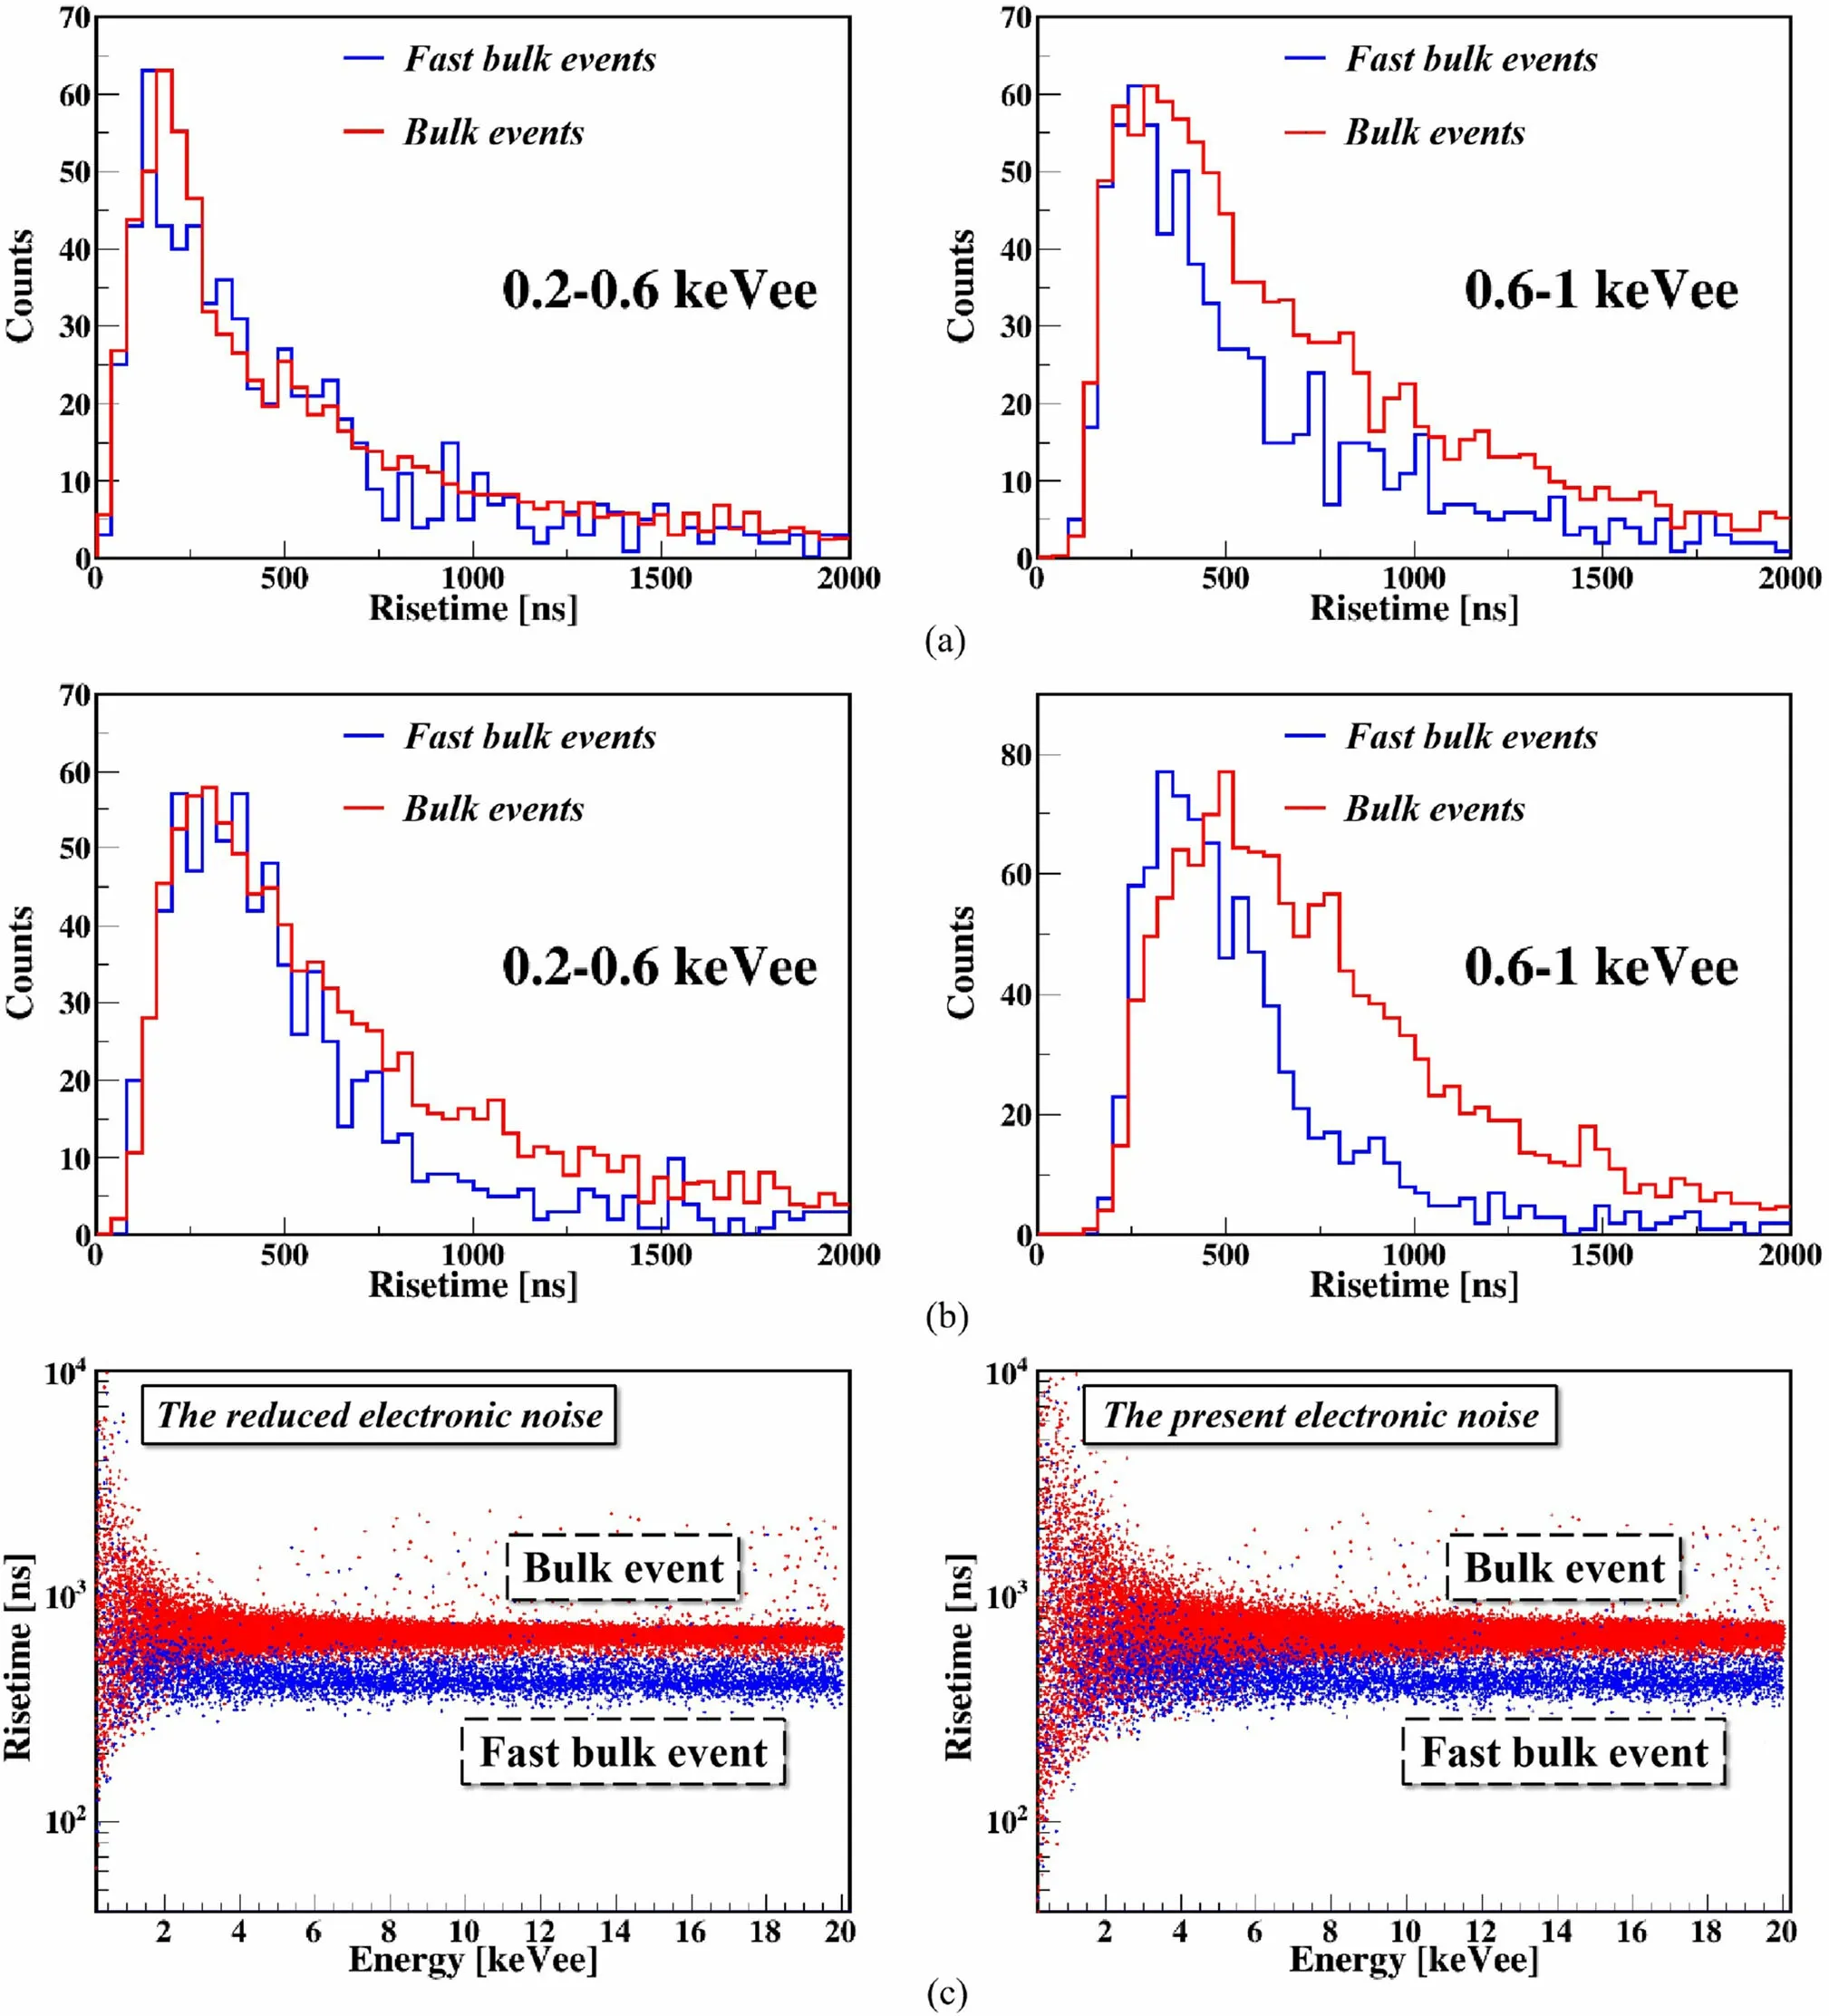
Fig. 18 (Color online) Simulated rise time distributions of FBEs(blue line)and BEs(red line)in the 0.2–0.6 keVee energy range(left panel)and 0.6–1 keVee energy range(right panel)assuming a current electronic noise and b electronic noise reduced by a factor of two.c Scatter plot of rise time versus energy for simulated events with energy above 0.2 keVee assuming an electronic noise level reduced by a factor of two (left panel), where blue points represent FBEs and red points represent BEs. A scatter plot under the current electronic noise (right panel) is presented for comparison
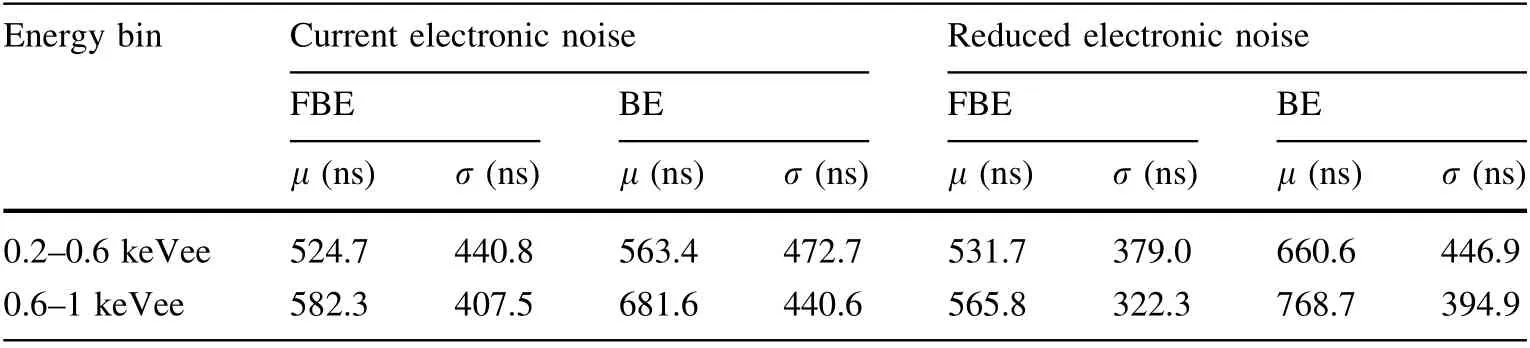
Table 3 Mean (μ) and width(σ)of FBE and BE distributions in 0.2–0.6 keVee and 0.6–1 keVee energy bins for current electronic noise and electronic noise reduced by a factor of two
The simulations and measurements presented here improve our understanding of the anomalous bulk effect in pPCGe detectors. They serve as a basis for better identification of FBEs as background in rare-event searches with germanium detectors.
Author ContributionsAll authors contributed to the study conception and design. Material preparation, data collection, and analysis were performed by Ren-Ming-Jie Li,Shu-Kui Liu,Shin-Ted Lin,Li-Tao Yang, and Qian Yue. The first draft of the manuscript was written by Ren-Ming-Jie Li, and all authors commented on previous versions of the manuscript. All authors read and approved the final manuscript.
杂志排行

Nuclear Science and Techniques的其它文章
- Spatial resolution and image processing for pinhole camera-based X-ray fluorescence imaging: a simulation study
- Picosecond time-resolved X-ray ferromagnetic resonance measurements at Shanghai synchrotron radiation facility
- Nonrecursive residual Monte Carlo method for SN transport discretization error estimation
- Density fluctuations in intermediate-energy heavy-ion collisions
- Isospin effects on intermediate mass fragments at intermediate energy-heavy ion collisions
- Free-radical evolution and decay in cross-linked polytetrafluoroethylene irradiated by gamma-rays