Reconstruction of a muon bundle in the JUNO central detector
2022-07-26ChengFengYangYongBoHuangJiLeiXuDiRuWuYongPengZhangWuMingLuoMiaoHeGuoMingChenSiYuanZhang
Cheng-Feng Yang · Yong-Bo Huang· Ji-Lei Xu · Di-Ru Wu,3 ·Yong-Peng Zhang · Wu-Ming Luo· Miao He · Guo-Ming Chen ·Si-Yuan Zhang
Abstract The Jiangmen Underground Neutrino Observatory (JUNO) is a multi-purpose neutrino experiment. One of the main goals is to determine the neutrino mass ordering by precisely measuring the energy spectrum of reactor antineutrinos. For the detection of reactor antineutrinos, cosmogenic backgrounds, such as 9Li/8He and fast neutrons induced by cosmic muons, should be rejected carefully by applying muon veto cuts, which require good muon track reconstruction. With a 20-kton liquid scintillator detector,the simulation shows the proportion of muon bundles(muon multiplicity ≥2)to be approximately 8%in JUNO,whereas its reconstruction has been rarely discussed in previous experiments. This study proposes an efficient algorithm for muon track reconstruction based on the charge response of a photomultiplier tube array.This is the first reconstruction of muon bundles in a large-volume liquid scintillator detector.In addition,the algorithm shows good performance and potential for reconstruction for both a single muon and double muons (muon multiplicity = 2).The spatial resolution of a single-muon reconstruction was 20 cm, and the angular resolution was 0.5°. For doublemuon reconstruction, the spatial and angular resolutions could be 30 cm and 1.0°, respectively. Moreover, this paper also discusses muon classification and the veto strategy.
Keywords JUNO · Liquid scintillator detector · Muon reconstruction · Muon bundle · Veto strategy
1 Introduction
Long-lived radioactive isotopes produced by energetic cosmic muons are one of the main sources of large-volume neutrino and dark matter detectors [1–9]. Locating the detector deep underground to provide an essential overburden is an effective approach for suppressing muon-induced backgrounds. The Jiangmen Underground Neutrino Observatory(JUNO)[3,10,11]is a multi-purpose neutrino experiment with a detector approximately 700 m underground.One of the main goals is to determine the neutrino mass ordering by precisely measuring the energy spectrum of reactor antineutrinos at a site approximately 53 km from the reactors of the Yangjiang and Taishan nuclear power plants. Figure 1 shows a schematic of the JUNO detector.The central detector(CD)is a 35.4-m-diameter sphere with a 20-kton liquid scintillator detector inside that uses 17,612 20-inch photomultiplier tubes (PMTs) and 25,600 3-inch PMTs as photosensors. The water Cerenkov detector is a cylindrical water pool with 2400 20-inch PMTs filled with 35 kton of ultrapure water as a muon veto and radioactive shielding.The top-tracker detector can be used to tag muon events.

Fig. 1 (Color online) Schematic view of the JUNO detector
In the muon simulation using the JUNO offline software[12, 13], the cosmic air shower simulation at the JUNO site, local geological map, and details of the detector structure were considered, resulting in a muon rate of approximately 0.004 Hz/m2with an average muon energy of approximately 207 GeV[10].The simulation shows that there are approximately 92% single-muon events, approximately 6%double-muon events,and less than 2%of other events with muon multiplicity of three or more. The muon energy deposit ranged from 0 to approximately 100 GeV.For a giant volume detector such as JUNO, the muon rate(~3.4 × 10⁵/day) is still much higher than the reactor antineutrino rate (~83 inverse beta decay (IBD) events caused by the reactor per day before the selection cut).According to a preliminary antineutrino selection criterion[3], there are approximately 71 residual cosmogenic9Li/8He events per day,which is comparable to IBD events(73 per day) after the antineutrino selection cut. Thus, the βn decay from9Li/8He is the most seriously correlated background to reactor antineutrinos and needs to be further rejected with an efficient muon veto strategy. Vetoing the entire volume for some time after a muon event is both uneconomical and would result in too much exposure.Because most cosmogenic isotopes are generated near the muon track, a strategy that vetoes a sufficient cylindrical volume along the muon trajectory has been adopted,which has been proven to be a good approach [3]. For lowbackground experiments, such as neutrino and dark matter experiments, muon-induced background suppression is the main motivation for muon reconstruction.
There are several types of muon tracks in the JUNO spherical detector.According to the position relative to the detector and the behavior of the muon tracks,the tracks can be classified into the following categories, as shown in Fig. 2.
(1) Through-going muon: This corresponds to a muon that goes through the CD and the distance between the muon track and the center of the CD is less than 16 m.
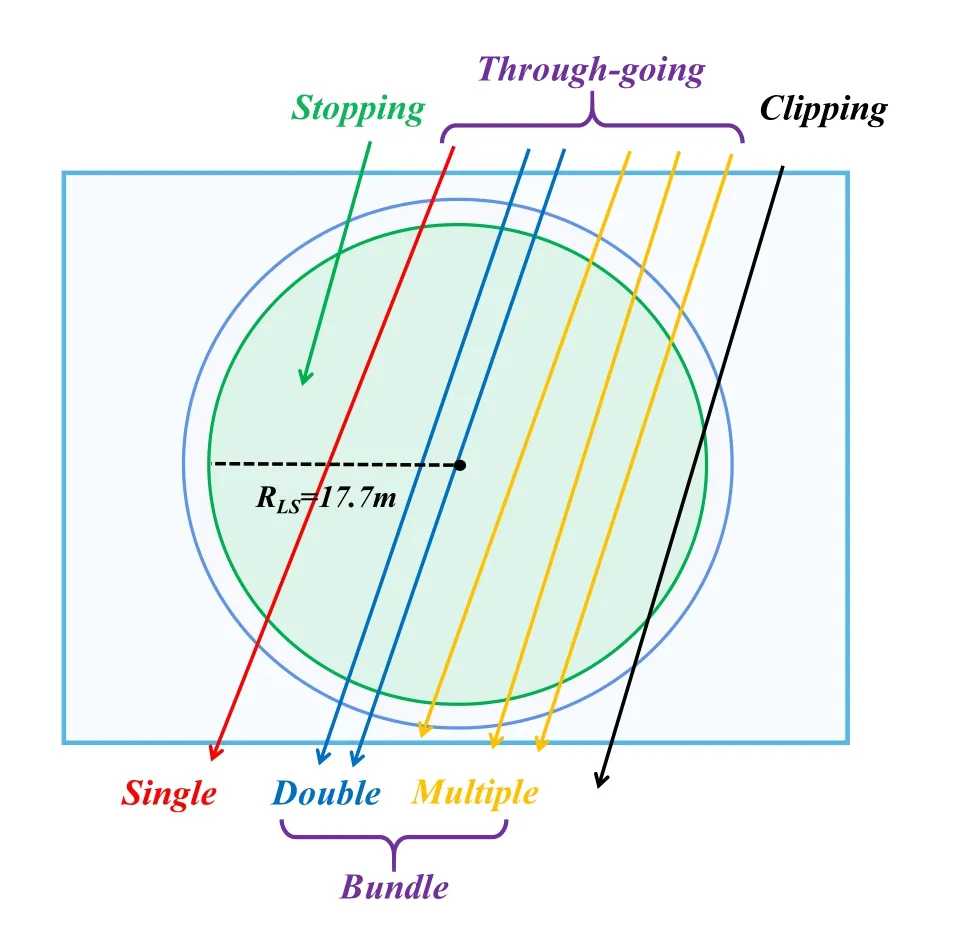
Fig. 2 (Color online) Schematic of a spherical target detector and different kinds of muon events labelled with single, bundle (double and multiple), through-going, stopping, and clipping
(2) Clipping muon: This corresponds to a muon that passes through the CD but leaves only a short track in the detector(in other words,the distance between the muon track and the center of the CD is larger than 16 m).
(3) Stopping muon: This corresponds to a muon track that has stopped in the CD.
In addition, based on muon multiplicity, muons can be classified into the following categories:single,double,and multiple(Fig. 2).Muon bundles[14–18],corresponding to muons with multiplicity of two or more,are remnants of air showers produced in the atmosphere by high-energy cosmic-ray nuclei. When multiple muons enter an underground detector simultaneously, their tracks are approximately parallel because they are produced in the same air shower, which typically occurs kilometers away from the detector [16].
In previous experiments, the reconstruction of single muons has been well studied in both water/ice Cherenkov detectors [19–21] and liquid scintillator detectors [22, 23];however,the reconstruction of muon bundles has only been studied in large water/ice Cherenkov detectors [24–26]. In JUNO, three reconstruction algorithms have been developed for single muons, such as a method with a geometrical model which utilizes the geometrical shape of the fastest light [27], a method with the fastest light model which utilizes the minimization of the first hit time (FHT)[28], and new technology using deep learning and GPU acceleration [30]. However, reconstruction of muon bundles was not included. The time needed for the first two algorithms is at the level of a few seconds.For experiments with detectors of tens of meters,such as JUNO and LENA[31],the proportion of muon bundles is higher.Hence,it is necessary to develop an algorithm to reconstruct multiple muon tracks.This paper proposes an efficient algorithm for the track reconstruction of both single and double muons which also demonstrates good reconstruction abilities for clipping muons based on experiments at JUNO. However,a few muon tracks are accompanied by electromagnetic or hadronic showers, called shower muons, and it is difficult to estimate where the showers take place. A dedicated algorithm for shower muons is being developed; however,it is not the subject of this study.
2 Charge pattern of the PMT hit array
When a cosmic muon passes through the JUNO detector, the muon leaves track information in the detector,including time and charge information. For example, we can observe a PMT charge cluster at the incident point and another charge cluster at the exit point.To deal more easily with the charge clusters, the PMT hit array was projected onto a two-dimensional (2D) plane to show the charge pattern(Fig. 3).In the charge pattern,the number of PMTs in each pixel varied from zero to eight depending on their locations.
The fastest light [27–29] information around the muon track is widely used for single-muon reconstruction, but it is more complicated to handle in the case of multiple muon tracks. To reconstruct muon bundles, the charge pattern of the PMT hit array was investigated, and different types of muons can provide different charge clusters (Fig. 3). The 20-inch PMTs near the muon incident point and the exit point receive several thousands of photoelectrons (PEs);they are expected to be saturated and are not applied in this analysis. The 3-inch PMTs, with a photocathode area approximately 40 times smaller than that of the large PMTs,work in a larger dynamic range and are suitable for this study [13, 32].
Different types of muons have different charge pattern cluster features. The cluster number is related to the muon track number and track behavior, which are listed in Table 1. A single through-going muon event (Fig. 3a) has two clusters,but a single clipping-muon event(Fig. 3c)has only one cluster, because its incident and exit points are very close. A single stopping-muon event (Fig. 3d) has only one cluster because it has only one incident point,but not an exit point. A through-going muon event (Fig. 3b)has four clusters that correspond to two incident and two exit points. There might be one or both tracks clipping in double muons, so the number of clusters is three or two.Similarly, a stopping double-muon event includes three clusters(one muon stops)or two clusters(both muon stop).For muons with multiplicity of three or more (multiple muons), their reconstruction corresponds to a low reconstruction efficiency and is not discussed further in this paper.
3 Reconstruction algorithm
Using information from the PMT charge pattern, a reconstruction algorithm was developed for both single and double muons. The following is a brief step list of the algorithm flow (Fig. 4). More details are introduced later.
(1) Project the PMT charge pattern onto the θ–φ plane.
(2) Discard PMTs with charges smaller than 75 PEs,further details are given in Fig. 5.
(3) Apply the charge smoothing method (Sect. 3.2) to reduce the number of fake clusters found when applying the fitting in the next step.
(4) Fit with the ROOT [33] tool ‘‘TSpectrum2’’ [34] to determine the center positions of clusters (cluster seeds) for all possible cluster candidates.
(5) Rotate the PMT ball by 90°so that the PMTs close to the north and south poles are moved to the equator(Sect. 3.2) and then repeat steps (1)–(4). When cluster seeds are found, their spatial coordinates are converted back to real coordinates before rotation.This rotation operation is applied to avoid distortions when projecting PMTs from a spherical surface to a 2D plane, especially in the area near the north and south pole.
(6) Charge-weighted calculation to correct each cluster seed and discard fake seeds.
(7) Adjacent candidate seeds are merged if they are too close.
(8) We matched two candidate seeds as a muon track.An additional strategy is used to handle cases where there are more than two candidate seeds. More details can be found in Sect. 3.3.
3.1 Methodologies
For the JUNO detector,the PMTs closely packed around the LS sphere form a PMT shell, which is a 2D surface instead of a 3D surface, so the PMT charge hit pattern can be projected onto a 2D plane to perform convenient fitting.Similar to the world map of the Earth, there are several projection methods to obtain a 2D map, such as the longitude–latitude projection method and the spherical projection method, but every method introduces distortion through the projection. For reconstruction, different projection methods yielded similar reconstruction results.Finally, we selected the longitude–latitude projection method. The φ angle of the PMT position is for the X-axis on the 2D plane, and the θ angle is for the Y-axis.

Fig. 3 (Color online) Charge pattern of the PMT hit array was projected on the θ–φ 2D plane for the single, bundle, clipping, and stopping muons,respectively.Here θ =90°,0°,and-90° correspond to the north pole, equator, and south pole, respectively. The purple solid dots correspond to the true incident and exit points of the muons.As there is a water buffer with a thickness of 1.8 m between the PMT spherical shell and LS sphere,the charge cluster center on the charge pattern is not exactly equal to the muon true incident and exit points;further explanation is given in Fig. 8
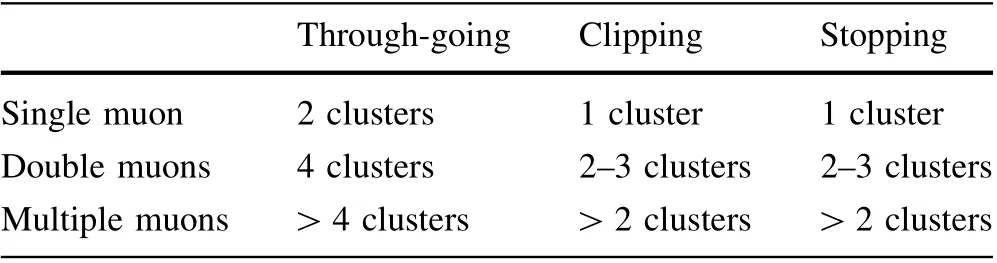
Table 1 Cluster number of different muon types
When a muon passes through the LS,more than 90%of the photons are emitted from the scintillation process,which emits isotropic light.The closest PMTs to the muon incident point or exit point will collect the most PEs,which will create two clusters on the PMT charge-hit pattern(Fig. 3a).Figure 5 shows an example of the distribution of the number of photoelectrons (nPE) for a single throughgoing-muon event and a double through-going-muon event. PMTs with a charge greater than 75 PEs generally correspond to clusters caused by muon tracks.To highlight the clusters that were caused by muon incident and exit points, we needed to eliminate the PMT noise (~1 PE),radioactivity (several PEs), and PMTs far from clusters(tens of PEs). As a result,PMTs with charges smaller than 75 PEs are discarded. In a simulation study using the JUNO offline software [12, 13], when the maximum discard charge varies from 70 to 80 PEs, the reconstruction result is not changed significantly; more details can be found later (Sect. 4.2 and Fig. 14b).
For the PMT charge pattern, a 2D peak searching and fitting algorithm named ‘‘TSpectrum2’’ was investigated and applied. ‘‘TSpectrum2’’ is a ROOT tool [34], which is based on a 2D Gaussian function fitting,and it searches for peaks in source spectrum with a deconvolution method.‘‘TSpectrum2’’ can obtain the maximum local peak by calculating the spectrum of the standard deviations of the smoothed second derivatives in two dimensions[35].If the fit is successful, the number of identified peaks and their locations are returned. The identified peaks were arranged according to their heights in the spectrum.In our study,the maximum number of clusters was set to seven to list the highest seven peaks only, which is sufficient for searching for single muons (2 peaks), double muons (4 peaks), and triple muons (6 peaks). The tracking precision of triple muons is much lower than that of double muons,so it is not described in this paper, but we still set the maximum to seven to retain the reconstruction potential for triple muons when using this method, which will be studied further in the future. ‘‘TSpectrum2’’ runs very fast (Sect. 4.3) and it can mathematically find the cluster seed candidates.
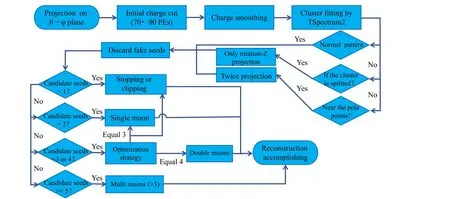
Fig. 4 Flowchart of muon track reconstruction

Fig. 5 (Color online) Example of the nPE distribution of a single through-going-muon event (red) and a double through-going-muon event(blue).The PMTs with a charge of more than 75 PEs generally correspond to the clusters caused by muon tracks
However, the ‘‘TSpectrum2’’ fitting usually finds more seeds than at the muon incident and exit points. The unmatched seeds were caused by the statistical fluctuation of the PMT charge.In the simulation,the collected charges of adjacent PMTs surrounding the largest charge collection PMT do not continuously drop from the cluster center to the cluster edge. However, some muons have a relatively large energy deposit at a certain position along the track.All of these may result in an incorrect cluster number and fake cluster seeds when matching with the true muon hit points.Figure 6a shows an example of the PMT charge hit pattern of a single through-going-muon event before charge smoothing above the PMT charge threshold. This shows that the fitting finds three cluster seeds near the muon exit point,where we need only one cluster seed.The fitting results for the cluster seeds must be carefully checked and analyzed.
To discard fake cluster seeds and obtain true hit points,a charge-weighted algorithm was developed. First, based on each cluster seed, we calculated the charge-weighted position of the fired PMTs in a 4-m radius (corresponding to the size of the normal cluster) using the following formula:
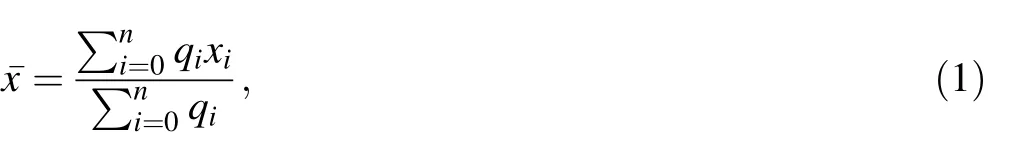
where xiis the spatial position of PMTi,n is the number of fired PMTs in a 4-m radius around the cluster seed, and qiis the charge collected by PMTi.If the total charge in a 4-m radius around the cluster seed is less than 1000 PEs, the cluster seed is discarded.

Fig. 6 (Color online) Hit patterns of a single through-going-muon event before and after smoothing. a The PMTs with charges smaller than 75 PEs are discarded; as a result, the pixels only with small charges are not shown.The red triangles are the cluster seeds fitted by‘‘TSpectrum2.’’ Two purple circles indicate the muon true incident and exit points on the pattern. The black stars are the final reconstructed muon track incident and exit points. b The smoothed charge cluster. The same labels as in Fig. 6a are used. The cluster seeds (red triangles) were reduced from three to two for the bottom cluster
Second, after the calculation, replace the cluster seed with the charge-weighted position (¯x). Then, if two new cluster seeds are too close (<4 m), they are merged into one point according to their charge weights. This step can filter out most of the fake seeds given by ‘‘TSpectrum2’’fitting and give a correct position. Third, if the gathered cluster charge within a radius of 4 m around the cluster seed is too small(<10%of the total charge of all clusters),the seed is also discarded. This can eliminate the smallcharge clusters found by ‘‘TSpectrum2’’ fitting which cannot match with the true incident and exit points of the muons. Finally, the charge-weighted positions of the remaining clusters were considered as muon incident and exit points.
3.2 Distortion elimination and performance optimization
To make the muon track reconstruction more precise,we eliminated distortion using the rotation method,removed the statistical fluctuation of the charge cluster using the smoothing method, and transferred the cluster seeds on the PMT charge pattern onto the true muon track.
As mentioned previously,the projection method(normal projection) causes non-negligible distortion, particularly near the polar zone. To avoid projection distortion, we rotated the PMT positions 90°around the X-axis to allow the north and south poles to be placed at the equator(Fig. 7), and then, the new PMT positions are again projected onto θ–φ 2D plane (called rotation-X projection).The cluster seeds in the θ range(-50°,50°)were selected in both the normal projection (before the rotation) and rotation-X projection (after the rotation). Some repeated seeds in the overlap area of the two types of projection are merged during the charge-weighted step.

Fig. 7 (Color online) Rotation method of PMTs to reduce the distortion of projection. The dotted line is the equator and the solid line is the muon track.After rotating 90° around the X-axis,the north and south poles are located at the equator
Sometimes,some clusters are split from one cluster into two clusters when the incident or exit points are located at the edge of the 2D plane (φ >160°or φ<-160°). First,the PMTs were rotated 90° around the Z-axis (rotation-Z projection) to obtain the precise position of the clusters that were located at the edge of the 2D plane. Then,combined with the normal projection and rotation-Z projection, we check whether some fitted points are located at the edge.If a cluster is split into two parts,the fitting result from the rotation-Z projection is used.
In addition,apart from the peaks induced by the incident and exit points of the muon,there were also some relatively small peaks.This is because of the statistical fluctuation in the PE number collected by the PMTs or a relatively largeenergy deposit at a certain location along the muon track.Figure 6a shows all the reconstructed peaks. Meanwhile,the‘‘TSpectrum2’’tool may supply fitted points at the nonhit position. To handle this effect, each pixel’s charge was smoothed (qs) based on the adjacent pixel charges using the smoothing formula:
where qiis the charge of the ith adjacent pixel, w0and w1are the weight factors, with the best tuning result w0/w1=4/9, and diis the distance factor between the smoothing pixel and the ith adjacent pixel. The distance factor of the nearest pixel was one. The further the pixel distance, the larger diis and the lower the weight of qi. Here N is the number of adjacent pixels that are used for charge smoothing and surround the specified pixel,which is set to 24. A comparison of Fig. 6a and b shows that the charge smoothing method can make the cluster peaks protrude further, reduce the number of false fitting peaks, and can also improve the reconstruction efficiency.
In fact, the charge cluster center is not exactly equal to the true incident and exit points of the muon. This is because there is a water buffer with a thickness of 1.8 m between the PMT spherical shell and the LS sphere(Fig. 8).When a muon enters the PMT shell,most photons originate from the LS,and the PMT charge cluster is close to the muon hit point of the LS. As a result, the track reconstructed by the PMT charge cluster center does not correspond to the true muon track. For this reason, the cluster charge centers (yellow clusters in Fig. 8) must be translated into true muon hit points on the LS sphere (red clusters in Fig. 8), according to their spatial positions.Finally, we reconstructed the muon track (green dotted line) using the reconstructed incident and exit points.

Fig. 8 (Color online) Schematic diagram of a single-muon track reconstruction with two clusters. In JUNO detector, there is a water buffer with a thickness of 1.8 m between the PMT spherical shell and LS sphere. The cluster charge centers (yellow clusters) make a fake track and need to be corrected by a geometric effect to obtain the reconstructed track
3.3 Double-muon event reconstruction strategies
As listed in Table 1, a double-muon event typically corresponds to four hit points.Every two points comprise a track candidate. There are three combinations of four hit points, and two of them are in parallel; thus, they can be considered as muon bundle candidates, as shown in Fig. 9a. The PMT timing information was used to further identify the true muon tracks.
With each reconstructed point in the center,the FHTs of the surrounding PMTs within 4 m were averaged as the cluster time. The two earlier times were treated as two incident points, and the other two points were treated as two exit points. This time strategy can help to determine the correct combination.
If the two tracks are too close, then only two cluster seeds can be found (Fig. 9b). In this case, the two cluster seeds are connected and reconstructed into a single track.Although the two tracks are close,the overlapped cluster is larger than the normal cluster. The distance between two muon tracks can be deduced from the overlapped cluster information. The primary requirement of muon track reconstruction is to veto muon-induced isotopes through a cylindrical volume cut along the muon track. Although only one track is reconstructed, a cylindrical cut with a larger radius will be considered and can provide the same background reduction ability.
If double muons have only three charge clusters,it is not easy to distinguish between the two muon tracks. In this study, we identified three cases in a three-cluster situation(Fig. 9c–e). One case occurred when two incident points overlapped (Fig. 9c). We calculated the average FHT (¯T)of the surrounding PMTs within 4 m of each cluster.Because two tracks in the double muons shoot in the LS at the same time,the ¯T of the incident or exit points are close.In three values of ¯T, if the two ¯T differences are less than 5 ns, both clusters are recognized as exit points and the other is the incident point. Then, the two muons can be correctly tracked using the incident point twice. Although the incident point is not very precise, the larger radius cylindrical cut according to the incident cluster size along each track can still provide the same background reduction of the muon-induced isotopes.
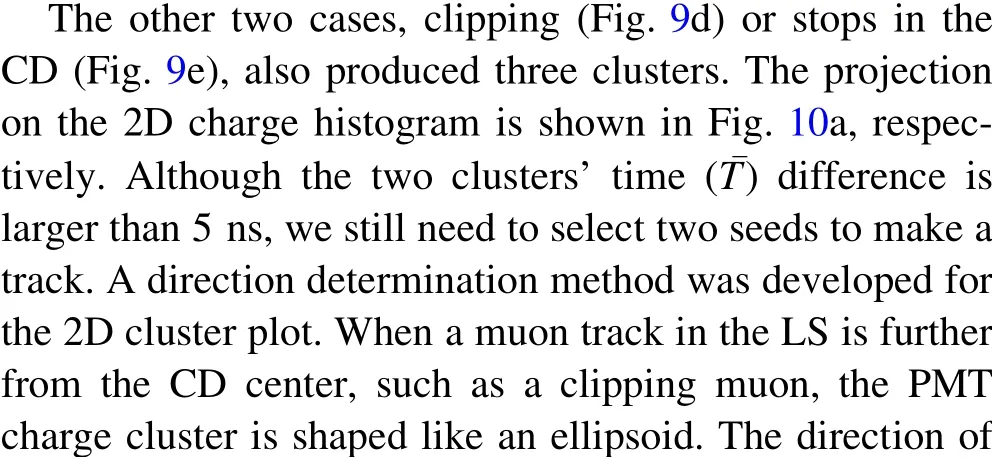

Fig. 9 (Color online) Plots of different double-muon events hitting the CD and their clusters. a Double-muon event which has two parallel tracks hits the detector almost at the same time, resulting in four isolated clusters.b Two close tracks in a muon event hit the CD and only resulted in two clusters because of the overlap. c Two relatively close (~4 m) tracks with a small angle (<2°), the two incident points correspond to one cluster and the two exit points correspond to two clusters. d One clipping track in a double-muon event and the resulting three clusters.e One stopping-muon event in a double muon resulting in three clusters
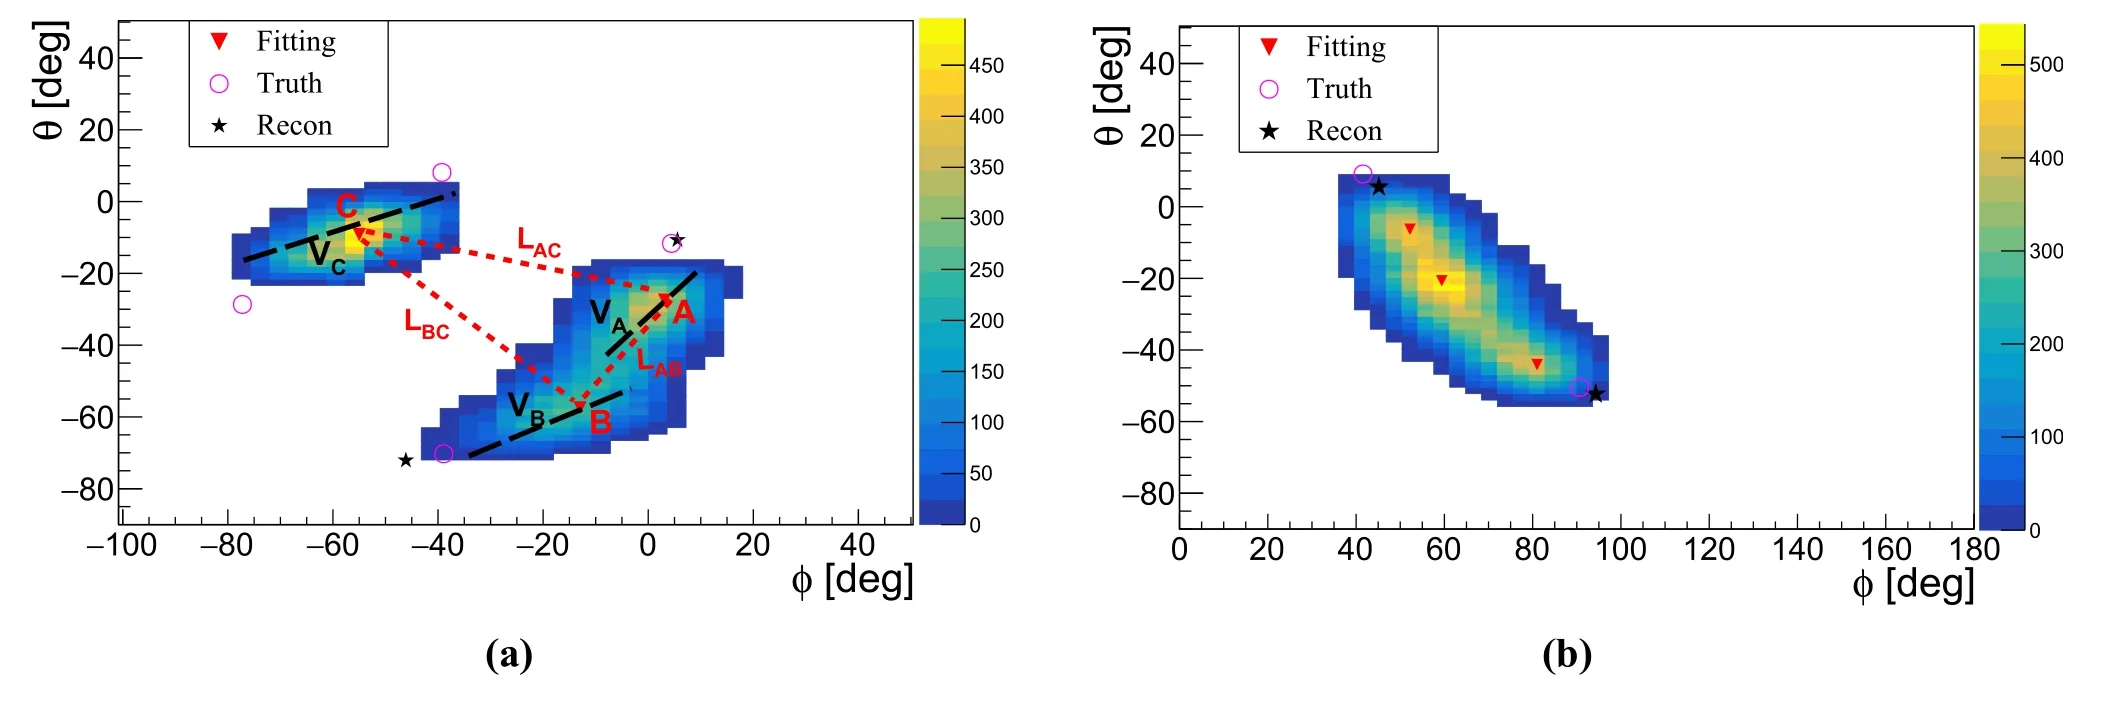
Fig. 10 (Color online) An example of the three cluster charge patterns from a double-muon event and single-muon event. a An example of the three clusters’ (A, B, and C) charge patterns by a double-muon event which have one edge muon track. The black dashed lines are the vectors (VA, VB, and VC) for the three clusters.The red dashed lines correspond to the candidate tracks(LAB,LBC,and LAC). b An example of the three cluster charge patterns by a singlemuon event whose distance to the CD center is about 14 m and near the edge of the CD

A single-muon event may also have three clusters,which may confuse double-muon reconstruction. When a single-muon track is close to the edge of the LS sphere(the spatial distance between the muon track and LS center is from 13 to 16 m),the photon emissions on the muon track are all close to the PMTs and almost all PMTs are fired(Fig. 10b). For this case, we still calculated the corresponding three angle values using Eq. (3). The main feature is that all three angles are less than 5°. Therefore, we used this feature to distinguish between single and double muons. The midpoint (Fig. 10b) is a false point, and the remaining two points are selected as incident and exit points.
4 Reconstruction performance and discussion
To optimize and validate the reconstruction algorithm in this study,approximately 380,000 simulated muon samples were produced using the JUNO offline software [12, 13].The simulated muon samples included approximately 92%single-muon events, approximately 6% double-muon events, and less than 2% multiple-muon events. The reconstruction resolution and accuracy of the muon track form the basis for the muon veto strategy and background rejection. In addition, the reconstruction efficiency,robustness,and speed should be considered to evaluate the performance of the reconstruction algorithm,especially for experiments with high muon rate and large-volume detectors.
4.1 Reconstruction performances of single and double muons
To obtain further exposure for the signal (neutrinos or others),the basic veto strategy is to apply a partial volume veto along the muon track for a period of time. The reconstructed and true track relative positions can be described using two parameters, ΔD and α. Here ΔD is defined as ΔD =Dt-Dr, where Dr and Dt are the distances between the reconstructed and true tracks from the center of the CD. We use α to denote the acute angle between two tracks (Fig. 11).
Fig. 11 (Color online) Schematic of the parameters ΔD and α. Here ΔD =Dt-Dr,where Dr and Dt are the distance of the reconstructed and true track from the CD center, and α is the acute angle between the two tracks
The distributions of ΔD and α indicate the reconstruction performance. The single and double through-goingmuon reconstruction performance at a distance of 16 m from the detector center is shown in Fig. 12. The distance to the center is divided into eight slices with a 2-m interval,which indicates a muon passing through different detector volumes.For a single muon,the average biases of ΔD in all slices (black squares in Fig. 12a) were less than 5 cm, and the average biases of α (the black squares in Fig. 12b)increase from 0.5°to 1.3°from the detector center to the edge. To reconstruct the double muons, as shown in Fig. 12c and d, the average biases of ΔD increased from 2 to 15 cm, and the average biases of α increased from 0.6°to 1.5°. The reconstruction resolution for each slice is shown in Fig. 13. In the internal volume (R ≤10 m), the resolution of ΔD and α is better than 20 cm and 0.5°for a single muon, and better than 30 cm and 0.6°for double muons. In the case of a muon passing through an external volume (10 m ≤R<16 m), the resolution of ΔD and α increases to approximately 22 cm and 0.9°for a single muon and to approximately 35 cm and 1.2°for double muons, respectively. This is because the track length is short near the edge,and the corresponding clusters of muon incident and exit points may overlap; thus, there will be more deviations in the search for cluster seeds based on the charge-weight method.As mentioned in Sect. 2,a clipping muon (16 m ≤R<17.7 m) creates a short track, and the two clusters easily overlap into one cluster;therefore, they are difficult to reconstruct into one track,so they cannot be evaluated by the parameters ΔD and α.
4.2 Reconstruction efficiency and muon bundle veto strategy discussion
As mentioned in Sect. 3, to match two candidate seeds to a muon track, several optimization methods were applied, especially in the case of more than two cluster seeds. As a result, most muon tracks can be reconstructed well. However, there are still some cases in which the muon track cannot be reconstructed (reconstructed track unavailable) or the reconstructed track is far from the true track(ΔD or α is larger than the five standard deviations of their distributions). For a single and double through-going muons, the percentages of these two cases are 1.6% and 1.0%and 1.7%and 3%,respectively.After reconstruction,reconstruction efficiency can be defined as the ratio of successful reconstruction to the total number of events.Figure 14a shows the reconstruction efficiency of single and double through-going muons. A single through-going muon with high reconstruction efficiency has an average efficiency of 98.3% ± 0.1%. The average reconstruction efficiency of the double through-going muons was 95.5% ± 0.2%. In addition, as shown in Fig. 14b, the reconstruction efficiencies of single and double throughgoing muons are stable when the PE cut varies from 70 to 80 PEs.
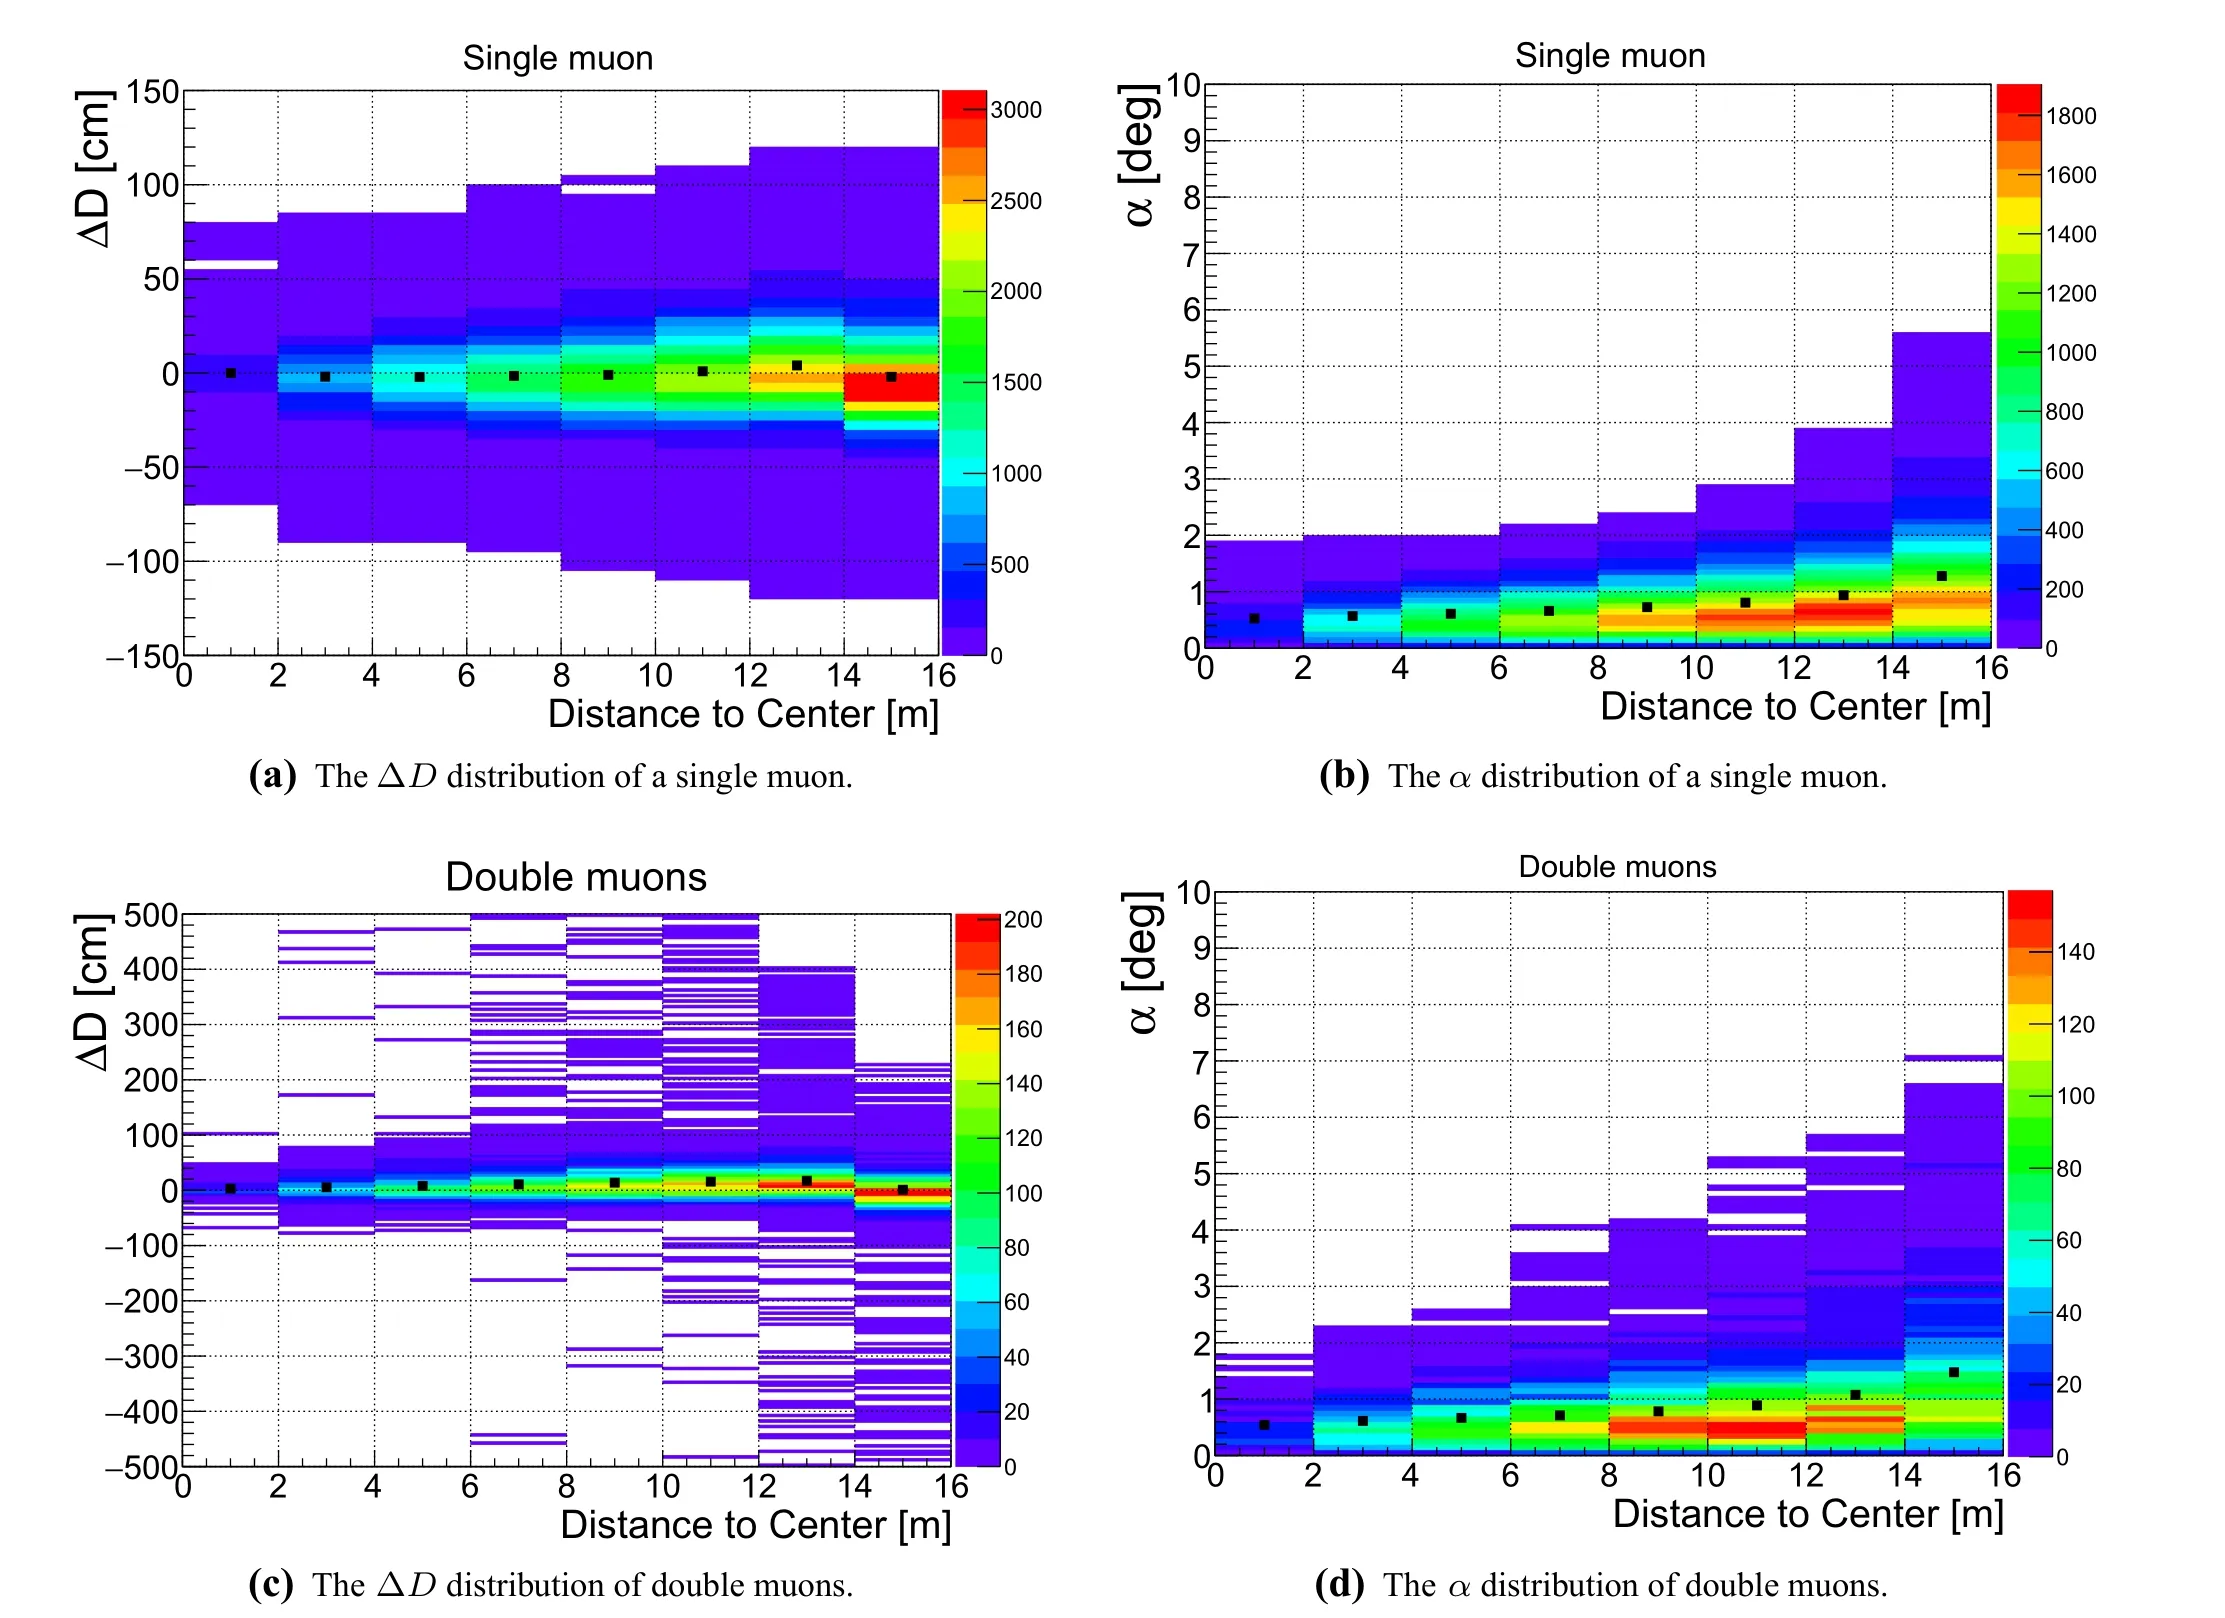
Fig. 12 (Color online) Reconstruction distribution of ΔD and α versus muon distance to the CD center for a single muon in (a) and(b) and for double muons in (c) and (d). Different distances to the center indicate a muon passing through different detector volumes.For double muons, ΔD, α, and the distances to the center are calculated according to their single track. In these figures, the color corresponds to the number of muons in each bin, and the black squares correspond to the average values of ΔD or α in each bin.The error bars of the black squares are very small and cannot be observed

Fig. 13 (Color online) Resolutions of ΔD and α for single and double through-going muons in different detector volumes
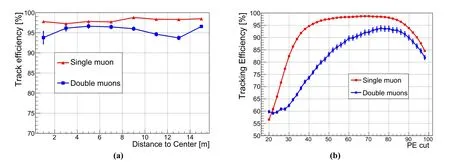
Fig.14 (Color online)a Reconstruction efficiency for single and double through-going muons.For double through-going muons,the distances to the center are calculated according to their single track. b The effect of PE cut (Sect. 3.1) on reconstruction efficiency
A muon veto strategy can be developed based on the reconstructed muon track. A simple approach is to veto a cylindrical volume along the muon trajectory in a given time period[3].Considering the position dependence of the reconstruction bias and resolution(Sect. 4.1),the radius of the cylinder can be modified by increasing the reconstruction bias and resolution[27].Furthermore,a distancedependent veto strategy was introduced for the detection of8B solar neutrinos at JUNO [36], which investigates the time and distance distributions between the isotopes and muon tracks in detail and can significantly improve the signal-to-background-noise ratio. Considering the nonnegligible contribution from the muon bundle and the higher estimated muon rate caused by the shallower overburden in JUNO, the veto strategy of JUNO must be optimized to obtain more exposure.
Using the algorithm in this study, we can reconstruct different types of muons and develop their corresponding veto strategies in the future. For a muon event with an available reconstructed track, a distance-dependent cylindrical veto cut along the reconstructed track is applied.The rejected detector volume and veto time can be determined according to the space and time distributions from the muon track to9Li/8He [36]. If a double-muon event is reconstructed with two nearby reconstructed tracks (track distance d<3 m), a larger cylindrical radius is used in the above strategy. For a clipping or stopping muon, their tracks are difficult to reconstruct because of the heavy smearing of clusters;thus,a spherical veto using the cluster seed as the center are used for conservative exclusion. For multiple-muon events, the cluster features of the charge pattern are more complicated, and it is difficult to match them to the correct muon tracks. As a result, the tracking precision of multiple muons was much lower than that of single and double muons,so it is not shown in this paper.In reconstruction, if a muon event is tagged as multiple muons, a whole-volume veto is applied. In addition, for failed reconstruction events whose track or cluster seeds are unavailable, we also veto a whole volume. However, a new method (called neutron veto) is under development that can use the corresponding neutron to precisely determine the position of muon-induced isotopes. A neutron veto uses a spherical veto on neutrons due to isotope and neutron space correlations. This is expected to save more dead volume and allow a longer veto time window for long-lived isotope rejection.On the other hand,the neutron veto is also expected to have a good ability to reject9Li/8He from the shower muon. Thus, in addition to the muon veto, the neutron veto can be used to extend the veto strategy in the future.
4.3 Reconstruction speed performance
The time distribution of muon reconstruction is shown in Fig. 15, which was approximately 98 ms/event. The CPU (Intel Xeon E5-2660 v4) implementation of the reconstruction method in this study provides a significant processing speed improvement by a factor of 51 compared with the fastest light method (5000 ms/event) [28, 30].This speed makes it possible to apply the algorithm in online event classification, which requires fast online filtering for possible data rate reduction.
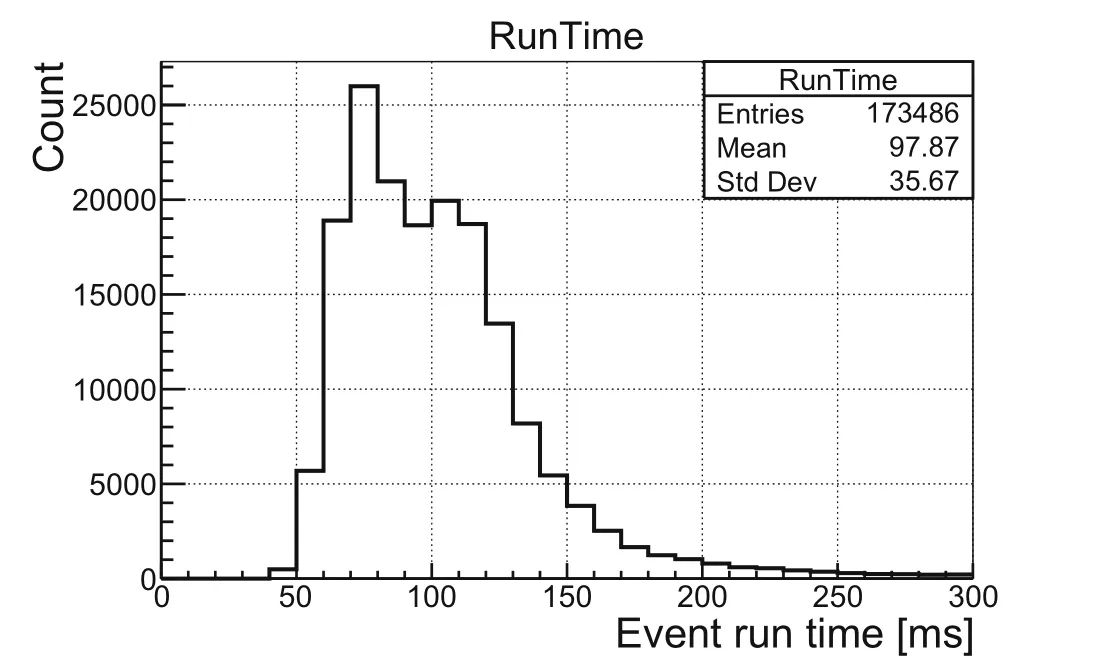
Fig. 15 Reconstruction speed of a muon event
5 Summary
This is the first reconstruction of muon bundles in a large-volume liquid scintillator detector. We developed a muon track reconstruction algorithm that mainly focuses on double muons,and it also shows good performance and potential for the reconstruction of a single muon. The algorithm was verified using the JUNO underground muon samples simulated by Geant4 in JUNO offline software.For the spherical geometry of JUNO’s LS target, different muons have different characteristics. Muon events are classified into single-, double-, and multiple-muon categories, and each category has through-going, clipping, and stopping features. These types of muons were considered and reconstructed, which is similar to the real situation in the future when recording the data.
The muon track incident and exit clusters on the PMT charge-hit pattern can be roughly searched, and their centers can be fitted using the ROOT tool ‘TSpectrum2.’’However, the obtained clusters must be processed further and corrected. In addition to repeated charge weighting based on the surrounding PMTs, several optimization methods, such as rotation projection, charge smoothing,and geometry correction, have been developed. A complicated clustering strategy for double muons has been discussed in detail. The reconstructed results indicate that the algorithm can reconstruct muon tracks with a resolution of 20 cm from the detector center, 0.5°in angle, and a tracking efficiency of 98.3% ± 0.1% for single-muon events. For double-muon events, the resolutions of the distance to the detector center and angle were approximately 30 cm and 1.0°, respectively, and the tracking efficiency was 95.5% ± 0.2%.
Finally, we have discussed an optimized veto strategy that includes a distance-dependent cylindrical veto and spherical veto for different muons, and it is expected to obtain more exposure. The reconstruction speed is faster than that of the reconstruction methods that use the fastest light information. This advantage can promote the deployment of the algorithm in online event classification,which requires fast calculation speed to classify events to perform fast online filtering for a possible data rate reduction.
AcknowledgementsWe thank the JUNO offline and reconstruction working group for many helpful discussions.
Author contributionsAll authors contributed to the study conception and design. Material preparation, data collection and analysis were performed by Cheng-Feng Yang, Yong-Bo Huang and Ji-Lei Xu. The first draft of the manuscript was written by Cheng-Feng Yang, Yong-Bo Huang and Ji-Lei Xu, and all authors commented on previous versions of the manuscript. All authors read and approved the final manuscript.
杂志排行

Nuclear Science and Techniques的其它文章
- Spatial resolution and image processing for pinhole camera-based X-ray fluorescence imaging: a simulation study
- Picosecond time-resolved X-ray ferromagnetic resonance measurements at Shanghai synchrotron radiation facility
- Nonrecursive residual Monte Carlo method for SN transport discretization error estimation
- Density fluctuations in intermediate-energy heavy-ion collisions
- Isospin effects on intermediate mass fragments at intermediate energy-heavy ion collisions
- Identification of anomalous fast bulk events in a p-type pointcontact germanium detector