武汉军运会前后臭氧及其前体物的特征和来源
2022-07-19燕莹莹孔少飞宋蔼莉全继宏祁士华
马 静,燕莹莹*,孔少飞,2,宋蔼莉,陈 楠,祝 波,全继宏,祁士华,2
武汉军运会前后臭氧及其前体物的特征和来源
马 静1,燕莹莹1*,孔少飞1,2,宋蔼莉1,陈 楠2,3,祝 波2,3,全继宏2,3,祁士华1,2
(1.中国地质大学(武汉)环境学院,湖北 武汉 430074;2.湖北省大气复合污染研究中心,湖北 武汉 430074;3.湖北省生态环境监测中心站,湖北 武汉 430072)
利用湖北省超级站2019年10~11月的臭氧、NO(= NO + NO2)和102种VOCs物质的小时数据分析了军运会期间臭氧污染变化;基于DSMACC箱型模式模拟不同VOCs和NO浓度下臭氧的光化学生成敏感性;采用PMF模型对前体物VOCs进行源解析,并估算不同源类的臭氧生成潜势.结果显示,军运会保障前臭氧日最大8小时浓度(最大MDA8:219.51mg/m3)超过国家二级标准,保障期臭氧MDA8浓度(135.11mg/m3)明显下降,保障后浓度回升(140.98mg/m3).军运会保障前中期臭氧浓度的差异受气象条件影响更明显,而保障后臭氧浓度的上升主要是因为前体物浓度的大幅增加.根据DSMACC模拟的EKMA曲线,武汉市军运会期间臭氧的光化学生成主要受VOCs浓度变化的影响.进一步对VOCs进行源解析,结果显示,保障前VOCs对臭氧生成贡献较大的源类是燃烧源、石油化工和机动车,分别占23.0%、22.8%和22.5%;保障期间VOCs的主要来源是机动车(38.4%)和燃烧源(25.5%);保障后则主要是石油化工(32.6%)和燃料挥发(25.7%).三个阶段对比发现,军运会的保障方案对石油化工源减排效果明显,但对机动车和燃烧源排放的限制效果并不显著.武汉市应该更注重对燃烧、燃料挥发和机动车排放的治理.
臭氧污染;军运会;源解析;EKMA曲线
当前我国重点区域面临臭氧和细颗粒物复合污染问题,其中臭氧污染日益突出[1].近年来臭氧浓度逐年上升[2-7],以臭氧为首要污染物的污染天气占比逐渐增加[8],臭氧继PM2.5之后备受关注[9].近地层臭氧浓度过高不仅会对农作物的生长[10-12]和全球气候变化[13]造成一定的影响,还会对人类身体健康产生威胁[14-15].我国城市近地层臭氧主要是由氮氧化物(NO)与挥发性有机化合物(VOCs)以及一氧化碳(CO)等多种前体物在光照条件下发生一系列光化学氧化反应产生[16],并通过化学消耗和干沉降过程从大气中去除.
局地臭氧光化学过程与主要前体物(VOCs和NO)的关系受到广泛关注[17-24].Tang等[25]发现,华北地区夏季近地面大气中的臭氧光化学生成由1997年的受NO控制转变成2010年的受VOCs控制.Ding等[26]研究表明,长三角地区臭氧光化学生成受VOCs控制.对珠江三角洲地区臭氧污染做敏感性分析,Wang等[27]研究表明珠三角中部内陆地区和周边沿海地区的臭氧生成受VOCs控制,而珠三角西南部农村地区的臭氧生成受NO控制.这些研究表明,我国城市地区臭氧的光化学生成对VOCs高度敏感.因而,VOCs来源解析以及对臭氧生成的贡献成为近年来研究的热点问题.已有研究表明,我国东部地区汽车尾气排放和生物燃料燃烧占71%,汽油泄漏和溶剂使用占7%,生物质燃烧和工业分别占11%[28];上海地区汽车尾气是VOCs最大的排放源[29].
过去,我国臭氧污染的研究主要集中在四个区域:京津冀[30]、长三角[31]、珠三角[32]和成渝地区[33-34].然而,我国中部地区夏季臭氧污染频发,形成一个新的区域性大气污染核心区[35-37].作为长江流域经济发展的中心,武汉及周边城市群船舶、交通、工业和农业活动等排放密集使得臭氧前体物污染源复杂,且具有高温高湿的气象条件,易于臭氧污染事件形成.近年来武汉地区臭氧污染呈明显增加趋势[38],该地区臭氧污染及其前体物的特征和来源值得关注.
2019年10月18日至27日第七届世界军人运动会(简称军运会)在武汉举行,这次军运会是世界军人运动会历史上规模最大、参赛人员最多的一次运动会.根据军运会环境空气质量保障工作要求,在生态环境部的统一部署下,湖北、河南、安徽等省份确立了保障方案,对武汉市各企业、各类工地施工和船舶、飞机、燃油非道路移动机械等大气污染物排放源,严格执行大气环境质量管理临时性措施.保障方案明确会期保障时段为10月8日至10月28日,保障目标为确保会期武汉市环境空气质量达到优良水平.
类似武汉军运会这样大型活动的环境状况也有许多学者做过研究.例如,孙天乐等[39]对2008年残奥会期间黑炭气溶胶的研究表明,残奥会期间本地黑炭排放有所降低.王羽琴等[40]研究表明深圳大运会期间PM2.5得到很好的控制,但污染控制措施取消后PM2.5浓度突增.在大型活动期间,采取相应的措施能有效地改善大气环境.然而,这些研究大多关注细颗粒物,少有对臭氧的研究.
本研究分析对比了军运会保障期间与保障前后湖北超级站臭氧及其前体物(NO和VOCs)浓度的变化.利用DSMACC箱型模式模拟了不同VOCs和NO浓度下臭氧的生成情况,确定了臭氧光化学生成的敏感性.进一步采用PMF模型对VOCs进行源解析,计算臭氧生成潜势.本研究的主要创新点为揭示了中部地区特大城市武汉臭氧污染的主要来源,评估了军运会保障期间武汉臭氧污染的改善情况及污染减排贡献.研究结果可为武汉及周边地区臭氧污染的预报预警、臭氧污染成因识别和污染防控政策完善提供科学依据.
1 数据与方法
1.1 数据来源
本文所使用的观测数据来自武汉市大气复合污染实验室(“超级站”),超级站位于湖北省武汉市江汉区香江路1号,具体地理坐标为(114.2777°E, 30.6042°N).该站点地处汉口中心城区,为二类功能区,观测点距地面约25m,周围为居民区,无建筑物遮挡,视线较为开阔,无明显工业污染源,监测数据一定程度上可以代表武汉城市中心城区大气污染状况水平.分析的污染物有臭氧、NO、NO2和102种VOCs物质,时间段为2019年10月1日~11月7日.本文中,10月8~28日是军运会保障期,10月1~8日为保障前,10月29日~11月7日为保障后.10月1~7日国庆期间,城市人口、车辆减少,大气环境质量较好[41].
1.2 DSMACC模拟
DSMACC(The Dynamical Simple Model of Atmospheric Chemical Complexity)是一种常用的箱型模式(https://github.com/barronh/DSMACC),可用于研究臭氧及其前体物之间的联系.
采用DSMACC模型模拟武汉地区不同VOCs和NO浓度下臭氧的光化学生成情况,以表征O3-VOC-NO反应系统的非线性特征.时间设置为中午(12:00~13:00,臭氧生成效率和臭氧浓度在一天中都是最高的时段[42]),天气条件设定为晴空.气象输入和污染物初始浓度根据观测的平均值设置.
1.3 PMF模型
正矩阵分解(PMF)模型是美国环保署(USEPA)官方推荐的源解析技术方法,它被广泛应用于VOCs源解析[43-44].它可以对数据产生更好的拟合,更好的描述污染物的来源[45-46].PMF模型将受体样本矩阵(×)分解为贡献矩阵(×)和因子矩阵(×),并使用多次迭代算法使目标函数Q最小化,进而确定最优解析结果,计算公式如下:

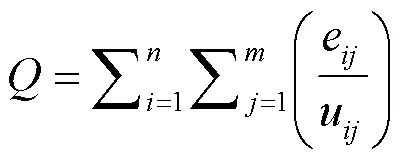
式中:x表示第个样本中第个物质的质量浓度,单位mg/m3;g表示第个来源对第个样本的贡献率;f表示第个排放源中第个物质的质量分数;为排放源的种类数;为需要解析的因子数;e表示第个样本中第个物质的残差;和分别表示样本数和被测物质数;u表示第个样本中第个物质的不确定度;Q是基于样品监测误差的目标函数.
PMF通过最小二乘法来确定污染源类型及其贡献,并且对污染源类型及其贡献具有非负的限制.一般由误差比例和方法检出限来确定物种的不确定度.通常物质的浓度低于或等于检出限时,用公式(3)计算;物种的浓度高于检出限时,用公式(4)计算:
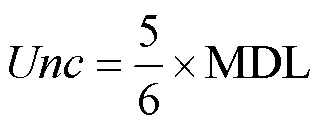
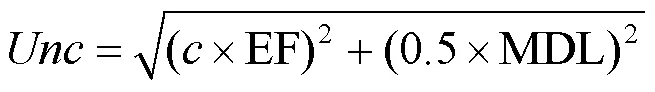
式中:U为物种的不确定性;MDL为物种的检出限;为物种的质量浓度,mg/m3;EF为误差分数,本研究中取20%.
本文中,并非所有被测量的物种都输入到PMF模型中,而是按照以下方法来选择适当的VOCs物种:(1)保留高相关性物质;(2)保留能表征挥发性有机化合物来源的物质;(3)保留高于检出限50%的物质[47-48].
1.4 臭氧生成潜势
臭氧生成潜势(OFP)是衡量VOCs的反应活性及对臭氧影响的重要指标,能分析形成臭氧的优势成分.其计算公式为:
OFP= VOC× MIR(5)
式中:OFP是某个VOCs物质的臭氧生成潜势; VOC是该VOCs物质的浓度;MIR是该VOCs物质的反应性,数值选择参考前人研究[49].
本文计算源解析后各因子的臭氧生成潜势.其计算公式[43]为:

式中:g为第个源在第个样本中的贡献率;f为第个源中第种的浓度.
2 结果与讨论
2.1 军运会期间臭氧及其前体物的变化特征
2.1.1 武汉市臭氧变化情况武汉地区臭氧浓度具有明显的时间变化规律,年际变化呈现上升的趋势;在年内变化上呈现春夏季高于秋冬的特点[4].由图1(a)和图2(a)可知,军运会保障前臭氧MDA8浓度超标,最大浓度为219.51mg/m3;保障期臭氧MDA8浓度明显下降,最大浓度为135.11mg/m3;保障后浓度反弹,最大浓度为140.98mg/m3.保障期较之前的臭氧平均浓度下降34.3%,保障后较保障期臭氧平均浓度上升17.0%.
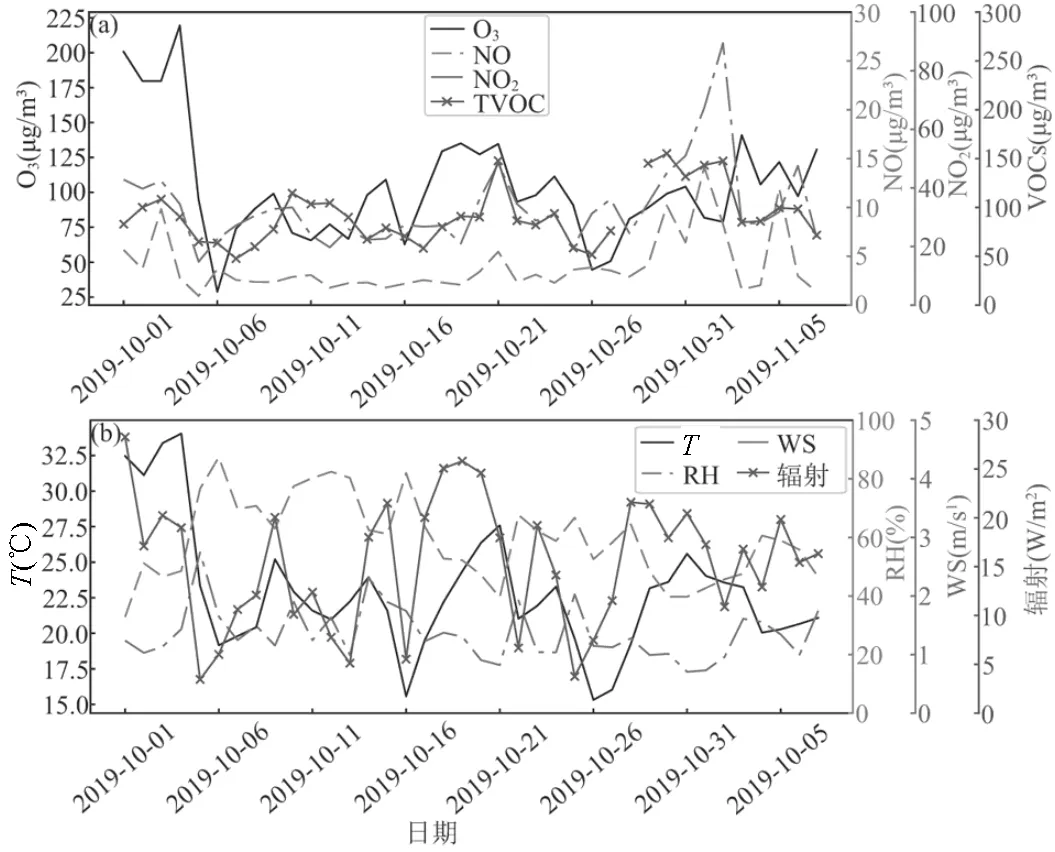
图1 (a)军运会期间臭氧MDA8浓度及其对应时间NOx浓度和TVOC浓度日变化;(b)研究时段温度、相对湿度、风速和辐射日变化
2.1.2 武汉市氮氧化物变化情况由图1(a)和图2(a)可知,保障期NO和NO2浓度相比于保障前变化不大,NO浓度不超过5.48mg/m3,NO2浓度不超过48.32mg/m3.保障后二者浓度有明显的升高趋势,最大浓度分别达到14.14mg/m3和89.45mg/m3,保障后二者总浓度较保障前上升43.2%,保障后NO和NO2出现严重反弹,这可能与飞机等非道路排放源和工业生产有关.军运会后解除了对非道路排放源和工厂的临时措施(http://hbj.wuhan.gov.cn/fbjd_19/zc/ gfxwj/202001/t20200106_560629.html).

图2 (a)军运会保障前中后臭氧、NO、NO2和TVOC浓度的平均值,绿色线段表示标准偏差;(b)军运会保障前中后的温度、相对湿度、风速和辐射的平均值
2.1.3 武汉市TVOC变化情况由图1(a)和图2(a)可知,保障前和保障期VOCs日均浓度变化波动较小,平均值分别为79.70mg/m3和84.49mg/m3.保障后TVOC浓度明显升高,最大浓度达到了155.19mg/m3,平均浓度较保障前上升了47.1%,达到117.23mg/m3.
表1列举了14种标识性的VOCs物质,计算了不同保障时期每种物质的最大和平均浓度.结果显示,除异戊二烯总体浓度变化不大外,其余各VOCs物种(烷烃、烯烃和芳香烃类)在保障前中期浓度差异较小,保障后浓度均有不同程度的升高.
2.1.4 武汉市天气条件变化情况由图1(b)和图2(b)可知,保障前温度明显偏高,最高为34.0℃,平均温度为24.7℃.保障期除21号温度较高达到27.6℃外,其余天温度都较低,平均值为19.4℃.保障后温度较保障期差异较小,最高为25.6℃,平均值为20.0℃.保障前中后相对湿度略有差异,平均值分别为68.4%、72.2%和58.6%;同时,风速都较小(0.70~2.75m/s).辐射的变化波动较大,1号和19号出现最大值,分别为28.21W/m2和25.81W/m2,保障期辐射平均值为8.55W/m2,较保障前(9.52W/m2)和保障后(9.88W/m2)略小.
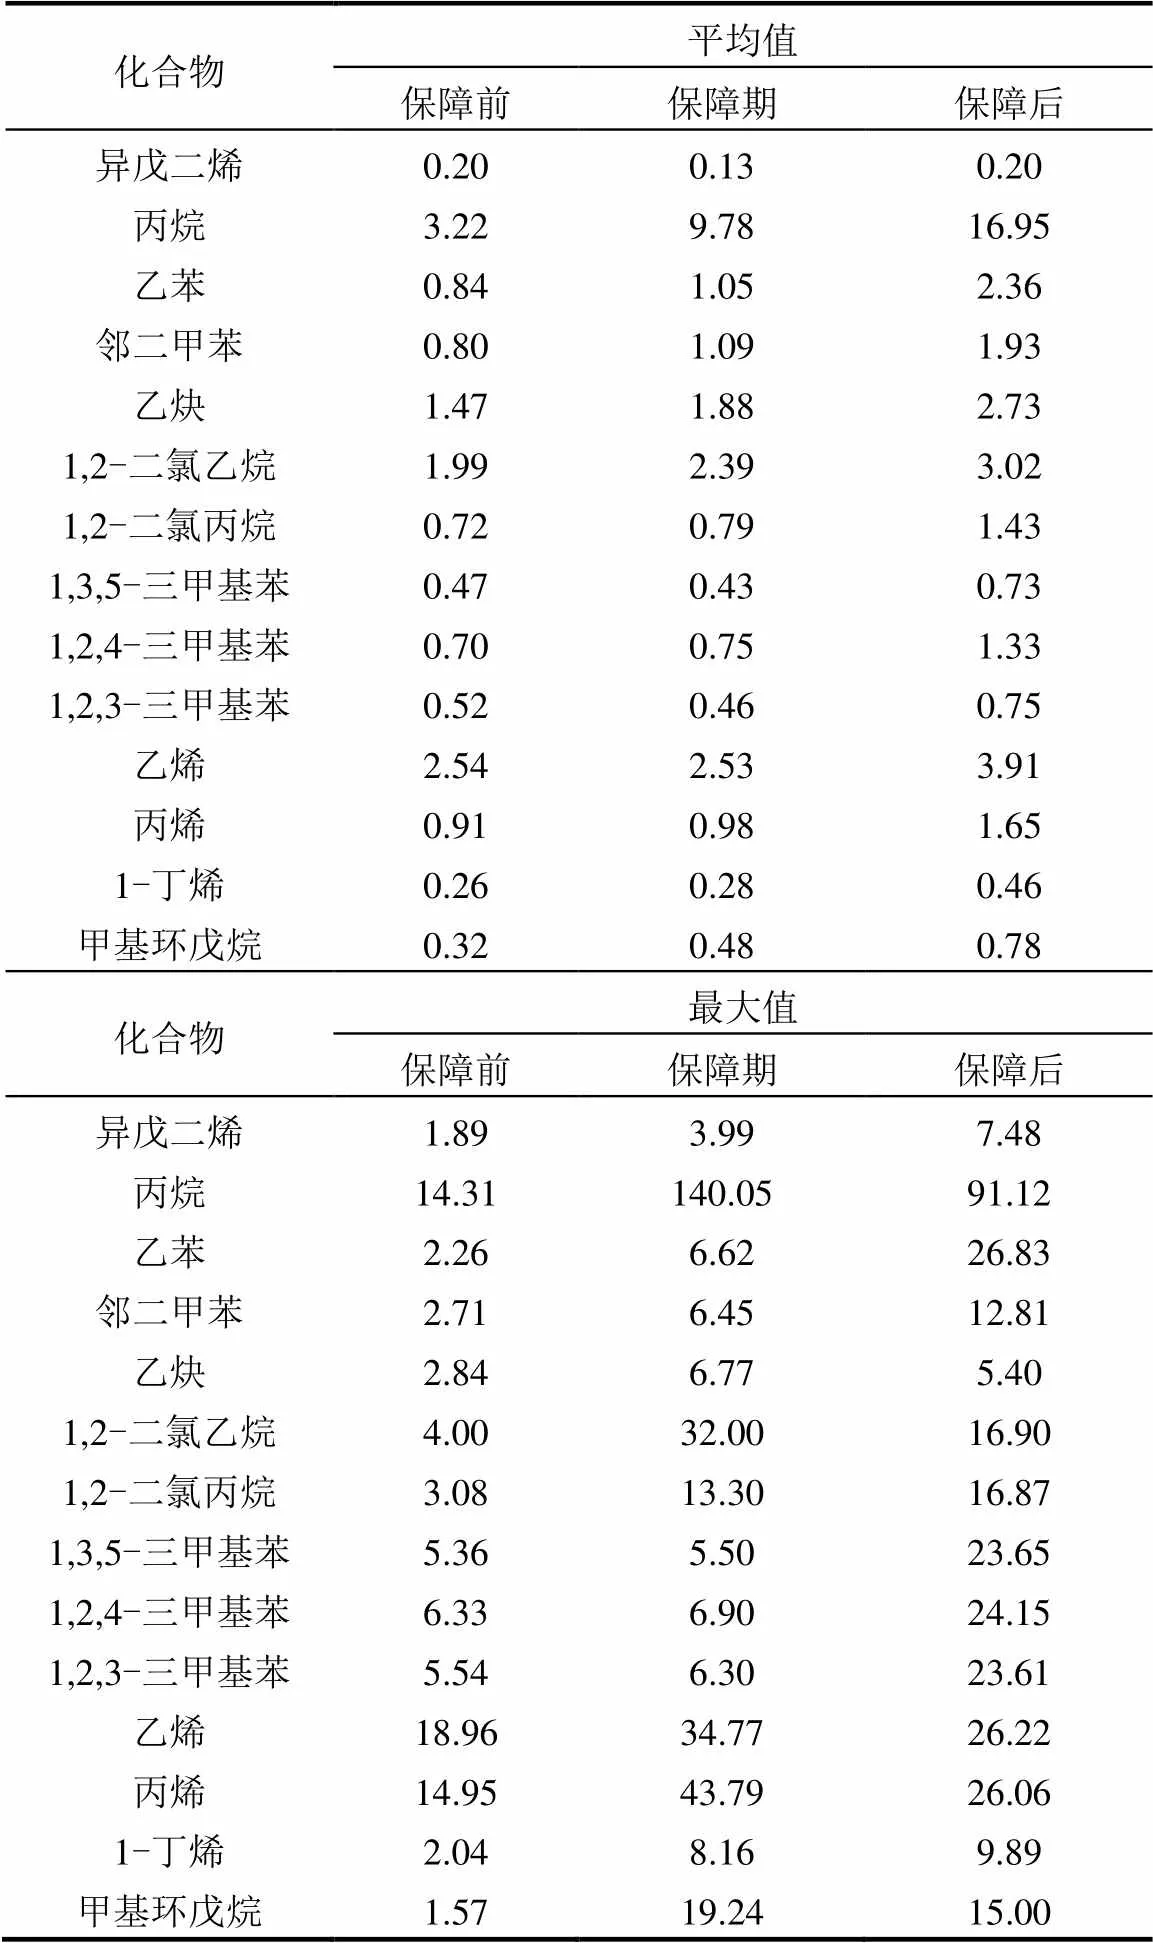
表1 保障前中后部分VOCs的浓度
2.1.5 臭氧与其前体物和天气条件的相关分析由表1可知,保障前臭氧及其前体物相关性不高,相关系数均小于0.10,且都未通过90%的显著性检验,而温度、相对湿度和辐射与臭氧的相关性高,相关系数都大于0.50,且都通过99%的显著性检验.
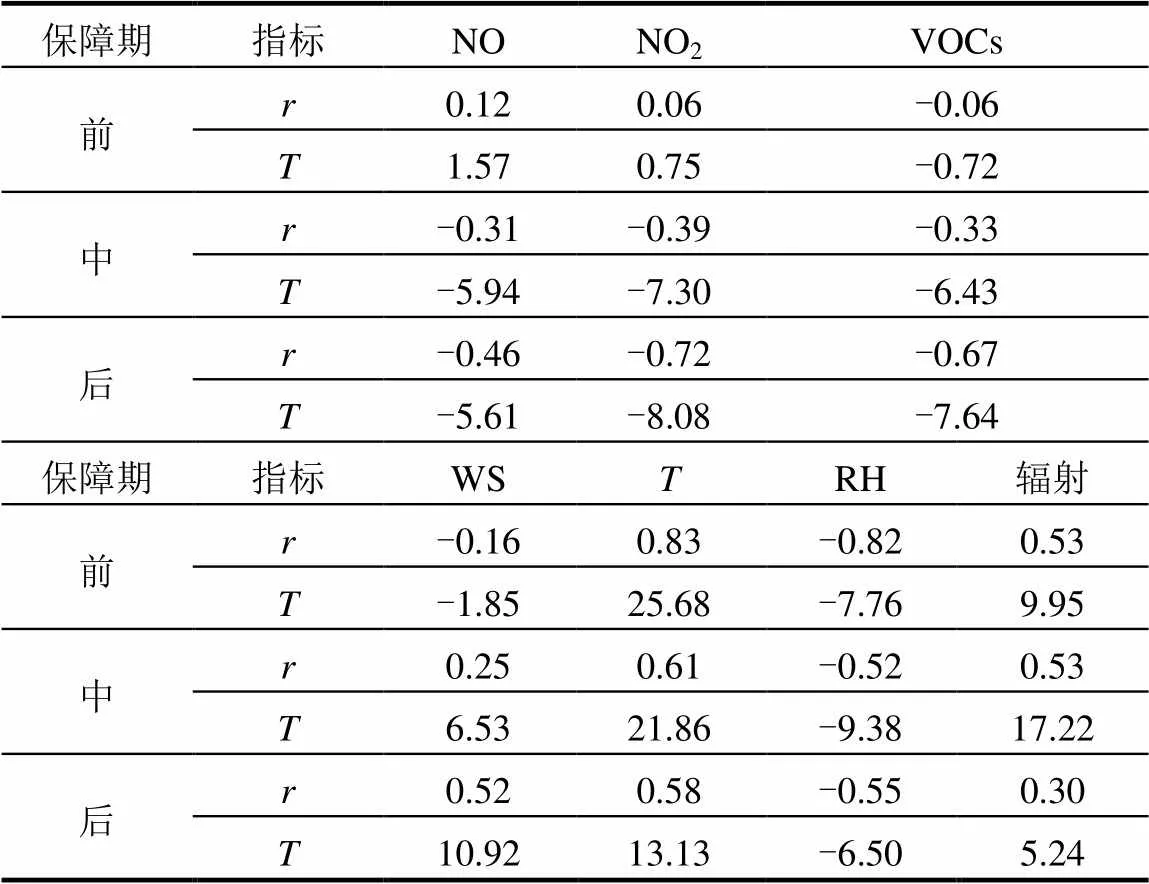
表2 臭氧与其前体物和气象条件的相关性及显著水平
注:为统计量,99%、95%和90%的T临界值分别为2.3,1.7,1.3.
保障期臭氧与前体物的相关性虽明显大于保障前,但相关系数都较小(<0.4),而臭氧与温度和相对湿度的相关性明显减小,相关系数都减小0.20以上.保障后与保障期比,臭氧与其前体物的相关性更大,相关系数都在0.65以上,且都通过99%的显著性检验,而臭氧与温度、相对湿度和辐射相关性比保障前小,相关系数都减小0.2以上.相较于保障后期,保障前中期臭氧浓度变化受天气条件影响更强烈,保障前温度高,辐射强,相对湿度小,有利于臭氧生成.而保障后臭氧增加主要受氮氧化物和VOCs浓度回升的影响,天气条件与保障前差异不大.
2.2 武汉市臭氧光化学生成的敏感性
图3显示了DSMACC模拟的臭氧光化学生成敏感性,其中等值线表示不同前体物(TVOC和NO)浓度下臭氧的生成情况,黑色脊线为最大臭氧形成值的连线,TVOC/NO比率为7.1.黑色圆圈为各阶段白天(8:00~20:00)观测的NO和TVOC小时平均浓度.

图3 (a)~(c)DSMACC模拟的军运会保障前中后的臭氧等值线图;(d)~(f)军运会保障前中后不同时期的TVOC/NOx比值箱型图
由图3可知,保障前TVOC/NO比率在0.6~4.7范围内,保障期TVOC/NO比率在0.2~4.9范围内,保障后TVOC/NO比率在0.4~5.8范围内.保障前中后臭氧生成都处于VOCs控制区,武汉市的臭氧形成主要受VOCs控制.三个时期臭氧的化学生成区间差异不大,说明军运会的管控措施对NO和VOCs的管控力度相差较小,达到了协同减排的效果.
2.3 VOCs源解析及对臭氧生成的贡献
2.3.1 VOCs来源根据EPA PMF5.0对VOCs源解析的计算结果,结合文献中典型VOCs源类的标识成分,最终把污染源归为六类(图4).
因子1主要贡献成分是异戊二烯,异戊二烯是植物光合作用排放的物质[50],因此因子1归为生物源.日变化显示中午2点出现最大峰值,符合植物源排放的日内变化.
因子2主要贡献成分是丙烷,其次是邻二甲苯、间/对二甲苯和乙苯等苯类物质,还有部分高碳烷烃,其中丙烷是天然气的工业加工产物[51],邻二甲苯、间/对二甲苯来自汽车尾气排放[43],乙苯主要用于生产其它化学产品,而高碳烷烃主要来自工业生产[48],这里把因子2归为石油化工.日变化显示夜间污染物浓度高于白天,符合工厂夜间排放高于白天.
因子3主要贡献成分是乙炔、1,2-二氯乙烷、1,2-二氯丙烷等,1,2-二氯乙烷、1,2-二氯丙烷为机动车尾气排放[52],乙炔受机动车尾气、油气挥发、溶剂使用和LPG燃料等影响明显[53],因此因子3归为机动车尾气.日变化中白天的值高于夜间值对应日间机动车使用高于夜间.
因子4主要贡献成分是1,2,4-三甲基苯、1,3,5-三甲基苯、1,2,3-三甲基苯、1,3-二乙基苯、1,4-二乙基苯,这些物质都与溶剂的使用有关[48][54],因此把因子4归为溶剂使用.溶剂的排放与工业密切相关,在夜间出现峰值.
因子5主要贡献成分是乙烯、丙烯、1-丁烯,烯烃的主要来源为机动车排放、煤与生物质燃烧、石化工业排放[55],其中丙烯是燃烧过程中排放的主要物质[56],因此把因子5归为燃烧源.日变化对应早上8点和晚上22点有峰值,最低值出现在下午16点.
因子6主要贡献成分主要是甲基环戊烷和大量的C4~C6烷烃,甲基戊烷既是工业合成的原料,也来自于汽油车尾气[57-58],C5烷烃是汽油挥发的重要组成物质[58],本文把因子6归为燃料挥发.日变化显示夜间高于白天,这符合11:00后由于光化学反应的消耗浓度降低,到18:00光化学反应减弱,浓度升高.
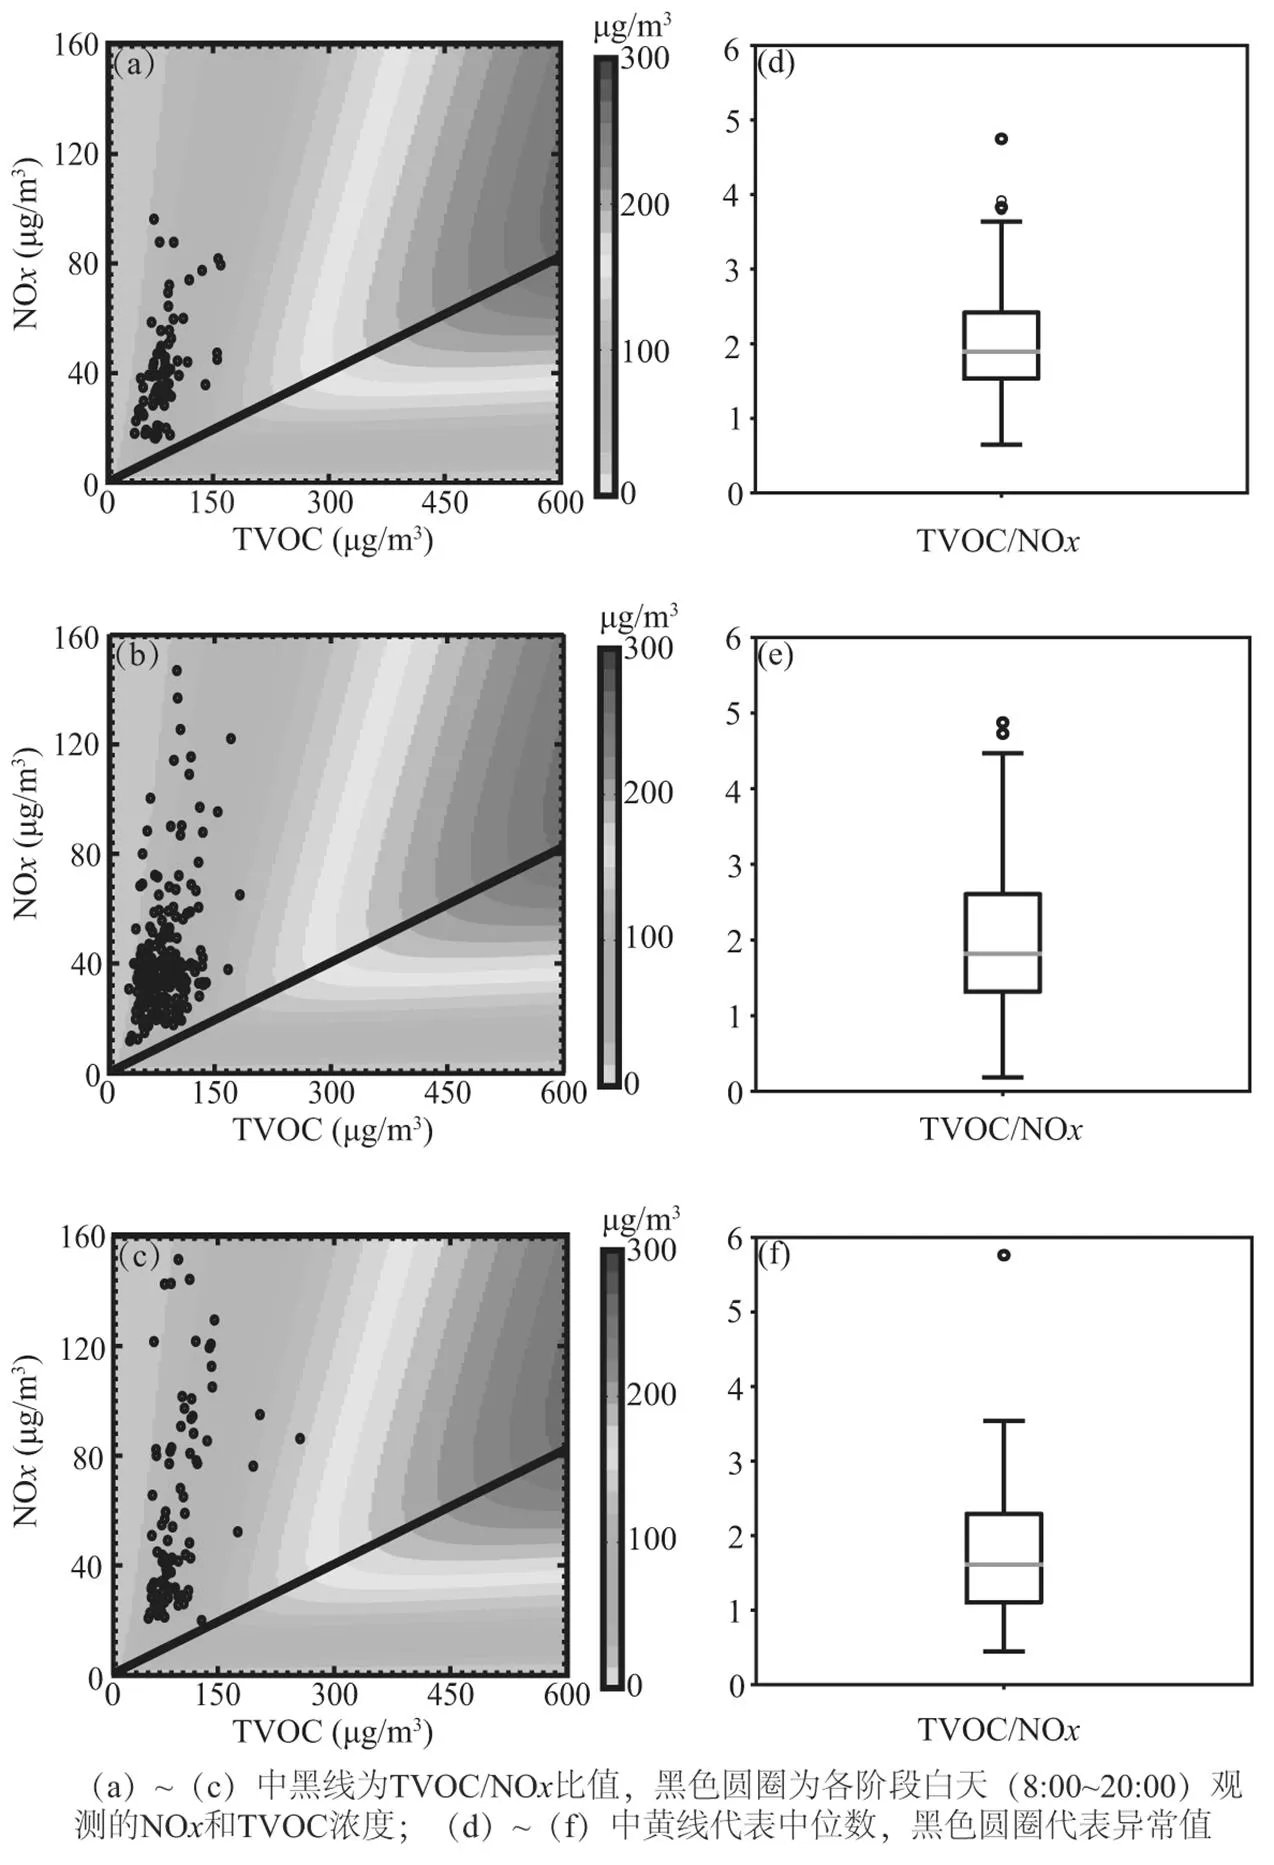
图4 PMF源解析的结果,(a)~(f)为40种VOCs物质对不同因子的贡献率;(g)~(l)为各因子浓度的日内变化
如图5(a)~(c)所示,保障前对武汉市VOCs贡献最大的源是机动车排放,贡献率为29.7% (11.26mg/ m3),其次是石油化工22.1%(8.37mg/m3),燃料挥发、燃烧源、溶剂和生物源分别为13.7%、11.7%、11.6%和11.1%(5.18、4.44、4.39和4.21mg/m3).保障期较保障前机动车排放(40.0%)和燃烧源(17.1%)贡献率有所增加,其中机动车贡献率增加最为显著,增加10.3%,燃烧源增加5.4%,而石油化工(17.6%)和燃料挥发(7.3%)分别减少4.5%和6.4%,溶剂使用和生物源减少不明显,其贡献率分别为8.4%和9.6%(3.72和4.24mg/m3).保障后石油化工的贡献率最大(30.4%),其次是燃料挥发(25.3%)和机动车排放(25.2%),溶剂、燃烧源和生物源贡献率分别为7.1%、6.5%和5.6%(4.94、4.57和3.89mg/m3),较保障期石油化工和燃料挥发贡献率显著增加,机动车贡献率虽有明显下降,但总体占比依然较大.

图5 (a)~(c)军运会保障前中后,各类源对VOCs浓度的贡献率;(d)~(f)各类源的臭氧生成潜势
2.3.2 臭氧生成潜势如图5(d)~(f)所示,保障前燃烧源对OFP贡献最大,贡献率为23.0%(1.02mg/m3),其次是石油化工22.8%(1.01mg/m3)和机动车排放22.5%(1.00mg/m3),三者的贡献率相差不大,燃料挥发、溶剂和生物源贡献率分别为11.5%、10.7%和9.5%(0.51、0.48和0.42mg/m3).保障期机动车的贡献率最大,为38.4%(2.16mg/m3),较保障前增加了15.9%,而石油化工为12.7%(0.72mg/m3),较保障前贡献率降低了10.1%,溶剂和燃料挥发的贡献率略有减小,燃烧源和生物源的贡献率变化不大.保障后石油化工和燃料挥发的贡献率显著增大,分别达32.6%和25.7%(3.81和3.00mg/m3),燃烧源的贡献率显著下降,下降到14.1%.总的来说,机动车对臭氧生成的贡献没有明显的减少,保障前中后溶剂使用对OPF的贡献率也没有明显减小的趋势.武汉军运会对燃料挥发和石油化工管控效果明显,对燃烧源和机动车排放的管控效果较弱,但保障后石油化工和燃料挥发反弹严重.
根据前人对2010年上海世博会前后污染物浓度变化和来源解析研究表明[59-61],世博会期间氮氧化物得到了有效的控制,但后期由于天气和治理力度不足等原因出现反弹,且治理方案对臭氧的减排效果不明显.对来源的解析表明,汽车尾气是重点需要关注的.这与本研究的结果类似,需要制定长期的管控方案,加强对机动车的管控.
3 结论
3.1 军运会保障前臭氧日最大8h浓度(最大MDA8: 219.51mg/m3)超过国家二级标准,保障期臭氧MDA8浓度(135.11mg/m3)明显下降,保障后浓度回升(140.98mg/m3).军运会保障前和保障期臭氧浓度的差异受气象条件影响更明显,而保障后臭氧浓度的上升主要是因为前体物浓度的大幅增加.
3.2 根据DSMACC模拟的EKMA曲线,武汉市军运会期间TVOC/NO比值都在7.1以下,属于VOCs控制区,臭氧的光化学生成主要受VOCs浓度变化的影响.
3.3 VOCs源解析结果显示,保障前VOCs对臭氧生成贡献较大的源类是燃烧源、石油化工和机动车,分别占23.0%、22.8%和22.5%;保障期间VOCs的主要来源是机动车(38.4%)和燃烧源(25.5%);保障后则主要是石油化工(32.6%)和燃料挥发(25.7%).三个阶段对比发现,军运会的保障方案对石油化工源减排效果明显,但对机动车和燃烧源排放的限制效果并不明显.
[1] Kan H, Chen R, Tong S. Ambient air pollution, climate change, and population health in China [J]. Environment International, 2012,42: 10-19.
[2] Cheng L, Wang S, Gong Z, et al. Regionalization based on spatial and seasonal variation in ground-level ozone concentrations across China [J]. Journal of environmental sciences (China), 2018,67(5):179-190.
[3] Liu H, Liu J, Liu Y, et al. Spatiotemporal variability and driving factors of ground-level summertime ozone pollution over eastern China [J]. Atmospheric Environment, 2021,265:118686.
[4] 杨 喆,赵锦慧,刘玉青,等.武汉市臭氧时空分布及环境变量影响分析[J]. 湖北大学学报(自然科学版), 2021,43(5):522-528.
Yang Z, Zhao J, Liu Y, et al. Analysis of the temporal and spatial distribution of ozone and the influence of environmental variables in Wuhan [J]. Journal of Hubei University (Natural Science), 2021,43(5): 522-528.
[5] Li K, Jacob D J, Liao H, et al. Anthropogenic drivers of 2013~2017 trends in summer surface ozone in China [J]. Proceedings of the National Academy of Sciences of the United States of America, 2019,116(2):422-427.
[6] Wang Y, Gao W, Wang S, et al. Contrasting trends of PM2.5and surface-ozone concentrations in China from 2013 to 2017 [J]. National Science Review, 2020,7(8):1331-1339.
[7] Chen S, Wang H, Lu K, et al. The trend of surface ozone in Beijing from 2013 to 2019: Indications of the persisting strong atmospheric oxidation capacity [J]. Atmospheric Environment, 2020,242:117801.
[8] 严 刚,薛文博,雷 宇,等.我国臭氧污染形势分析及防控对策建议[J]. 环境保护, 2020,48(15):15-19.
Yan G, Xue W, Lei Y, et al. Situation and control measures of ozone pollution in China [J]. Environmental Protection, 2020,48(15):15-19.
[9] Anon. Cleaner air for China [J]. Nature Geoscience, 2019,12(7),doi:10. 1038/s41561-019-0406-7.
[10] Tian H, Ren W, Tao B, et al. Climate extremes and ozone pollution: a growing threat to China's food security [J]. Ecosystem Health and Sustainability, 2016,2(1),e01203.
[11] Tai A P K, Matin V M, Heald L C. Threat to future global food security from climate change and ozone air pollution [J]. Nature Climate Change, 2014,4(9):817-821.
[12] Emberson L. Effects of ozone on agriculture, forests and grasslands [J]. Philosophical Transactions of the Royal Society A, 2020,378(2183): 20190327.
[13] Monks P S, Archibald A T, Colette A, et al. Tropospheric ozone and its precursors from the urban to the global scale from air quality to short-lived climate forcer [J]. Atmospheric Chemistry and Physics, 2015,15(15):8889-8973.
[14] Anenberg S C, Schwartz J, Shindell D, et al. Global Air Quality and Health Co-benefits of Mitigating Near-Term Climate Change through Methane and Black Carbon Emission Controls [J]. Environmental Health Perspectives, 2012,120(6):831-839.
[15] Lu X, Hong J, Zhang L, et al. Severe surface ozone pollution in China: a global perspective [J]. Environ. Sci. Technol. Lett., 2018,5(8):487- 494.
[16] Shen L, Jacob D J, Liu X, et al. An evaluation of the ability of the Ozone Monitoring Instrument (OMI) to observe boundary layer ozone pollution across China: application to 2005~2017 ozone trends [J]. Atmospheric Chemistry and Physics, 2019,19(9):6551-6560.
[17] Shao M, Lu S, Liu Y, et al. Volatile organic compounds measured in summer in Beijing and their role in ground-level ozone formation [J]. Journal of Geophysical Research, 2009,114(7),D00G06.
[18] Lu K, Zhang Y, Su H, et al. Oxidant (O3+NO2) production processes and formation regimes in Beijing [J]. Journal of Geophysical Research, 2010,115:1-18.
[19] Ran L, Zhao C, Xu W, et al. VOC reactivity and its effect on ozone production during the HaChi summer campaign [J]. Atmospheric Chemistry and Physics, 2011,11(10):4657-4667.
[20] Li L, Chen C, Huang C, et al. Process analysis of regional ozone formation over the Yangtze River Delta, China using the Community Multi-scale Air Quality modeling system [J]. Atmospheric Chemistry and Physics, 2012,12(22):10971-10987.
[21] Liu Z, Wang Y, Gu D, et al. Summertime photochemistry during CAREBeijing-2007: ROxbudgets and O3formation [J]. Atmospheric Chemistry and Physics, 2012,12(16):7737-7752.
[22] Ma J, Xu X, Zhao C, et al. A review of atmospheric chemistry research in China: Photochemical smog, haze pollution, and gas-aerosol interactions [J]. Advances in atmospheric sciences, 2012,29(5):1006- 1026.
[23] Xue L, Wang T, Gao J, et al. Ground-level ozone in four Chinese cities: Precursors, regional transport and heterogeneous processes [J]. Atmospheric Chemistry and Physics, 2014,14(23):13175-13188.
[24] Wang T, Xue L, Brimblecombe P, et al. Ozone pollution in China: A review of concentrations, meteorological influences, chemical precursors, and effects [J]. Sci Total Environ, 2017,575:1582-1596.
[25] Tang G, Wang Y, Li X, et al. Spatial-temporal variations in surface ozone in Northern China as observed during 2009~2010 and possible implications for future air quality control strategies [J]. Atmospheric Chemistry and Physics, 2012,12(5):2757-2776.
[26] Ding A, Fu C, Yang X, Sun, et al. Ozone and fine particle in the western Yangtze River Delta: an overview of 1yr data at the SORPES station [J]. Atmospheric Chemistry and Physics, 2013,13(11):5813- 5830.
[27] Wang X, Zhang Y, Hu Y, et al. Process analysis and sensitivity study of regional ozone formation over the Pearl River Delta, China, during the PRIDE-PRD2004 campaign using the Community Multiscale Air Quality modeling system [J].Atmospheric Chemistry and Physics, 2010,10(9):4423-4437.
[28] Guo H, Wanga T, Simpsonb I, et al. Source contributions to ambient VOCs and CO at a rural site in eastern China, Atmospheric Environ, 2004,38(27):4551- 4560.
[29] 蔡长杰,耿福海,俞 琼,等.上海中心城区夏季挥发性有机物(VOCs)的源解析[J]. 环境科学学报, 2010,30(5):926-934.
Cai C, Geng F, Yu Q, et al. Source apportionment of VOCs at city centre of Shanghai in summer [J]. Acta Scientiae Circumstantiae, 2010,30(5):926-934.
[30] Zhang L, Li H, Wu Z, et al. Characteristics of atmospheric volatile organic compounds in urban area of Beijing: Variations, photochemical reactivity and source apportionment [J]. Journal of Environmental Sciences, 2020,95:190-200.
[31] Qin Y, Li J, Gong K, et al. Double high pollution events in the Yangtze River Delta from 2015 to 2019: Characteristics, trends, and meteorological situations [J]. Science of the Total Environment, 2021,792(12):148349.
[32] 洪莹莹,翁佳烽,谭浩波,等.珠江三角洲秋季典型O3污染的气象条件及贡献量化[J]. 中国环境科学, 2021,41(1):1-10.
Hong Y, Weng J, Tan H, et al. Meteorological conditions and contribution quantification of typical ozone pollutionduring autumnin Pearl River Delta [J] China Environmental Science, 2021,41(1):1-10.
[33] 宋梦迪,冯 淼,李 歆,等.成都市臭氧重污染成因与来源解析[J/OL]. 中国环境科学:1-11[2021-10-26].https://doi.org/10.19674/ j.cnki.issn1000-6923.20210923.004.
Song M, Feng M, Li X, et al. Causes and sources of heavy ozone pollution in Chengdu [J/OL]. China Environmental Science: - 11 [2021-10-261] ttps://oiorg/10.19674/j.cnki.issn1000-6923.20210923.004.
[34] Liang B, Yu X, Mi H, et al. Health risk assessment and source apportionment of VOCs inside new vehicle cabins: A case study from Chongqing, China [J]. Atmospheric Pollution Research, 2019,10(5): 1677-1684.
[35] 白永清,祁海霞,刘 琳,等.武汉大气能见度与PM2.5浓度及相对湿度关系的非线性分析及能见度预报[J]. 气象学报, 2016,74(2): 189-199.
Bai Y, Qi H, Liu L, et al. Study on the nonlinear relationship among the visibility, PM2.5concentration and relative humidity in Wuhan and the visibility prediction [J]. Acta Meteorologica Sinica, 2016,74(2): 189-199.
[36] 谭成好,赵天良,崔春光,等.近50年华中地区霾污染的特征[J]. 中国环境科学, 2015,35(8):2272-2280.
Tan C, Zhao T, Cui C, et al. Characteristics of haze pollution over Central China duringthe past 50years [J]. China Environmental Science, 2015,35(8):2272–2280.
[37] 马德栗,李 兰,鞠英芹.湖北省霾日数气候特征及夏季典型霾过程气象因子分析[J]. 环境科学与技术, 2015,v.38(11):148-153.
Ma D, Li L, Ju Y, et al. Climatic characteristics of haze days and analysis of summer haze weather event in Hubei province [J]. Environmental Science &Technology, 2015,v.38(1):148-153.
[38] Yang Y, Liu X, Zheng J, et al. Characteristics of one-year observation of VOCs, NO, and O3at an urban site in Wuhan, China [J]. Journal of Environmental Sciences, 2019,79(5):297-310.
[39] 孙天乐,何凌燕,曾立武,等.2008北京残奥会期间大气黑碳气溶胶污染特征[J]. 中国环境科学, 2012,32(12):2123-2127.
Sun T, He L, Zeng L, et al. Black carbon measurement during Beijing Paralympic Game [J]. China Environmental Science, 2012,32(12): 2123-2127.
[40] 王羽琴,张元勋,张 阳,等.深圳大运会前后大气含碳气溶胶污染特征 [J]. 中国环境科学, 2014,34(8):1972-1978.
Wang Y, Zhang Y, Zhang Y, et al. Characterzation of carbonaceous aerosols during and post-Shenzhen UNIVERSIADE period [J]. China Environmental Science, 2014,34(8):1972-1978.
[41] 周国治,宋冰冰,罗岳平,等.2016年长沙市环境空气质量的“周末效应”及“假日效应” [J]. 中国环境监测, 2018,34(4):68-76.
Zhou G, Song B, Luo Y, et al. Holiday effects on ambient air quality in Changsha during 2016 [J]. Environmental Monitoring of China, 2018, 34(4):68-76.
[42] Yan Y, Zheng H, Kong S, et al.On the local anthropogenic source diversities and transboundary transport for urban agglomeration ozone mitigation [J]. Atmospheric Environment, 2021,245(6):118005.
[43] Zheng H, Kong S, Chen N, et al. Source apportionment of volatile organic compounds: Implications to reactivity, ozone formation, and secondary organic aerosol potential [J]. Atmospheric Research, 2021, 249:105344.
[44] Liu Y, Song M, Liu X, et al. Characterization and sources of volatile organic compounds (VOCs) and their related changes during ozone pollution days in 2016 in Beijing, China [J]. Environmental Pollution, 2020,257:113599.
[45] 郑 玫,张延君,闫才青,等.中国PM2.5来源解析方法综述[J]. 北京大学学报(自然科学版), 2014,50(6):1141-1154.
Zheng M, Zhang Y, Yan C, et al. Review of PM2.5source apportionment methods in China [J]. Acta Scientiarum Naturalium Universitatis Pekinensis, 2014,50(6):1141-1154.
[46] 张延君,郑 玫,蔡 靖,等.PM2.5源解析方法的比较与评述[J]. 科学通报, 2015,60(2):109-121,1-2.
Zhang Y, Zheng M, Cai J, et al. Comparison and overview of PM2.5source apportionment methods [J]. Chinese Science Bulletin, 2015,60(2):109-121,1-2.
[47] Brown S G, Frankel A, Hafner H R.Source apportionment of VOCs in the Los Angeles area using positive matrix factorization [J]. Atmospheric Environment, 2007,41(2):227-237.
[48] Shao P, An J, Xin J, et al. Source apportionment of VOCs and the contribution to photochemical ozone formation during summer in the typical industrial area in the Yangtze River Delta, China [J]. Atmospheric Research, 2016,176:64-74.
[49] 牛真真,孔少飞,严 沁,等.薪柴和经济作物秸秆燃烧VOCs排放特征[J]. 环境科学, 2020,41(3):1107-1115.
Niu Z, Kong S, Yan Q, et al. Profile characteristics of VOCs from wood and economic crop burning [J]. Environmental Science, 2020, 41(3):1107-1115.
[50] Zhang L, Li H, Wu Z, et al. Characteristics of atmospheric volatile organic compounds in urban area of Beijing: Variations, photochemical reactivity and source apportionment [J]. Journal of Environmental Sciences, 2020,95(9):190-200.
[51] McCarthy M C, Aklilu Y, Brown S G, et al. Source apportionment of volatile organic compounds measured in Edmonton, Alberta [J]. Atmospheric Environment, 2013,81:504-516.
[52] 齐一谨,史来文,陈绍鹏,等.郑州市金水区夏季VOCs污染特征、来源及风险评估[J]. 河南科学, 2021,39(9):1504-1512.
Qi Y, Shi L, Chen S, et al. Pollution characteristic, source apportionment and risk assessment of volatile organic compounds from Jinshui district of Zhengzhou city in summer [J]. Henan Science, 2021,39(9):1504-1512.
[53] 王成辉,陈军辉,韩 丽,等.成都市城区大气VOCs季节污染特征及来源解析 [J]. 环境科学, 2020,41(9):3951-3960.
Wang C, Chen J, Han L, et al. Seasonal pollution characteristics and analysis of the sources of atmospheric VOCs in Chengdu urban area [J]. Environmental Science, 2020,41(9):3951-3960.
[54] Ou J, Guo H, Zheng J, et al. Concentrations and sources of non- methane hydrocarbons (NMHCs) from 2005 to 2013 in Hongkong: A multi-year real-time data analysis [J]. Atmospheric Environment, 2015,103:196-206.
[55] Shen L, Xiang P, Liang S, et al. Sources profiles of volatile organic compounds (VOCs) measured in a typical industrial process in Wuhan, Central China [J]. Atmosphere, 2018,9(8):297.
[56] Liu Y, Shao M, Fu L, et al. Source profiles of volatile organic compounds (VOCs) measured in China: Part I [J]. Atmospheric Environment, 2008,42(25):6247-6260.
[57] Sun J, Wu F, Hu B, et al. VOC characteristics, emissions and contributions to SOA formation during hazy episodes [J]. Atmospheric Environment, 2016,141:560-570.
[58] Liu C, Ma Z, Mu Y, et al. The levels, variation characteristics, and sources of atmospheric non-methane hydrocarbon compounds during wintertime in Beijing, China [J]. Atmospheric Chemistry and Physics, 2017,17(17):10633-10649.
[59] 黄嫣旻,魏海萍,段玉森,等.上海世博会环境空气质量状况和原因分析 [J]. 中国环境监测, 2013,29(5):58-63.
Huang Y, Wei H, Duan Y, et al. Ambient air quality status and reason analysis of Shanghai World Expo [J] Environmental Monitoring of China, 2013,29(5):58-63.
[60] Huang K, Zhuang G, Lin Y, et al. How to improve the air quality over megacities in China: pollution characterization and source analysis in Shanghai before, during, and after the 2010 World Expo [J]. Atmospheric Chemistry and Physics, 2013,13(12):5927-5942.
[61] Li Y, Xu H. Assessment of reductions in emission-driven air pollution during the Beijing Olympic Games, Shanghai World Expo, Guangzhou Asian Games and Wuhan COVID-19 Lockdown [J]. Aerosol and Air Quality Research, 2021,21(9),https://doi.org/10.4209/ aaqr.200644.
Characteristics and sources of ozone and its precursors aroundthe Wuhan Military Games.
MA Jing1, YAN Ying-ying1*, KONG Shao-fei1,2, SONG Ai-li1, CHEN Nan2,3, ZHU Bo2,3, QUAN Ji-hong2,3, QI Shi-hua1,2
(1.School of Environmental Studies, China University ofGeosciences, Wuhan 430074, China;2.Atmospheric Combined Pollution Research Center of Hubei, Wuhan 430074, China;3.Environmental Monitoring Central Station in Hubei Province, Wuhan 430072, China)., 2022,42(7):3023~3032
The hourly data of ozone, NO(= NO + NO2) and VOCs (102species) during October~November 2019 provided by Hubei Superstationwere used to analyze the variation characteristics of ozone pollutionduring the Wuhan Military Games (WMG). The photochemical regime of ozone was simulated based on DSMACC box model. The source apportionment of VOCs was conducted by PMF model, and the ozone formation potential of different VOCs sourcewas estimated. The results showed that the maximum daily 8-hour average ozone concentration (maximum MDA8:219.51mg/m3) exceeded the national level II standard before the military games. The MDA8 values (135.11mg/m3on average) decreased significantly during the military games, and the concentrations (140.98mg/m3) rise after the WMG. The difference of ozone before and during the military games was mainly affected by meteorological conditions, and the increase of ozone after the WMG was mainly due to the significant increase of precursor emissions. The EKMA curve indicates that the photochemical formation of ozone was controlled by a VOC-limited regime during the study period. The VOCssources that contribute greatly to ozone formation before the military games were combustion, petrochemical industry and motor vehicles, accounting for 23.0%, 22.8% and 22.5%, respectively. The main sources of VOCs during the military games were motor vehicles (38.4%) and combustion (25.5%). While petrochemical industry (32.6%) and fuel volatilization (25.7%)were the main sources after the WMG. The results showed that the prevention strategies of the military games had a significant effect on the emission reduction of petrochemical industry, but the emission mitigation of motor vehicles and combustion was not significant. Wuhan should pay more attention to the control of combustion, fuel volatilization and motor vehicle emissions.
ozone pollution;Wuhan Military Games;VOCs source apportionment;EKMA curve
X511
A
1000-6923(2022)07-3023-10
马 静(1998-),男,四川南充人,中国地质大学(武汉),硕士研究生,主要从事对流层臭氧污染研究.
2021-12-01
国家重点研发计划(2017YFC0212602);国家自然科学基金资助项目(41905112)
* 责任作者, 副教授, yanyingying@cug.edu.cn