Control of flow separation over a wing model with plasma synthetic jets
2022-07-13ZhiSU苏志GuozhengSONG宋国正HaohuaZONG宗豪华HuaLIANG梁华JunLI李军LikeXIE谢理科XuechengLIU刘雪城andWeiliangKONG孔维良
Zhi SU (苏志),Guozheng SONG (宋国正),Haohua ZONG (宗豪华),Hua LIANG (梁华),∗,Jun LI (李军),Like XIE (谢理科),Xuecheng LIU (刘雪城) and Weiliang KONG (孔维良)
1 Science and Technology on Plasma Dynamics Laboratory,Air Force Engineering University,Xi’an 710038,People’s Republic of China
2 Institute of Aero-Engine,School of Mechanical Engineering,Xi’an Jiaotong University,Xi’an 710049,People’s Republic of China
3 The Green Aerotechnics Research Institute of Chongqing Jiaotong University,Chongqing 404100,People’s Republic of China
Abstract An array of 30 plasma synthetic jet actuators(PSJAs)is deployed using a modified multichannel discharge circuit to suppress the flow separation over a straight-wing model.The lift and drag of the wing model are measured by a force balance,and the velocity fields over the suction surface are captured by a particle imaging velocimetry system.Results show that the flow separation of the straight wing originates from the middle of the model and expands towards the wingtips as the angle of attack increases.The flow separation can be suppressed effectively by the PSJAs array.The best flow control effect is achieved at a dimensionless discharge frequency of F+=1,with the peak lift coefficient increased by 10.5%and the stall angle postponed by 2°.To further optimize the power consumption of the PSJAs,the influence of the density of PSJAs on the flow control effect is investigated.A threshold of the density exits (with the spanwise spacing of PSJAs being 0.2 times of the chord length in the current research),below which the flow control effect starts to deteriorate remarkably.In addition,for comparison purposes,a dielectric barrier discharge (DBD) plasma actuator is installed at the same location of the PSJAs.At the same power consumption,4.9% increase of the peak lift coefficient is achieved by DBD,while that achieved by PSJAs reaches 5.6%.
Keywords: flow separation,plasma synthetic jet,density,dielectric barrier discharge
1.Introduction
Flow separation,generally referring to the phenomenon of boundary layer detached from the wall due to insufficient momentum,seriously deteriorates the aerodynamic performance of aircrafts and causes stall and air crash [1-3].In order to address this issue,various flow control methods have been developed,among which plasma actuators,characterized by simple structure and fast response,demonstrate a great potential [4-13].
The most widely used plasma actuator in flow separation control on airfoils and wings is dielectric barrier discharge(DBD)plasma actuator,which consists of an anode,a cathode and a dielectric layer.Either sinusoidal high-voltage waveform (AC-DBD) or high-voltage nanosecond pulses (ns-DBD)can be adopted to drive the DBD actuator to disturb the separated boundary layer [7].The flow control effect of ACDBD is based on the near-wall momentum entrainment produced by the movement of charged particles in the electric field [4].The maximum Mach number for effective flow separation control by AC-DBD is limited at 0.4 because of the limited velocity of the near-wall jet [O (1 m s−1)] [14].Different from AC-DBD,the fast gas heating accompanied by propagating shock waves generated by ns-DBD is the reason for the suppression of flow separation [8].The ns-DBD has been demonstrated to be capable of suppressing the flow separation at Ma≥0.8,much higher than AC-DBD [15].However,when it comes to the flow separation at the trailing edge of wings,the thickness of the fully developed boundary layer confines the perturbation of DBD in a limited region far from the separated shear layer,making it difficult to achieve effective control.
Plasma synthetic jet actuator (PSJA) [9,16] is a novel type of zero-net-mass-flow actuator proposed by Johns Hopkins University in 2003 for flow control in supersonic condition [17].In PSJA,pulsed arc discharge is placed in a closed cavity with a small orifice.The gas in the cavity is heated by the pulsed arc discharge and expelled from the orifice,producing a high-speed synthetic jet [17-19].Compared with the traditional flow control methods like DBD,PSJA can produce high-speed jet (>400 m s−1) [20] at large frequency bandwidth(>10 kHz)[21],which has been widely used in the applications including shock wave boundary layer interaction (SWBLI) control [22-24],shock wave manipulation,noise mitigation [25].
When it comes to flow separation control in subsonic range,the high-speed jet of the PSJA can produce strong disturbance in large Mach number and Reynolds number,and penetrate the thick boundary layer at the trailing edge of airfoil,which is unable to be achieved by DBD.The wide range of discharge frequency by PSJA also enables optimal frequencies for various cases of flow control.This makes the PSJA a promising device to suppress flow separation at both the leading edge and trailing edge of the wing in large Mach number condition.Besides,to achieve the combined flow control efficacy in both subsonic and supersonic flows using the same device (PSJA) is another reason for exploring the efficacy of PSJA in flow separation control.However,limited by the inability to produce multiple discharge to cover a sufficient range of the wing span with PSJAs,only a few researches concerning flow separation control by PSJA can be found.
In 2003,Caruana et al arranged 20 PSJAs on a NACA 0015 model at 32% chord length downstream from the leading edge at the range of Reynolds number of 6×10⁵<Rec<12×105.Each actuator is driven by a separate circuit,resulting in a complex discharge system.Results demonstrate the ability of PSJAs to reduce trailing-edge separation at moderate angles of attack (AOA,α).A threshold of the discharge frequency exists,above which the control efficacy no longer increases with the increasing frequency [26].In 2017,the multichannel discharge circuit for PSJA is developed by Zhang et al.Multiple discharge channels are built using a single power supply and discharge circuit,which makes the practical application of PSJA in flow separation control of airfoils and wings possible [27,28].In 2018,26 PSJAs were achieved using the multichannel discharge circuit by Zong et al.The PSJAs are embedded in a NACA 0015 airfoil at 8%chord length from the leading edge at Rec=1.7×10⁵and significant flow control effect at large angles of attack is achieved.The stall angle (αstall) of the airfoil is improved by 6.5° and the peak lift coefficient is increased by 21%.The flow separation is suppressed by the sweeps of the spanwise vortices induce by the PSJAs [29].Besides,the flow separation of a modified energy efficient transport airfoil is also suppressed by Su et al using 12 PSJAs driven by the multichannel discharge circuit.The stall angle is improved by 2° and the peak lift coefficient is increased by 5.4% [30].
Although strong perturbation can be produced and impressive flow control effects have been achieved by PSJAs,the efficiency in flow control is the next issue to be concerned for PSJAs.The discharge energy of a single pulse at unit spanwise range produced by PSJAs in [29] reaches 1.13 J m−1,with a vast majority of energy deposited in the capacitive discharge phase,while that of typical ns-DBD is only 0.06 J m−1[15].For practical application,a comparable or better flow control effect is necessary for PSJA when compared with the DBD actuator driven by the same power supply.Besides,further investigation concerning the flow separation control by PSJAs should also be conducted to figure out the influence of different parameters before practical application.
Thus,to optimize the efficiency and provide more information about the rules in flow separation control using PSJAs,in this study,30 PSJAs are embedded at 8% chord length downstream from the leading edge of a straight-wing model and the effects of two critical parameters for the power consumption,i.e.the discharge frequency (f) and actuator spanwise density (Sa),on the flow control performance are investigated in detail using aerodynamic force measurements.Then,particle imaging velocimetry (PIV) tests are conducted to illustrate the flow control mechanism.Finally,the flow control effects by DBD and PSJAs at the same power consumption are investigated for comparison purpose.In section 2,details on the experimental setup are introduced,the force measurement and PIV results are presented in section 3.
2.Experimental setup
2.1.Wind tunnel and straight wing model
Experiments are conducted in the closed-loop wind tunnel at Air Force Engineering University.The wind tunnel has a contraction ratio of 7.84 and a square test section with the width and height of 1.2 m and 1 m,respectively.The range of the freestream velocity is 3-75 m s−1,and the turbulence intensity of the freestream is smaller than 0.2% in the test section.The straight-wing model used in the current research is shown in figure 1,which consists of a straight wing(airfoil profile: NACA 0015) fixed on a cylindrical fuselage.The chord length (c) and span (l) of the wing are 300 mm and 800 mm,respectively,resulting in an aspect ratio of 2.67.Two square grooves are drilled at 8% of the chord length downstream from the leading edge of the wing to make sure the PSJAs be flush mounted in the wing model.In addition,the multichannel discharge circuit is installed inside of the wing model to simplify the experimental system and reduce electronic magnetic interference (EMI).To measure the lift and drag of the wing model at different angles of attack,a sixcomponent force balance is embedded in the cylindrical fuselage of the model and fixed on a scimitar.The scimitar is fixed at an angle adjusting mechanism to adjust the AOA.The measurement load and accuracy of the force balance are listed in table 1.
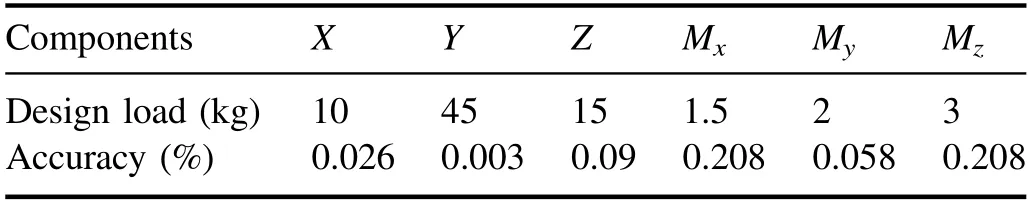
Table 1.Load and accuracy of the six-component force balance.
2.2.Plasma synthetic jet actuator and discharge circuit
As shown in figure 2,the PSJ array is mainly composed of two components,a cover,and a multi-cavity base,both of which are made of poly tetra fluoroethylene (PTFE).Assembly of the cover and cavity is realized by screws (not shown)located at the center of the spacing between every two neighboring jet orifices.In each of the cylindrical cavity(diameter: 6 mm,height: 8 mm),two tungsten needles with a diameter of 1 mm are inserted from the bottom,serving as the anode and cathode,respectively.The spacing between the tips of the two electrodes is fixed at 1 mm.In total,30 independent PSJAs are arranged linearly in the array,and the spacing between adjacent actuators,la,is 20 mm.The actuator spacing,la,is defined as the distance of the center of two neighboring jet orifices.This is reasonable,because if we pick a random point on the first jet orifice,the spanwise distance between the first point and its counterpart on the second jet orifice is identical to la.The jet orifice is in a round shape,whose diameter is 2 mm.
To drive PSJ array using one single power supply,the multichannel discharge circuit proposed by Zhang et al[27,28] is inherited (shown in figure 3),but two modifications are made.First,the high voltage pulses are directly created by a nanosecond pulse power supply with adjustable output parameters (voltage: 0-20 kV,pulse width: 0-1 ms,frequency: 1 Hz-20 kHz),instead of the circuit combining a high-voltage DC power supply with a capacitor.This avoids the energy waste caused by the simple capacitive discharge as the case shown in[29],and enables the precise control of the time when the discharge ignites.Second,an inductor(L=50 mH) is connected prior to the first electrode gap to sustain the pulse current and stabilize the breakdown process.Apart from that,the basic idea to realize multichannel discharge is the same as in [27,28].Namely,capacitors (C1-C29,capacitance: 100 pF) and resistors (R1-R29,resistance: 1 MΩ;power:5 W)are connected in parallel,serving as virtual relays to deliver the high-voltage pulse downstream to break down sequentially the 30 electrode gaps.The time delay between two neighboring discharge channels is within 50 ns [27],which is much smaller than the timescale of flow field evolution.
To measure the discharge voltage and current of the plasma synthetic jet array,a high voltage probe (Tektronix P6015A) and current probe (TCP0030A) are hooked at P1and P2of the discharge circuit,respectively.At a typical setting (pulse rising time: 300 ns,pulse falling time: 300 ns,pulse width:500 ns,voltage amplitude:20 kV),the measured discharge waveforms are shown in figure 3(b).Prior to breakdown,the voltage at P1keeps increasing and reaches a maximum of 24.2 kV,even higher than the output voltage of the power supply,as a result of the effect brought by the inductor L.Immediately after discharge breakdown,the voltage at P1drops rapidly,whereas the current at P2goes up and reaches a maximum of 86 A at t=335 ns.The pulse energy integrated from the product of voltage and current in one period is 265 mJ,being much smaller than that in [29].
2.3.PIV system
The PIV system used to diagnose the response of the separated flow consists of a double pulsed ND: YAG laser (pulse energy: 430 mJ,maximum repetition rate: 30 Hz),a camera(LaVision,Imager Pro X,resolution: 1600×1200),and a synchronization timing unit (LaVision V9),as shown in figure 1(a).The tracer particles (mean diameter: 2 μm) are created by injecting pressurized air through a Laskin nozzle submerged into olive oil.The seeder is located in the settling chamber and upstream of honeycombs to create minimum disturbances to the incoming flow.The camera is mounted with a lens(Nikon AF Nikkor,focus length:50 mm)to image a field of view (FOV) of 467 mm×350 mm,leading to a magnification ratio of 0.151.Image pairs are acquired and processed by LaVision Davis 8.3 software.The size of the interrogation window and the overlapping ratio in the final process are set as 32×32 and 75%,respectively,resulting in a final spatial resolution of 2.3 mm/vector.To prevent the equipment from being interfered or damaged by the strong EMI created by multichannel repetitive arc discharge,the data acquisition computer is placed at approximately 10 m away from the plasma discharge and all the cables are shielded with multiple layers of copper mesh.For each case investigated in this study,83 instantaneous velocity fields are collected at a repetition rate of 10 Hz to get statistically converged quantities.The surface of the wing model is painted to black to reduce laser reflections in PIV measurements.To facilitate the description,actuators in the PSJ array are numbered from left to right,as 1-30.PIV measurements for frequency investigation are conducted in the streamwise plane (x-z plane)right above the jet orifice of the No.8 actuator,which is 190 mm from the wing tip in the left.
3.Results and discussion
When the pulse energy is unchanged,the total power consumed in the flow control solely depends on the number of voltage pulses and the number of actuators used in the experiment,which are further determined by the discharge frequency (f) and spanwise actuator density (Sa),respectively.In order to optimize the discharge frequency and actuator density of the PSJAs for better flow control performance,in this section,the impact of these two parameters is investigated at the freestream velocity of U∞=10 m s−1,which gives a chord-based Reynolds number of Rec=2.02×10⁵.Other parameters,such as the discharge voltage,pulse width,pulse rising/falling time,are kept the same as that in figure 3,unless otherwise noticed.
3.1.Effect of discharge frequency on the flow control performance
Figure 4 shows the lift (CL) and drag (CD) coefficients at increasing angles of attack for both baseline and actuated cases.The dimensionless discharge frequency is defined as F+=fc/U∞.In baseline condition,the wing model stalls at α=14.5°,and the peak lift coefficient is 1.03.Beyond the stall angle,the lift coefficient of the wing model decreases rapidly,and the drag coefficient increases significantly due to the leading-edge flow separation.The slope of the lift coefficient curve is 0.078 degree−1,which is smaller than the value computed from the thin airfoil theory(0.11 degree−1)of the finite-wing theory [31] due to the small aspect ratio and the effect of the fuselage.Prior to stall,the total drag of the wing model is dominated by friction drag and induced drag,thus increasing slowly with the angle of attack increasing.As a comparison,after stall,the flow is separated from the suction surface of the wing model,and the pressure drag dominates and increases rapidly.At the actuated cases,noticeable improvements of the lift coefficient can be found.Particularly,the largest increase in the peak lift coefficient(CL,max)appears at F+=1 with CL,maxincreased by 10.5%and the stall postponed by 2°.At F+>1 ,the pressure drag generated after the wing model stalls is reduced more than the case at F+=1.These observations are consistent with the findings in Caruana et al and Zong et al [26,29].
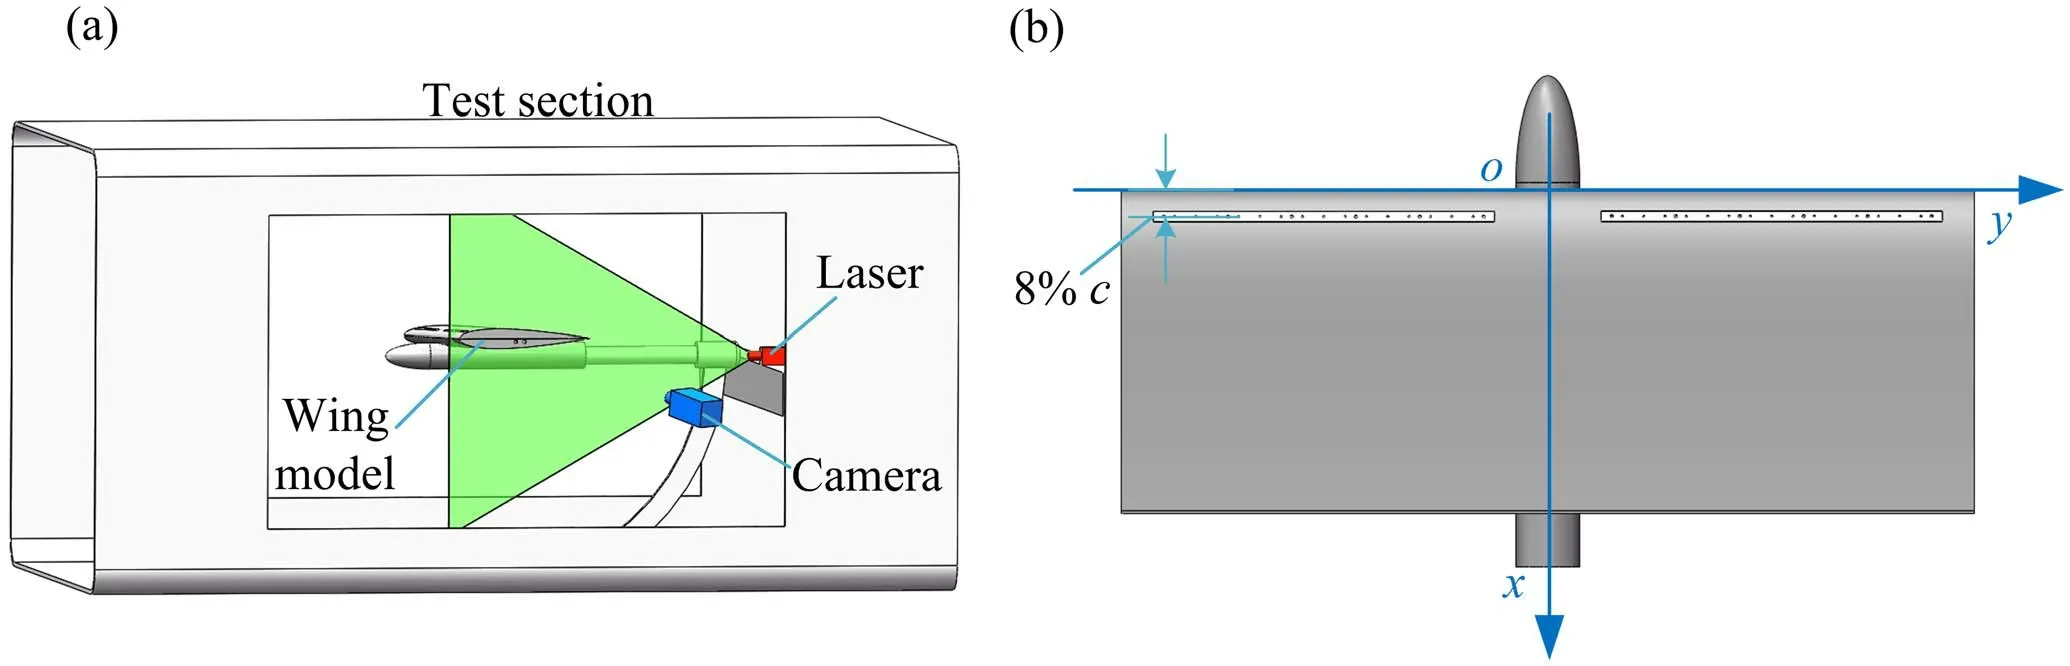
Figure 1.(a) Installation and (b) schematic diagram of the straight-wing model.
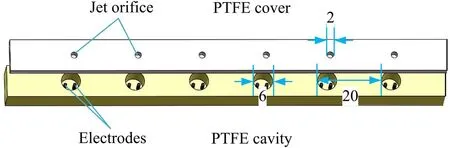
Figure 2.The plasma synthetic jet array (6 in the 30 PSJAs are shown).
Figure 3.(a) Discharge circuit,and (b) voltage and current waveform of the discharge.
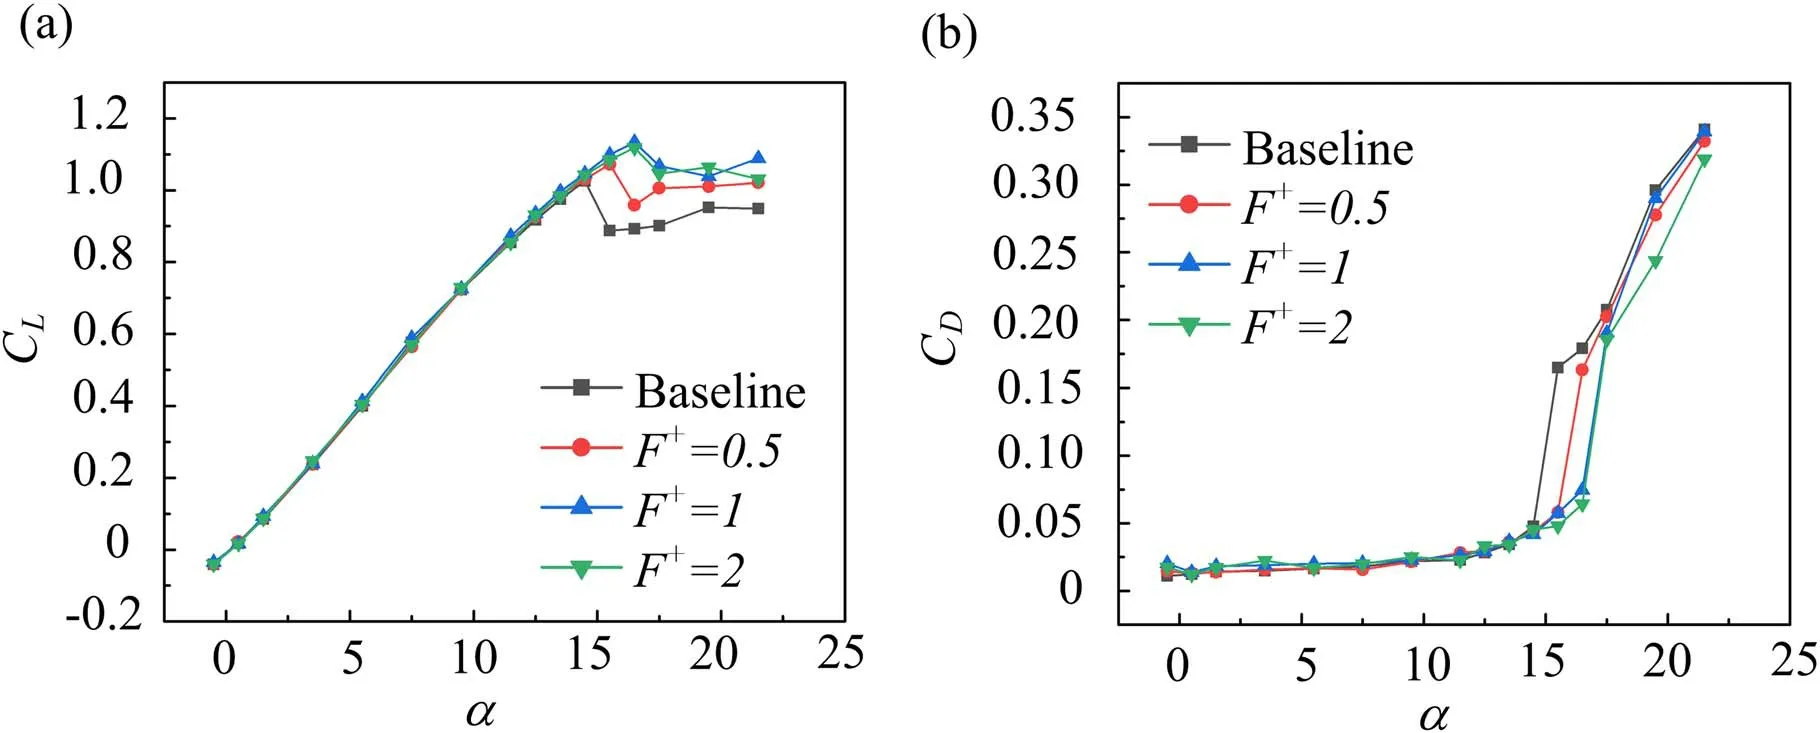
Figure 4.(a) Lift and (b) drag coefficients curves at increasing discharge frequencies.
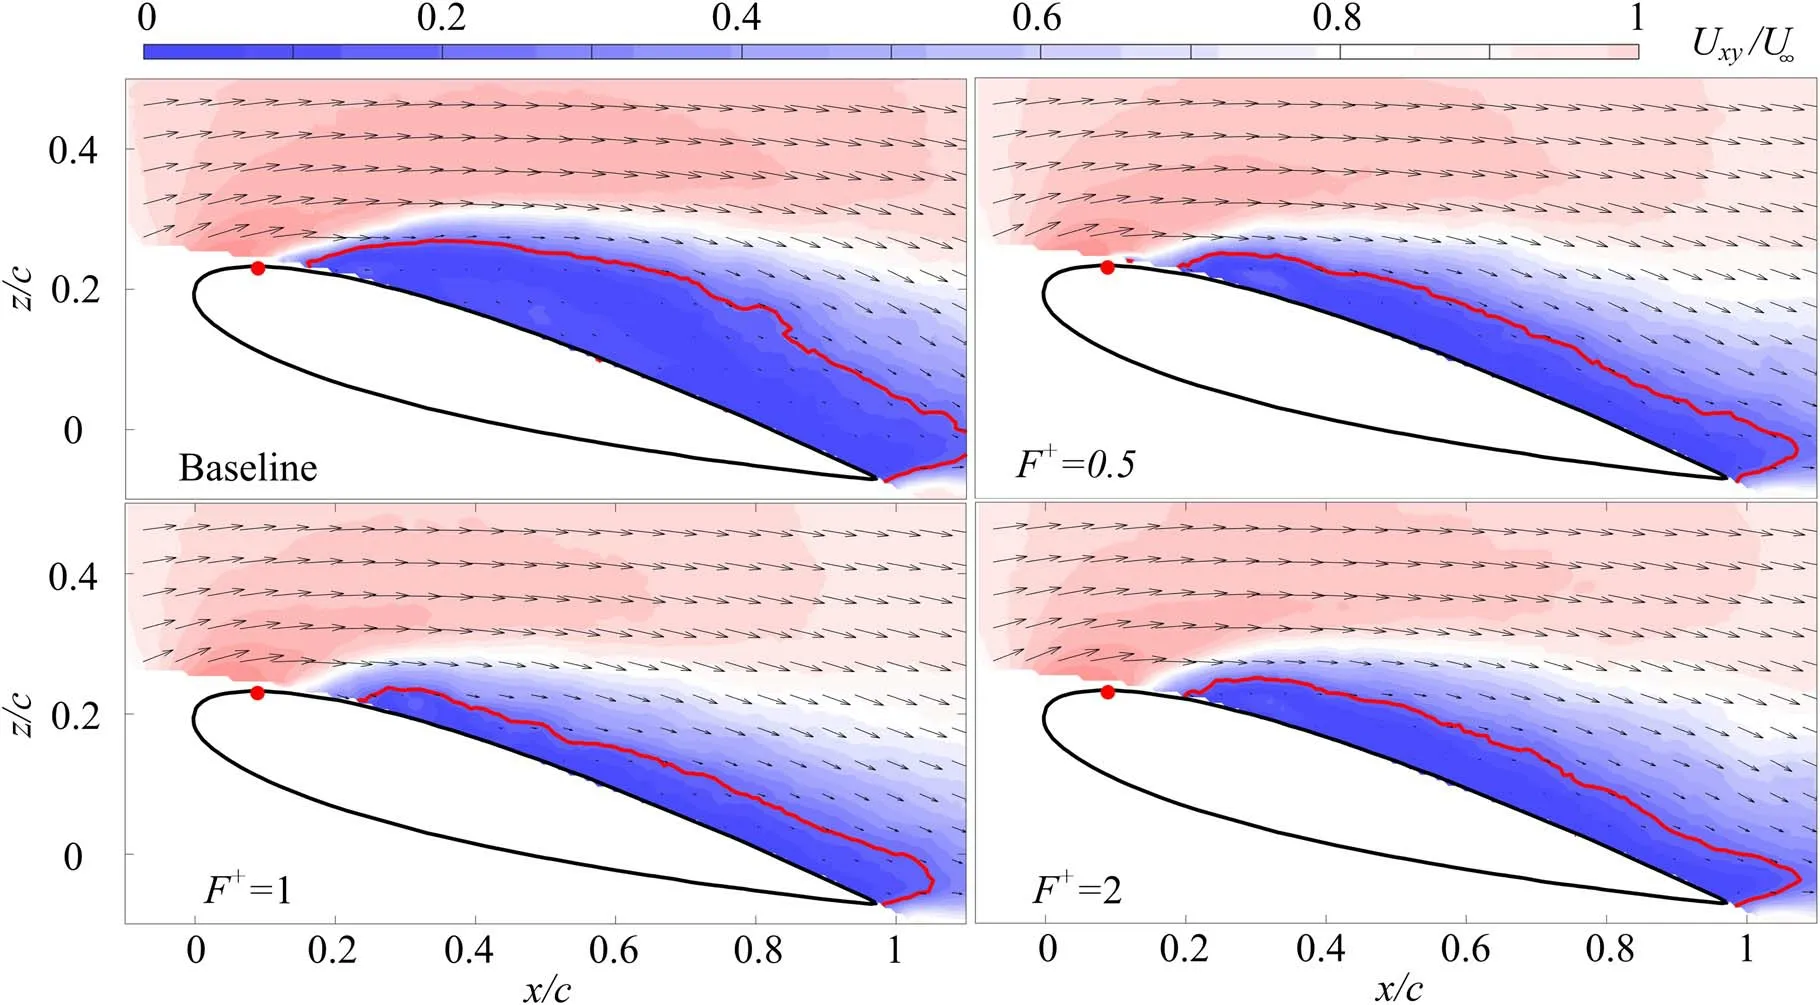
Figure 5.Time-averaged velocity fields obtained at different discharge frequencies; red dots mark the actuation position; solid red lines represent the contour of U=0.2U∞.
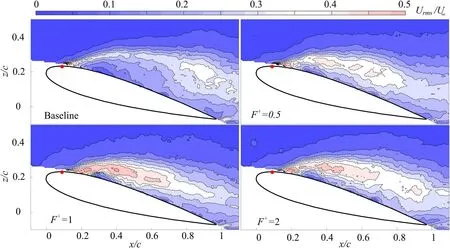
Figure 6.Streamwise velocity fluctuations at different actuation frequencies.
In order to figure out the mechanism behind the phenomenon demonstrated above,the PIV measurement is conducted and the time-averaged velocity fields over the suction side of the wing model at α=15.5° and different discharge frequencies are shown in figure 5.In the baseline condition,leading-edge flow separation is observed in the velocity field,indicated by the separation point(defined as the beginning of the region having negative velocity) near the leading edge.A prominent backflow region exists,where the maximum reverse velocity is 13%U∞.Because when the PSJAs are turned on,the backflow area is so small that significant relative error will be produced in the calculation of backflow area,the area where the velocity is less than 20%of U∞(denoted by the red lines) is used as a metric to estimate the separation zone.Similar to[29],this low-speed area(A)is further normalized by A+=A/c2cos(α),to give a nondimensional area ratio,A+.At a reduced frequency of F+=0,0.5,1 and 2,the nondimensional low-speed area A+is 23.7%,14.1%,10.8%,and 13.7%,respectively.It is evident that,at F+=1,PSJ gives the best performance,demonstrating the smallest A+.The low velocity area is reduced by 55% at the case with F+=1 with respect to the baseline condition.This trend is consistent with the variation of lift coefficients in figure 4.
Figure 6 displays the root-mean-square(rms)value of the streamwise velocity (Urms) computed from the 83 instantaneous samples to represent the velocity fluctuation in the above cases.In the baseline condition,high rms values are observed in the separated shear layer region,which can be associated with the shedding of unsteady vortices,and maximum velocity fluctuations are unexceptionally attained near the separation point.Between the separated shear layer and the suction surface,a low rms level is exhibited,which corresponds to the backflow.When plasma actuation is switched on,rms levels in the separated shear layer region get higher,due to the momentum transport enhanced by PSJ.At F+=1,the streamwise velocity fluctuates most severely,demonstrating the strongest perturbation to the flow field,which is consistent with the above findings with the best flow control effects appear at F+=1.
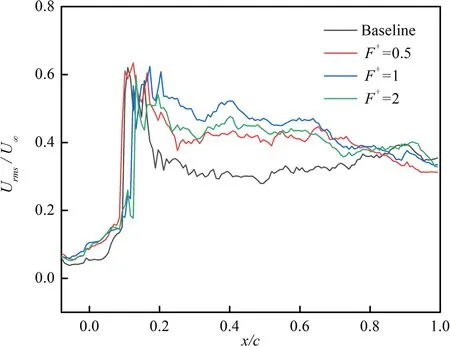
Figure 7.The curve of the maximum value of Urms/U∞with the chordwise position.

Figure 8.Phase-resolved velocity fields at F+ =1.
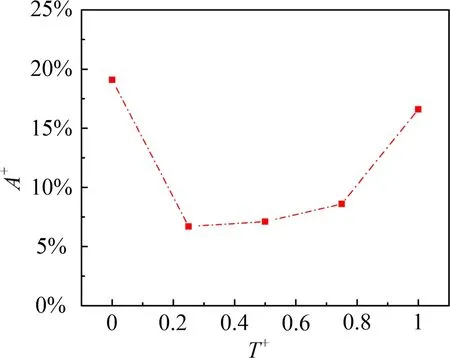
Figure 9.The variation of nondimensional low-speed area with T+.

Figure 10.The separation bubble of (a) the baseline flow field and (b) the flow field with PSJ.
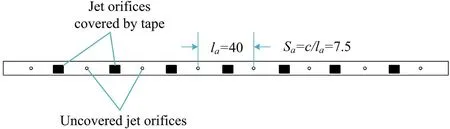
Figure 11.The definition of actuator density.
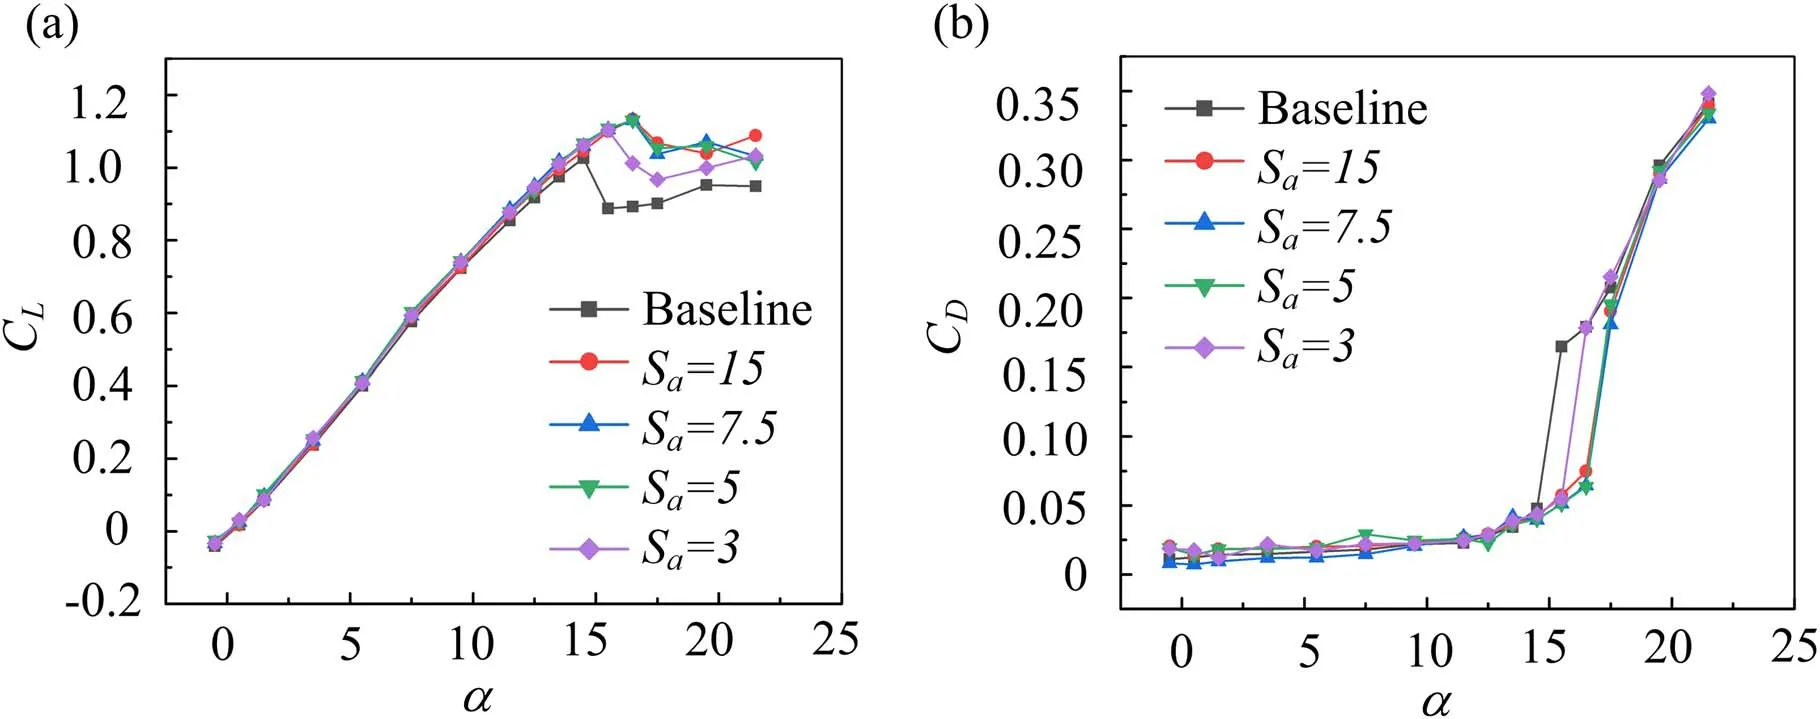
Figure 12.(a) Lift and (b) drag coefficient curves at different actuator densities.
A quantitative comparison of the maximum rms levels at each chordwise position for different actuation frequencies is given by figure 7.In the baseline condition,the peak of the maximum rms curve appears at the location of x/c=0.11,and the curve presents a platform in the range of x/c=0.2-1.0.At F+=0.5,1 and 2,the peaks of the rms curves move downstream,and the locations of the peaks are x/c=0.13,0.18,and 0.14,respectively.Since the occurrence of this peak is associated with the strong shear between freestream and reverse flow,a downstream movement of the peak position indicates that the separation point is pushed downwards by PSJ actuation.In addition,for all the actuated cases,the rms values to the right side of the peak are increased noticeably,indicating that the mixing between the freestream and the shear layer is enhanced ubiquitously.The magnitude of rms increase from x/c=0.2 to 0.8 at F+=1,is greater than those at F+=0.5 and 2,which is consistent with the force measurement results and the results presented by Zong et al[29].Although three-dimensional flow exists on the straight wing,there is still a comparable flow control authority by PSJAs when compared with the two-dimensional case (the case on airfoil).
Previous results pertaining to flow separation control using ns-DBD have shown that mixing enhancement between the freestream and the flow separation region is achieved by creating a train of unsteady spanwise vortices converting along the separated shear layer.This motivates us to analyze the phase-averaged response of the flow separation region to PSJ.Here,the phase is denoted by the time delay after the discharge pulse,t,and further normalized by c/U∞,resulting in a dimensionless convection time,T+=tU∞/c.Four representative phase-resolved velocity fields at F+=1 are shown in figure 8,and the corresponding time variation of the normalized low-speed area (A+) is plotted in figure 9.
In one period,the low-speed area first decreases and then slowly grows.The minimum value is reached at T+=0.25,which is 65% smaller than the baseline.This trend can be attributed to the dynamic sweeping of spanwise vortices.Specifically,in each discharge cycle,a pulse disturbance is produced at the separated shear layer and grows into a spanwise vortex due to Kelvin-Helmholtz instability.This vortex entrains the freestream flow to the separated region,leading to a temporal reduction of the low-speed area and rapid recovery of the lift.As this vortex propagates further downstream,the initially suppressed separation region bounces back,which explains the slow recovery of A+at T+≥0.5 in figure 9.Overall,in time-averaged sense,the lift is increased.
To further illustrate the influence of PSJA to the dynamic separation bubbles,several representative instantaneous flow fields at an angle of attack of 15.5° and a freestream velocity of 10 m s−1are demonstrated in figure 10 to make a further analysis,where the contour represents the total velocity nondimensionalized by the freestream velocity and the backflow region is marked by red lines.It can be seen that,for the baseline condition at the left column,several patches of reverse flow exist on the airfoil surface,which keep developing and flowing downstream,resulting in a bulk flow separation in the timeaveraged sense.When the PSJA is turned on with F+=1(the right column),the size of the backflow region is reduced significantly.Separation bubbles appear at several frames of flow field,which break down and merge into the separation at the trailing edge,forming a small flow separation in the time-averaged sense.
3.2.Effect of actuator density on the flow control performance
In this section,the dimensionless discharge frequency is kept at F+=1,and the influence of actuator density (denoted as Sa,defined as the ratio of chord length to the spacing of two neighboring jet orifices c/la)on the flow control effect of PSJ is studied.The jet orifice diameter is not considered in the definition because it is much smaller than the actuator spacing and is unchanged in the current research.Four values of Sa=3,5,7.5 and 15 are realized by selectively sealing the jet orifices in the actuator array with a small tape,as sketched in figure 11.
The lift and drag coefficient curves of the wing model at different actuator densities are shown in figure 12.It is interesting to find that,as long as a minimum threshold of density (Sa≥5) is met,the flow control effect remains unchanged with increasing actuator density.Once the actuator density drops below the threshold,the performance of PSJAs deteriorates obviously.Specifically,in cases of Sa=5,7.5,15,the stall angle of attack is postponed by 2°,and the peak lift coefficient can be increased by around 10.3%.When the actuator density reduces to Sa=3,the increase of peak lift coefficient drops to 7.6%,and the stall angle of attack is only delayed by 1°.These findings are pretty useful in power saving,for achieving the optimal flow control effect using the minimum number of PSJAs.
To illustrate the mechanism of the effect of actuator density on the flow control performance,PIV measurements in different spanwise planes are performed to examine the three-dimensional velocity fields at a fixed angle of attack of 15.5°.For each case,three spanwise planes are picked.In order to avoid the influence of the wing tips and fuselage,the test planes are chosen at the center of the left wing.Specifically,the first measurement plane for Sa=5,7.5 and 15 is set as the center of the jet orifice of the No.7 actuator,whereas for Sa=3,and the first station is set as the exit center of the No.6 actuator because No.7 actuator is covered.The second and third measurement planes are located at distance of 0.25laand 0.5larespectively to the right side of the first measurement plane.The lahere is calculated after the spare orifices sealed,with la=100 mm,60 mm,40 mm,and 20 mm at Sa=3,5,7.5,and 15,respectively.Taking the case at Sa=3 as an example,the three spanwise positions for PIV measurements are the center of the jet orifice of the No.6 actuator,25 mm to the right side of the No.6 actuator,and 75 mm to the right side of the No.6 actuator,respectively.
Figure 13 compares,side by side,the baseline and the actuated three-dimensional velocity fields.It is obvious that in the baseline condition,the low-speed area in the third measurement plane (close to fuselage) is larger than that in the first measurement plane,indicating that the flow separation originates from the middle of the wing,and extends gradually towards the wingtips at increasing angles of attack.When the plasma actuation is turned on,the low-velocity areas at different spanwise locations show noticeable reduction,regardless of the actuator density,and a rough trend of decreasing low-speed area with increasing actuator density can be picked.
To facilitate quantitative comparison,the relative variation of the low-speed area (denoted as Are) in each spanwise location is calculated by Are=1 −Aa,At/Aa,BL,where Aa,BLand Aa,Atrepresent the low-speed area in baseline and actuated conditions,respectively.Figure 14(a) shows the spanwise variation of Areat different actuator densities.The change of the area reduction Arewith the spanwise position at different actuator densities is consistent with the change of the velocity fields in figure 13.Namely,further the measurement plane is away from the jet orifice,smaller the reduction of the low-speed area will be.This is somehow expected.Since the spanwise vortex formed by the interaction between PSJ and the main flow is limited in around 5 times of the jet orifice diameter at the initiation of discharge[32],the low-speed area further away from the jet orifice is less affected.
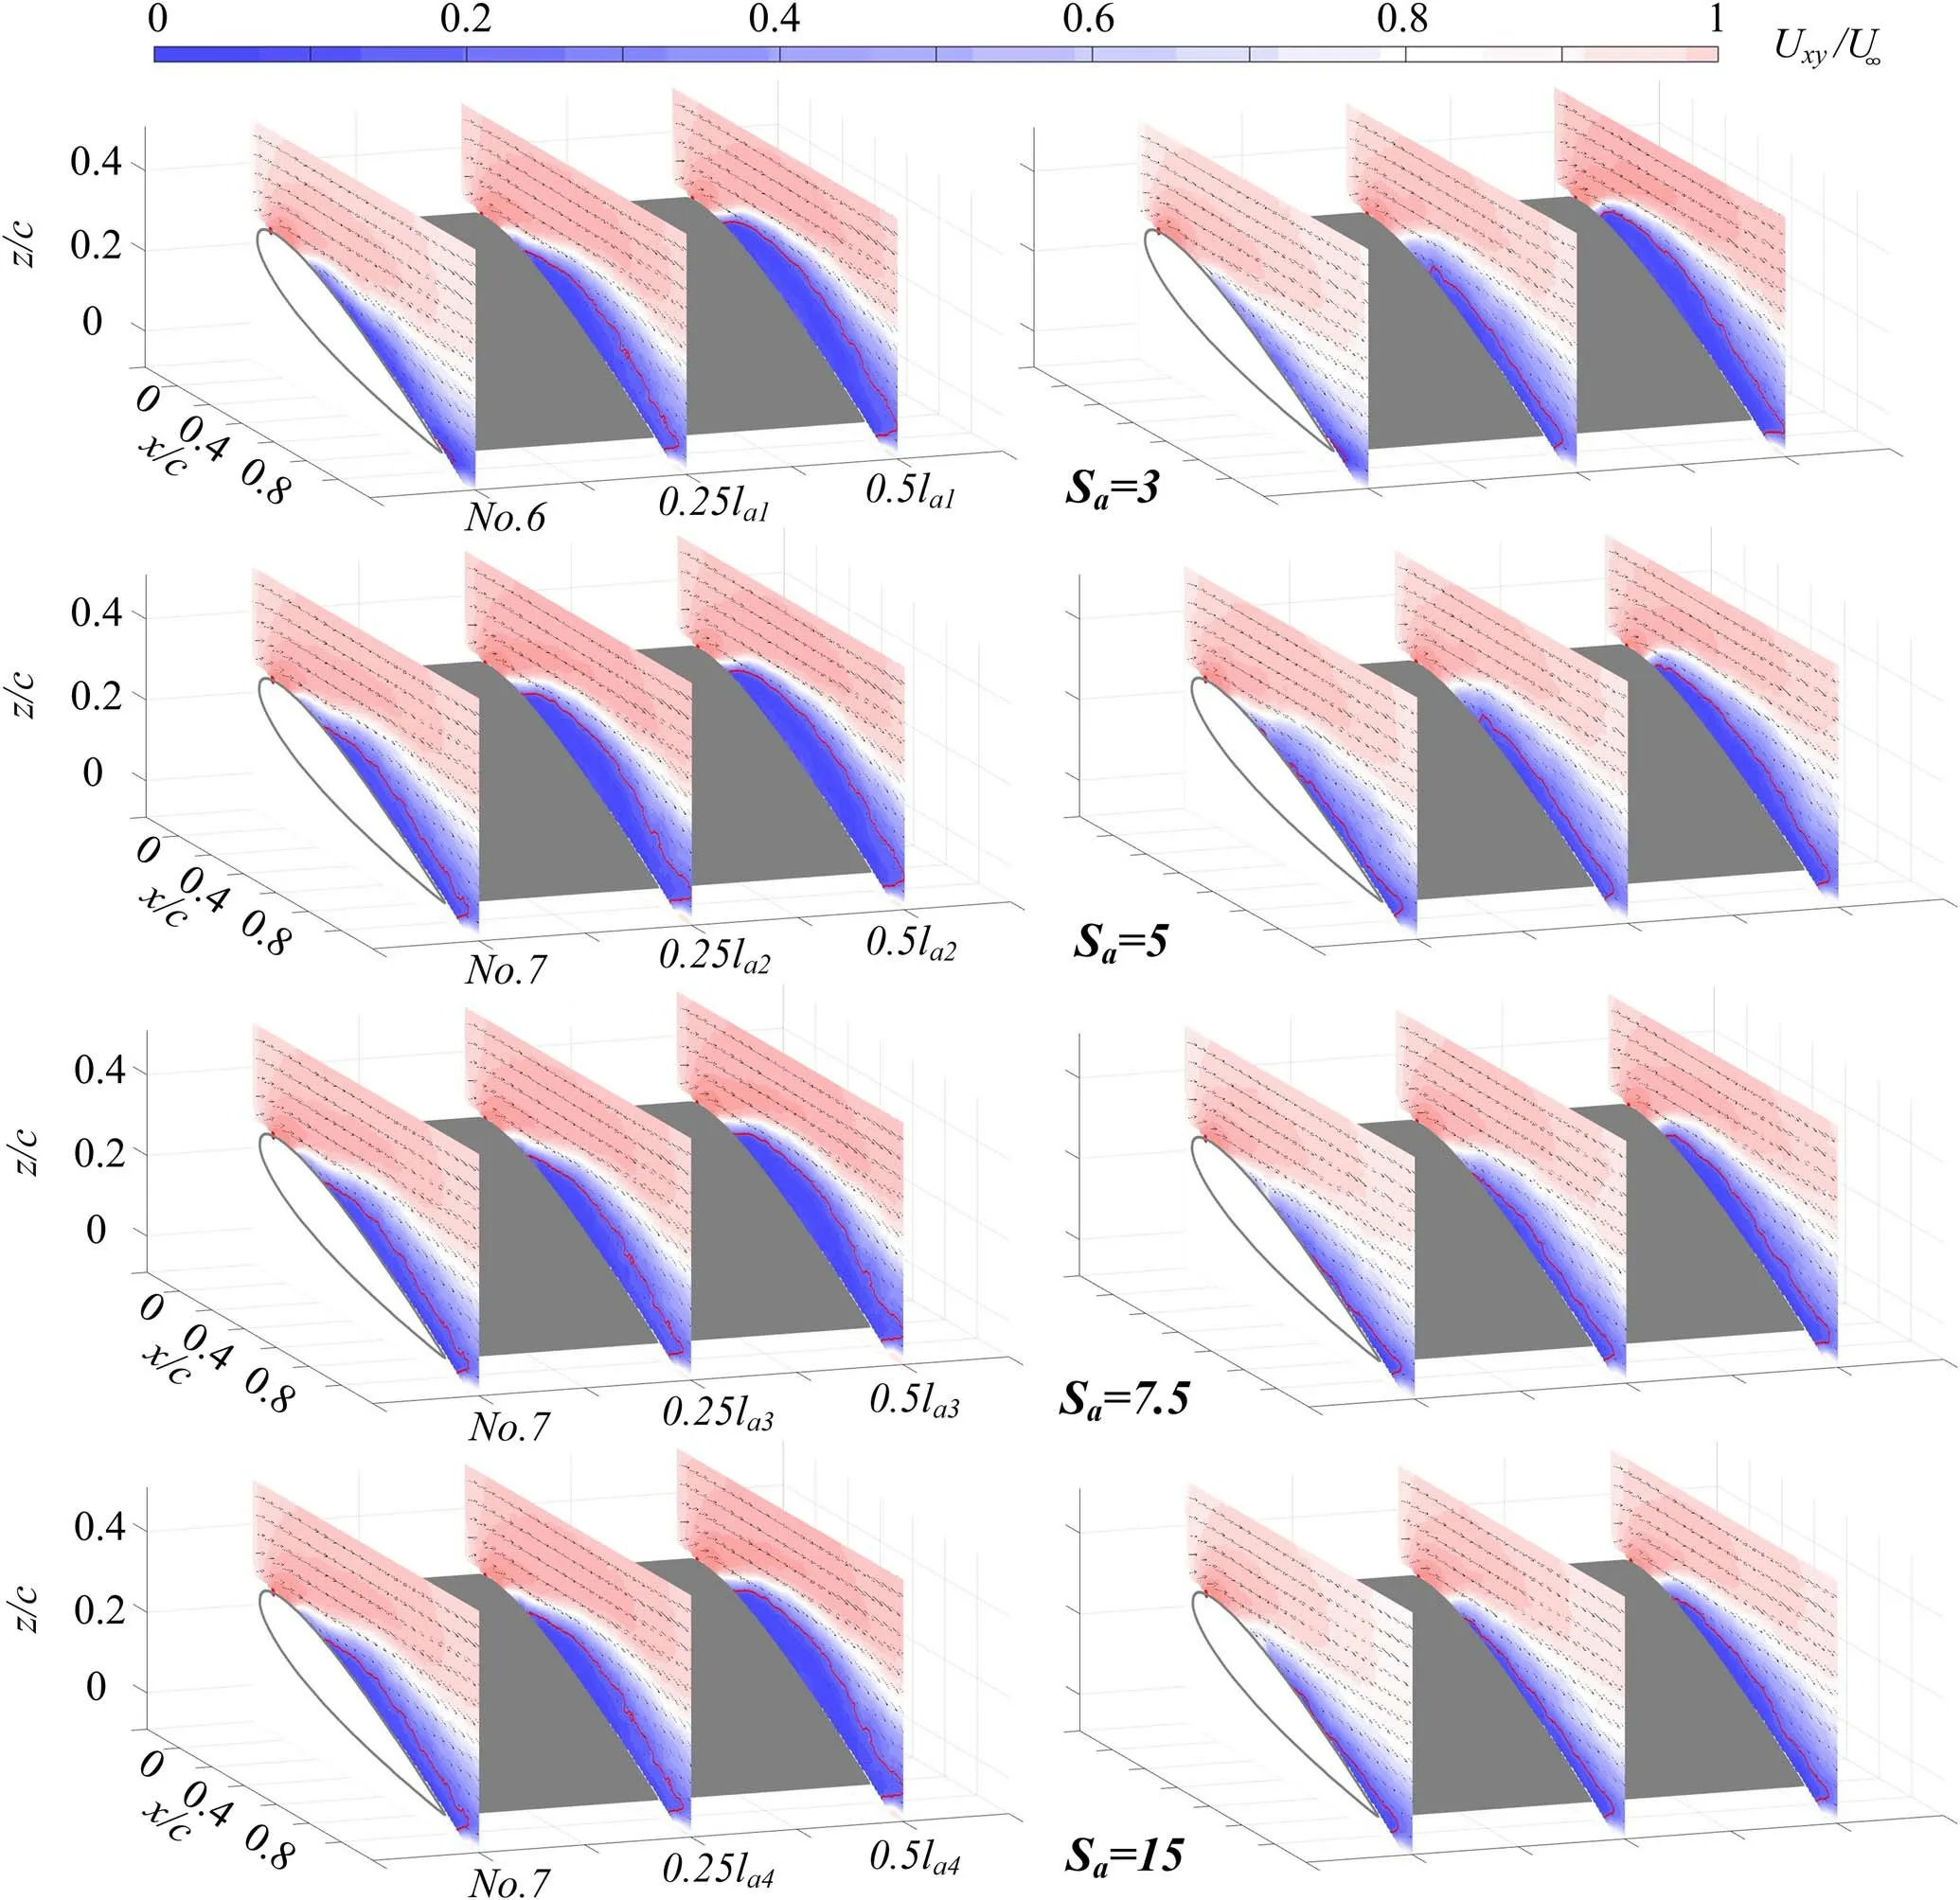
Figure 13.Comparison of the velocity fields obtained at different spanwise positions.Left column: baseline case,and right column: PSJ turned on.
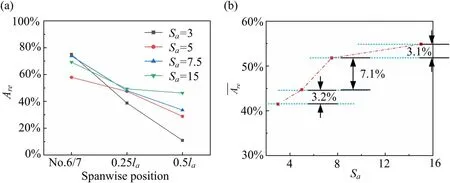
Figure 14.(a) Are and (b)Are at different actuator densities.
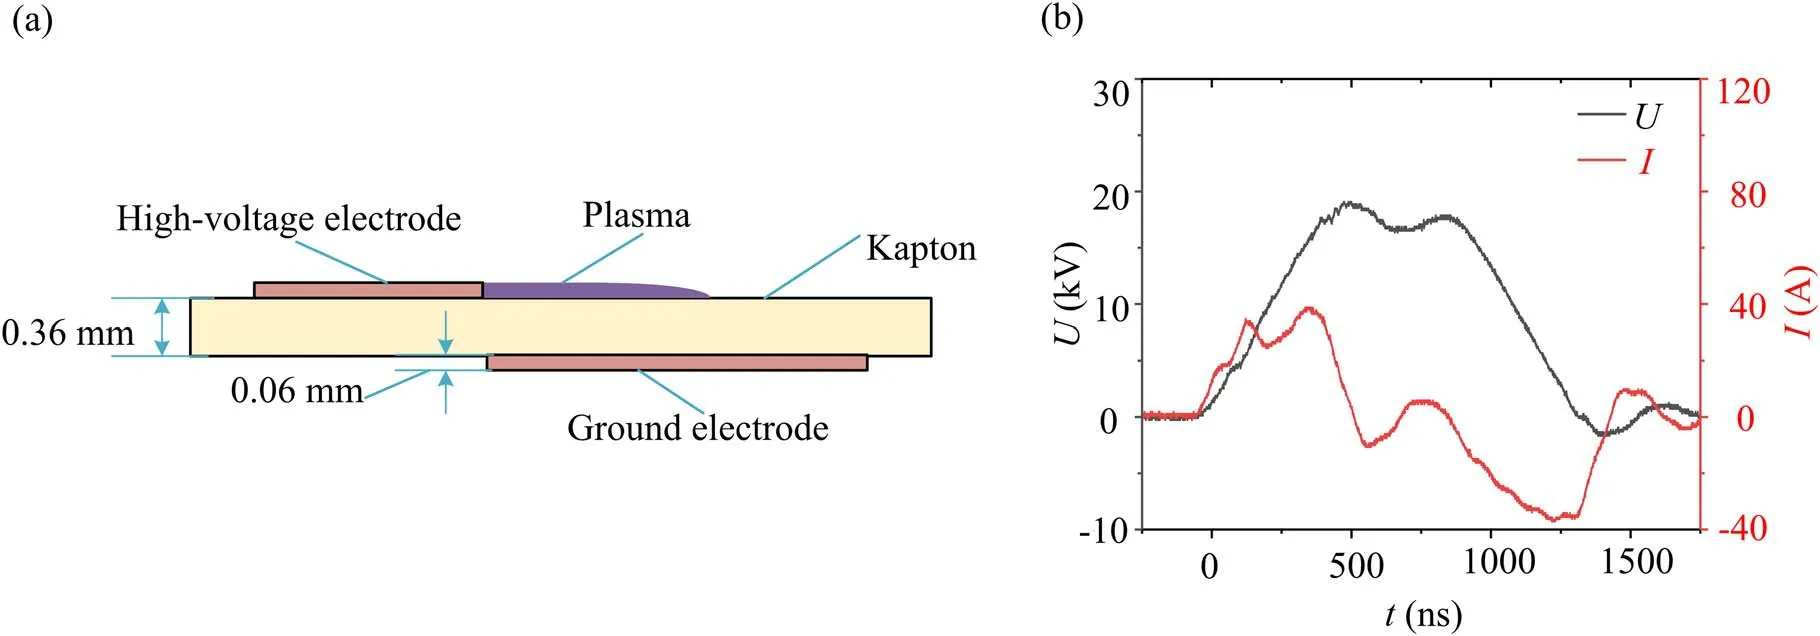
Figure 15.(a) Schematic diagram and (b) discharge waveform of DBD actuator.
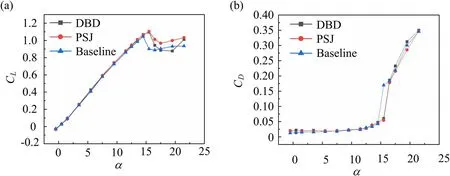
Figure 16.(a) Lift and (b) drag coefficients curves obtained in case of DBD and PSJ actuation.
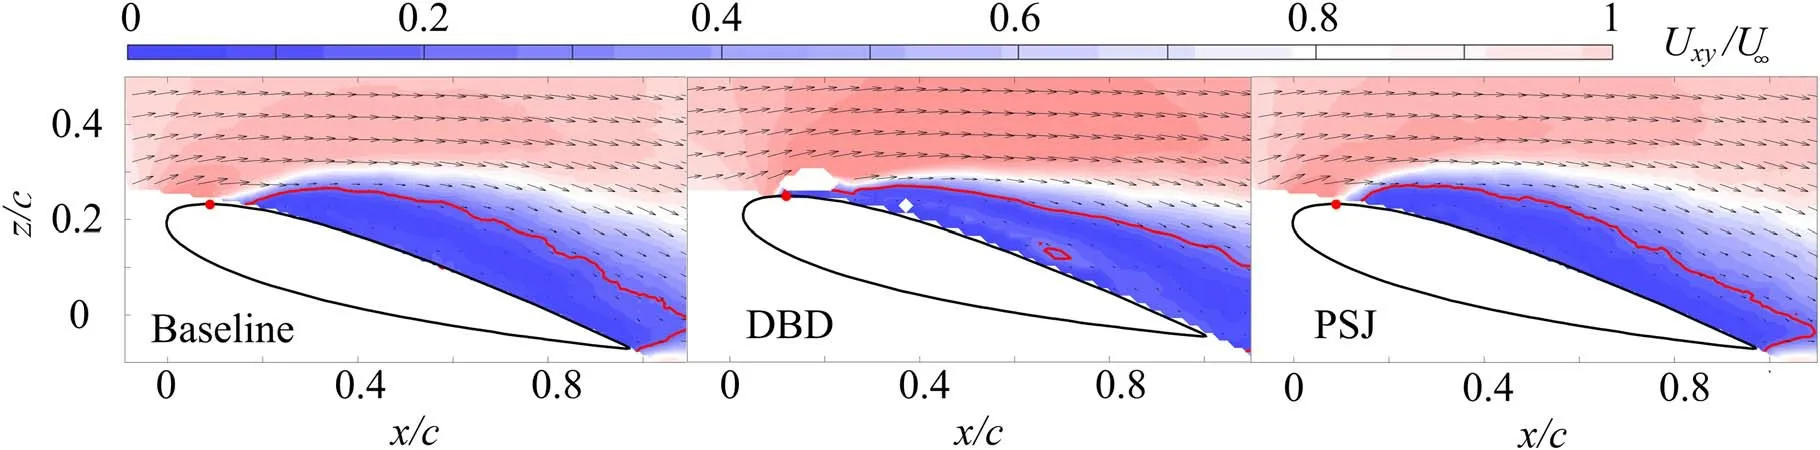
Figure 17.Time-averaged velocity fields measured by PIV at α=15.5° on No.8 actuator orifice; from left to right,the three plots correspond to baseline,plasma DBD and PSJ actuation,respectively.
For purpose of inter-case comparison,the spatiallyaveraged value of the low-speed area at each actuator density(denoted asAre) is computed and plotted in figure 14(b).As evident,Areincreases continuously with increasing actuator density,but the growth rate is different.In the range of 3-7.5,Areincreases most obviously.While in the range of 7.5-15,Aretends to saturate.The kink point here (Sa=7.5) slight deviates from that found in force measurements (Sa=5),indicating that once the separation area has been suppressed to a certain value,further reduction does not always bring lift increase.In future studies,whether the threshold value of actuator density found in this study (Sa=5) also applies to other types of wing models needs to be validated.
3.3.Comparison between PSJs and DBD in flow control performance
Since both ns-DBD plasma actuators and PSJAs can be used to suppress the large-scale flow separation,it would be interesting to compare the control effectiveness of these two actuators under the same energy input.In this section,a ns-DBD actuator is made and pasted at exactly the same streamwise location as the PSJ exit orifice,with the junction of the electrodes of DBD actuator located at the center of the jet orifices of the PSJAs.The profile of DBD actuator is shown in figure 15(a).Both electrodes of DBD actuator are made of copper foil with a thickness of 0.06 mm,and the insulating material is made of 6 layers of Kapton tape (total thickness: 0.36 mm).The length of the actuator (the length scale perpendicular to the profile) is 700 mm.Keeping the output of the high-voltage power supply same as that in section 2,the voltage and current waveforms measured on the DBD plasma actuator are shown in figure 15(b).By integrating the instantaneous power over time,the single pulse energy of DBD plasma actuator is determined to be 53 mJ,same to that consumed by the PSJ array with an actuator density of Sa=3.Therefore,these two cases are comparable.Because it is difficult to further increase the breakdown voltage of the dielectric layer in DBD to improve the power consumption without affecting the aerodynamic profile of the wing,the actuator density of Sa=3 rather than Sa=5 is used for PSJAs to match the power consumption of DBD.
With the same setting of F+=1 and U∞=10 m s−1,the lift and drag coefficients of the wing model with DBD plasma actuator and PSJA array at Sa=3 are shown in figure 16.In the case of DBD,the peak lift coefficient is increased by 4.9%with respect to the baseline condition,and the stall angle is postponed by 1°.As a comparison,the stall angle is also postponed by 1°by the PSJAs and the peak lift coefficient is increased by 5.6%.Therefore,it is fair to conclude that for the same power consumption,the authority of PSJA in low-speed flow separation control is slightly stronger than that of DBD.In addition,limited by the breakdown voltage of dielectric layer,further increase of the pulse energy injected by DBD plasma actuator is difficult,which,for PSJA,is never a problem.
The time-averaged velocity fields in the cases of baseline,DBD plasma actuation and PSJ actuation at Sa=3 are compared in figure 17 at α=15.5°.Note that due to the strong laser reflection from the surface of the DBD actuator,part of the erroneous vector field near the leading edge is cropped as blank.Judging from the location of the contour line of 20%U∞,the flow separation region over the wing surface changes little under DBD actuation (Are= 7.5%).Nevertheless,under PSJ actuation,the low-speed area reduces significantly,withAre= 41.5%.This observation is consistent with the force measurement results shown in figure 16 with PSJ exhibiting stronger flow control capability than DBD at low-speed condition.The higher effectiveness of PSJ than DBD at the same power consumption is produced by the higher jet velocity in the vertical direction by PSJ,which is more than an order of magnitude larger than the velocity of the wall-bounded jet induced by DBD[33]and is much easier to penetrate the separated boundary layer and affects the flow field more downstream.
4.Conclusions
The effects of discharge frequency and actuator density on the flow separation control effectiveness of PSJAs at Rec=2.02×10⁵are investigated using aerodynamic force measurement and PIV method.A comparison between the flow control capabilities of PSJAs and DBD at the same power consumption is also carried out.
It is found that,similar to the airfoil case shown in literature,the best flow control effect on the straight-wing model is achieved at F+=1,with the stall postponed by 2°and the peak lift coefficient increased by 10.5%.In this optimal case,PIV test results show that the low-speed area decreases periodically under the dynamic sweeping effect of spanwise vortices induced by PSJ.Apart from discharge frequency,for effective flow separation control,there exists a minimum threshold for actuator density below which the lift drops significantly.In the current research,this threshold is Sa=5.The reason why a threshold value of actuator density exists may be explained by the limit size of the spanwise vortex formed by the interaction between PSJ and the main flow.In addition,comparison under conditions of the same power consumption indicates that the effectiveness of PSJ in flow separation control is slightly higher than that of DBD.The stall of the wing model is postponed by 1° by both the DBD and PSJAS,while the peak lift coefficient is increased by 4.9% and 5.6% by the DBD and PSJAs,respectively.
In future studies,leading-edge/trailing-edge flow separation control by PSJAs under higher Mach number and Reynolds number,and the effects of different parameters(such as discharge energy,geometric parameters,and the streamwise position of the PSJAs)on the threshold of actuator density should be investigated.
Acknowledgments
This work is supported by National Natural Science Foundation of China (Nos.12002384 and 11802341),the National Key Laboratory Foundation of China (No.614220210200112),the Academician Workstation Foundation of the Green Aerotechnics Research Institute of Chongqing Jiaotong University(No.GATRI2020C06003).
ORCID iDs
猜你喜欢
杂志排行

Plasma Science and Technology的其它文章
- Investigation on the multi-hole directional coupler for power measurement of the J-TEXT ECRH system
- Neutronic analysis of Indian helium-cooled solid breeder tritium breeding module for testing in ITER
- Investigation on the electrode surface roughness effects on a repetitive selfbreakdown gas switch
- Roll-to-roll fabrication of large-scale polyorgansiloxane thin film with high flexibility and ultra-efficient atomic oxygen resistance
- Effect of shock wave formation on propellant ignition in capillary discharge
- The application of a helicon plasma source in reactive sputter deposition of tungsten nitride thin films