Probabilistic limit state design method of the axial resistance of post grouting pile
2022-07-13ZhangZhitongGongWeimingXieJiangDaiGuoliangSuWeiQiaoJinfei
Zhang Zhitong Gong Weiming Xie Jiang Dai Guoliang Su Wei Qiao Jinfei
(1Key Laboratory of Concrete and Prestressed Concrete Structures of Ministry of Education,Southeast University, Nanjing 211189, China)(2School of Civil Engineering, Southeast University, Nanjing 211189, China)(3China Railway Design Corporation, Tianjin 300308, China)
Abstract:The reliability of post grouting pile axial resistance was studied by proposing a design method for its probabilistic limit state, which is represented by the partial coefficients of load, end, and side resistance.The hyperbolic, modified hyperbolic, and polynomial models were employed to predict the ultimate bearing capacity of test piles that were not loaded to damage in field tests.The results were used for the calculation and calibration of the reliability index.The reliability of the probabilistic limit state design method was verified by an engineering case.The results show that the prediction results obtained from the modified hyperbolic model are closest to those obtained through the static load test.The proposed corresponding values of total, side, and end resistance partial coefficients are 1.84, 1.66, and 2.73 when the dead and live load partial coefficients are taken as 1.1 and 1.4, respectively.Meanwhile, the corresponding partial coefficients of total, side, and end resistance are 1.70, 1.56, and 2.34 when the dead and live load partial coefficients are taken as 1.2 and 1.4, respectively.
Key words:probabilistic limit state design method; reliability theory; post grouting pile; total resistance partial coefficient
The development of reliability theory in geotechnical engineering has made it possible to establish a probabilistic limit state design method of pile foundation, represented by partial coefficients of load and resistance based on this theory.In recent years, the application of such a design based on reliability theory has become a development trend in the field of engineering structure codes.Therefore, many scholars have calibrated the calculation formulas of axial resistance for different pile types in code standards.
For instance, Luo[1]used the calibration method to calculate the reliability index of pile foundation in code for designs used in railway bridges and culverts.The author identified the expression of the design value of the axial-bearing capacity of bored cast-in-place piles and driven piles under the target reliability and obtained the corresponding partial coefficient of resistance.Bian et al.[2]systematically studied the reliability design method of pile foundation and proposed the calculation formula of the reliability index in a serviceability limit state.Many scholars have also conducted calibration and research for different pile types.For example, Fortier[3]developed a database according to the collected pile test data from Louisiana and Mississippi and then calibrated the resistance coefficient in AASHTO using the MC method.Tang et al.[4]collected the static load test data of 149 H-shaped steel piles and obtained the statistical variables of model factors.Using such information, they modified the design resistance coefficient of the vertical bearing capacity limit state of the H-shaped steel pile.
Some scholars have investigated the factors affecting the reliability index of pile foundation bearing capacity.For example, Wang et al.[5]clarified the influence of the effective internal friction angle of soil and the uncertainty of variable load on reliability design.Huang et al.[6]and Zhang et al.[7]analyzed the reliability indexes of bored cast-in-place pile before and after grouting.Their results indicated that post grouting can reduce the influence on the reliability of bearing layer characteristics and pile foundation construction.
In summary, many scholars have studied the reliability of axial resistance design methods for several types of piles.Thus, the corresponding data processing methods, reliability calibration procedures, and recommended values of partial coefficients were obtained.However, research on the probabilistic limit state design method for post grouting piles remains lacking.
In this paper, the probabilistic limit state design method of the axial resistance of post grouting pile was analyzed based on the statistical data for the axial resistance of 103 post grouting piles.The partial coefficient of total resistance was further calibrated under the determined target reliability, after which the recommended values of partial coefficients for load and resistance were obtained based on the probabilistic limit state design method of the vertical bearing capacity of the post grouting pile.
1 Calibration of the Design Method for Axial Resistance
1.1 Limit state equation
Assuming that the function of the structure is determined bynfactors, then the function of the structure is given by
Z=g(X)
(1)
whereX={X1,X2,…,Xn}T.
Generally, the basic equation of the limit state is defined as follows:
Z=g(R,G,Q)=R-G-Q=0
(2)
whereRis the resistance of pile foundation;Gis the dead load;Qis the live load.
To normalize the resistance caused by differences in pile specifications and soil properties, the dimensionless variablesλR,λGandλQare respectively introduced as follows[7-9]:
(3)
(4)
(5)
whereRM,GM, andQMare the measured values of resistance, dead, and live loads, respectively;RK,GK, andQKare the calculated values of ultimate bearing capacity, as well as dead and live loads according to the code standards, respectively.
Thus, Eq.(2)is transformed into
Z=λRRK-λGGK-λQQK=0
(6)
In addition, reliability indexes were investigated for different live to dead load ratios or different partial coefficients contained in the code standard formulas.The ratio of live load to dead load,ρ=QK/GK, and the limit state design formulas are determined as follows:
(7)
whereρis the ratio of live load to dead load;γR,γG, andγQare the partial coefficients of total resistance, as well as dead and live loads, respectively.
1.2 Partial coefficient of resistance
Using Eq.(7)and the collected statistical data of field test piles, the reliability indexes of the pile axial resistance design formula can be obtained for different partial resistance coefficients and live to dead load ratios.
In this study, the JC method is used for conducting the reliability analysis[6].The results obtained by splitting the ratios of end and side resistance are equal to the partial coefficient of total resistance obtained by calibration:
(8)
whereγb,γs, andγuare the partial coefficients of the end, side, and total resistance, respectively;ηsandηbare the ratios of the mean values of side and end resistance to the mean value of the total resistance, respectively.
1.3 Target reliability index of bridge pile foundation
The target reliability index of a highway bridge structure is 4.7[10].Therefore, the reliability index contained in the probabilistic limit state calculation formula, which is represented by the resistance partial coefficient, should not be lower than 4.7.
2 Calculation Model and Data Analysis of Post Grouting Pile
2.1 Calculation method
In this paper, the limit value of the vertical bearing capacity of post grouting pile is obtained, in accordance with the specifications for the design of foundation for highway bridges and culverts(JTG 3363—2019)[11]:
Ru=Rus+Rub=u∑βsiqikli+2βpqrAp
(9)
whereRu,Rus, andRubare the ultimate bearing capacities of the total, side, and end resistance, respectively;uis the perimeter of the pile;qikis the standard value of the ultimate side resistance of theith soil layer;liis the thickness of thei-th soil layer;qris the standard value of ultimate end resistance;Apis the cross-sectional area of pile end;βsiandβpare the enhancement coefficients of side and end resistance, respectively.
Then the corresponding probabilistic limit state design formula is given by
2.2 Statistical analysis
A total of 103 post grouting pile test data were collected in this study[12-15], of which 73 piles were loaded to the limit state in the field static load test.Additionally, even though 30 field test piles were not loaded to the limit state, the detailed load and settlement data could be predicted by the polynomial, hyperbolic, and modified hyperbolic models[16-19].
After screening these data[20], the numbers of test piles that can be predicted by the polynomial, hyperbolic, and modified hyperbolic models are 29, 28, and 26, respectively.The prediction results of each model are listed in Tab.1.

Tab.1 Statistical information on the prediction results of different models
3 Reliability Design Formula
3.1 Effect of predictive models on the reliability index of axial resistance
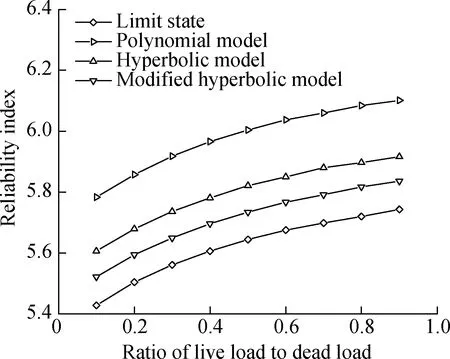
The statistical data of the axial resistance of post grouting pile under different prediction models are given in Tab.1.Then, the reliability indexes of the design formula of the axial resistance of post grouting pile for a highway bridge under the conditions ofγR=2,γG=1.2, andγQ=1.4 were calculated.The results are shown in Fig.1.As shown in the figure, the calculated results of the three prediction models are higher compared with the test results loaded to the limit state, while the results obtained from the modified hyperbolic prediction model are closest to the results of the static load test.

Fig.1 Reliability index of the axial resistance of post grouting pile under different prediction models
3.2 Factors influencing the reliability index
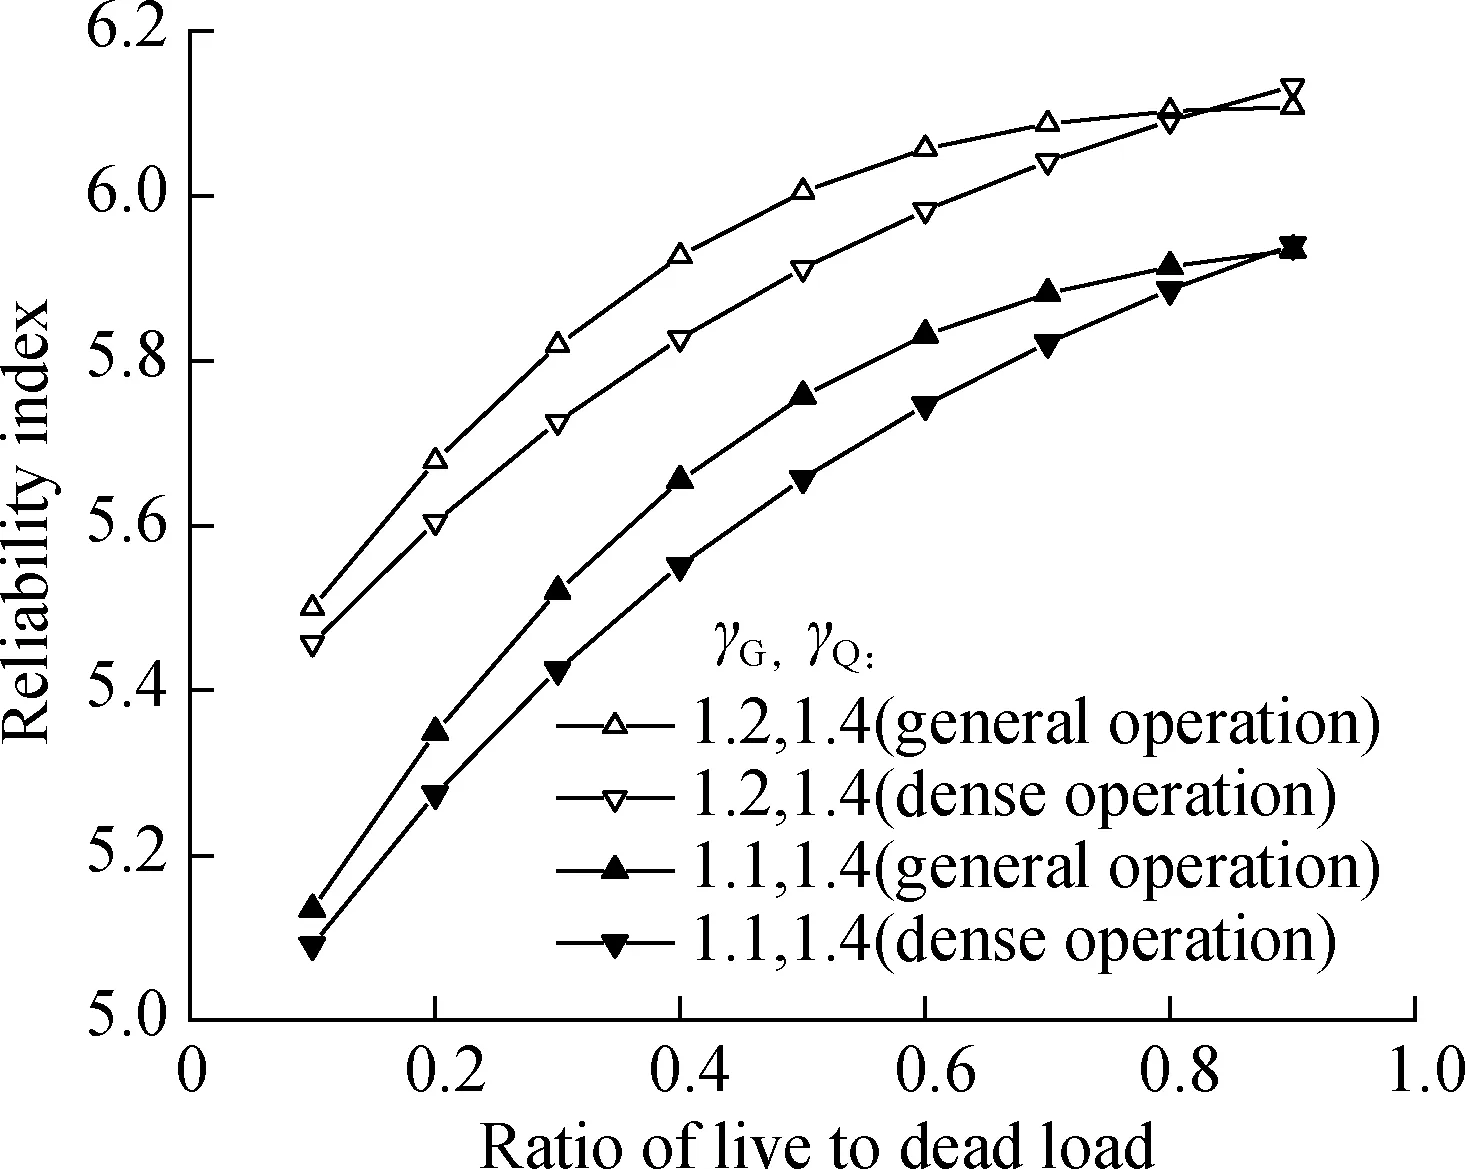
The influence of different factors, such as the operating condition of the vehicles on the bridge and the ratio of live to dead load on the reliability index is considered in this section based on two sets of partial coefficient values; namely,γR=2,γG=1.2,γQ=1.4 andγR=2,γG=1.1,γQ=1.4.The calculation results of the axial resistance reliability index of the post grouting pile based on Eq.(9)are plotted in Fig.2.As shown in the figure, the influence degree of the operating state of vehicles on the reliability index shows a trend of increasing, decreasing, and then increasing again as the ratio of live to dead load changes.

Fig.2 Reliability indexes of the axial resistance of post grouting pile under different operation conditions
Additionally, under the condition that the partial coefficient of the live load is 1.4, the partial coefficients of dead load are 1.1 and 1.2, respectively.Furthermore, the calculated reliability indexes are greater than the target reliability index of 4.7, and the reliability index also increases gradually with the change of the ratio of live to dead load.Thus, it is necessary to calibrate the reliability.
3.3 Partial coefficient of the resistance of grouting pile
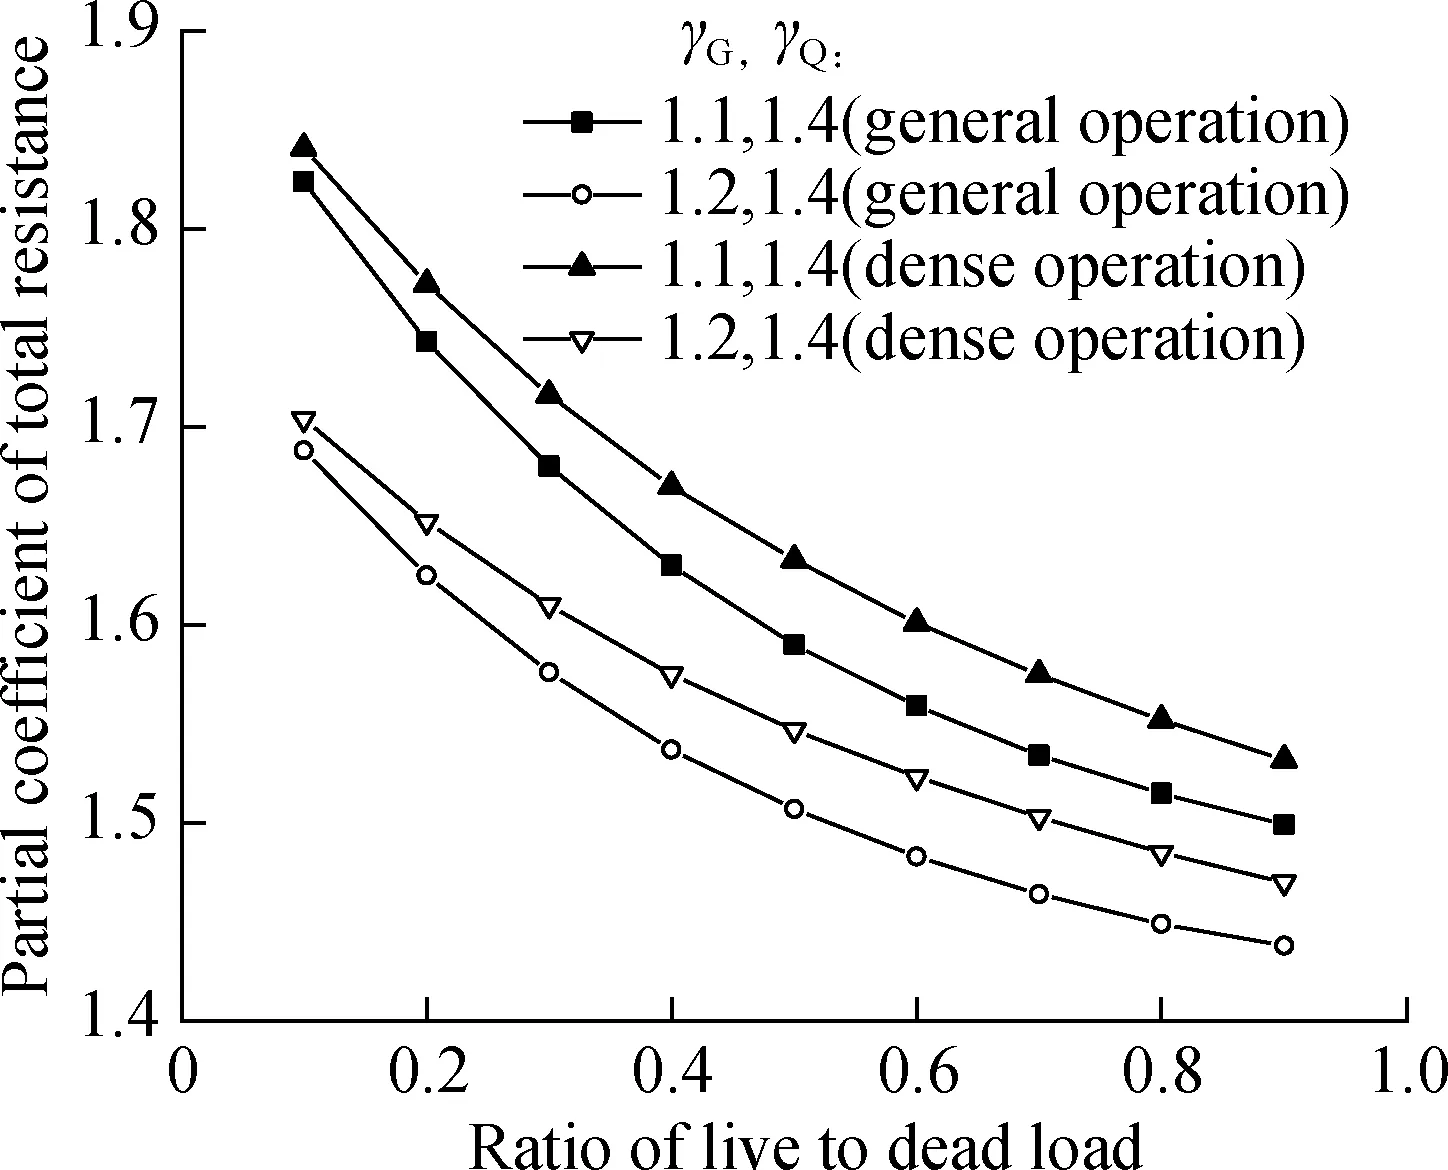
The partial coefficients of the total resistance of post grouting pile under different operating conditions are calibrated, and the target reliability is determined as 4.7.The calibration results for the corresponding partial coefficients of different loads are shown in Fig.3.

Fig.3 Partial coefficients of the total axial resistance of post grouting pile
Based on Eq.(8), the partial coefficients of the total axial resistance of post grouting pile are equivalently divided under different operating conditions.The partial coefficients of the side and end resistance of the post grouting pile are obtained by setting the ratio of live to dead load as 0.1.The calculation results are listed in Tab.2.

Tab.2 Partial coefficients of the axial load and resistance of post grouting pile
Tab.2 shows that the operation state has little effect on the total resistance and the side and end resistance partial coefficients of the grouting pile under the same partial coefficients of dead and live loads.Therefore, in order to facilitate, unify, and ensure the safety of bridge foundation piles, the resistance partial coefficient under dense operation can be determined based on the load partial coefficient.
3.4 Verification based on engineering case
Suramadu Bridge in Indonesia is located on Madura Strait in East Java Province, Indonesia.The No.45 pile of the approach bridge was selected as an engineering case in this study to illustrate and verify the feasibility of the probabilistic limit state design method of axial resistance for the post grouting pile.
The pile is 2.2 m in diameter and 80.708 m in length.The side resistance within 11 m above the pile end is enhanced, and the enhancement coefficients of side and end resistance are taken asβsi=1.3 andβP=1.6, respectively[11].Then, based on Eq.(9), the calculated values of ultimate side resistance and ultimate end resistance of the test pile areRus=26.636 MN andRub=7.347 MN, respectively.
According to the proposed probabilistic limit state design method for the axial resistance of the post grouting pile,γG=1.2 andγQ=1.4 are considered, and the design value of the bearing capacity of the test pile is calculated from the post grouting pile’s partial coefficient of resistance.The bearing capacity calculated from the total partial coefficient is 19.990 MN, and the corresponding value for the sum of the partial coefficients of end and side resistance is 20.214 MN.
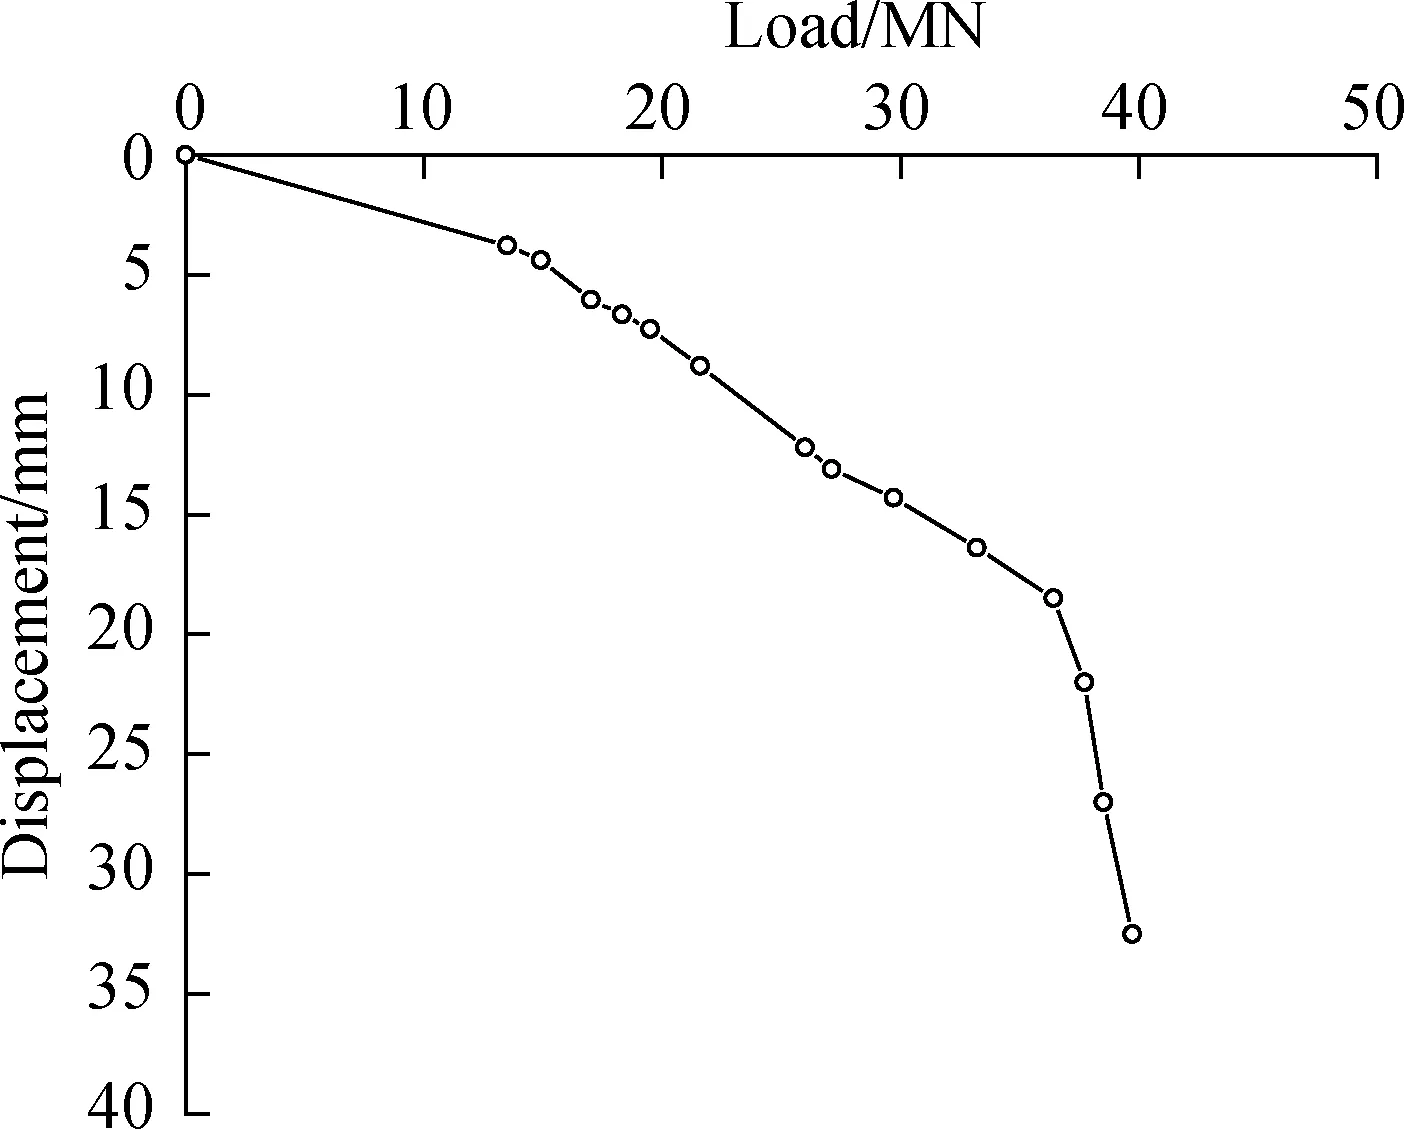
The measured pile top load-displacement equivalent curve of the No.45 pile is shown in Fig.4.As can be seen, the load at the maximum displacement is determined as the ultimate bearing capacity.As shown in Fig.4, the measured bearing capacity of the test pile is 39.717 MN, while the end resistance and side resistance corresponding to the level of load are 9.580 and 30.137 MN, respectively.The safety factor is taken as 2.0.Then, the design value of the bearing capacity of the test pile, which is calculated by using the probabilistic limit state design method of axial resistance, is slightly higher than the measured value.Given that the test pile is not loaded to failure, the design value obtained according to the method given in this study is relatively safe.

Fig.4 Load-displacement curve of the test pile of Suramadu Bridge
4 Conclusions
1)Compared to the calculated values based on the data on the static load test for the limit state, the three ultimate bearing capacity prediction models produced higher values.Furthermore, the results obtained from the modified hyperbolic prediction model are closest to that of the static load test.
2)The reliability index of the axial resistance of the post grouting pile increases gradually with the increase in the ratio of live to dead load.Furthermore, the influence degree of the operating state of vehicles on the reliability index shows a trend of increasing, decreasing, and then increasing again as the ratio of live to dead load changes.
3)The corresponding partial coefficient of total resistance was obtained based on the target reliability index value of 4.7.Assuming thatγG=1.1 andγQ=1.4, the corresponding partial coefficients of the total resistance, side resistance, and end resistance are 1.84, 1.66, and 2.73, respectively.Meanwhile, upon assuming thatγG=1.2 andγQ=1.4, the corresponding partial coefficients of the total, side, and end resistance are 1.70, 1.56, and 2.34, respectively.
4)The engineering case results show that the design value obtained using the proposed method is relatively safe.
杂志排行
Journal of Southeast University(English Edition)的其它文章
- Multi-head attention-based long short-term memory model for speech emotion recognition
- Graph-enhanced neural interactive collaborative filtering
- Path prediction of flexible needles based on Fokker-Planck equation and disjunctive Kriging model
- Mapping relationship analysis of welding assembly properties for thin-walled parts with finite element and machine learning algorithm
- Dependency-based importance measures of components in mechatronic systems with complex network theory
- Feasibility analysis of using biomass gas or hydrogen in the tobacco curing system
