Feasibility analysis of using biomass gas or hydrogen in the tobacco curing system
2022-07-13WuZhengyuHuaYongmingDuanLunbo
Wu Zhengyu Hua Yongming Duan Lunbo
(School of Energy and Environment, Southeast University, Nanjing 210096, China)
Abstract:To address the energy shortage and meet the requirements of environmental protection policies, the feasibility of premixed fuel 1(natural gas(NG), syngas, and hydrogen)and premixed fuel 2(NG and hydrogen)in the tobacco curing system was studied.First, according to the law of conservation of energy and mass, a tobacco leaf curing system model was established.Then, the interchangeability index of the premixed fuels was analyzed, and their volume ratios were obtained.Finally, a numerical simulation analysis of the premixed fuel combustion was conducted based on the indicators of emission, temperature, and economy.On this basis, the comprehensive performance indexes of the system composed of different premixed fuels were evaluated.The results obtained indicate that with the increase in the hydrogen volume ratio in premixed fuel 1, NOX emissions will gradually increase.Moreover, with the increase in the hydrogen volume ratio in premixed fuel 2, CO emissions will gradually decrease.Because premixed fuel 2 contains more hydrogen than premixed fuel 1, CO emissions are reduced by 9.39% and 16.72% as compared with the NG system when the volume ratio of NG to hydrogen is 95∶5 and 90∶10, but the NO emissions of the latter are beyond the acceptable range.Finally, the overall performance is good when the volume ratio of NG to hydrogen is 95∶5, and the volume ratio of NG to syngas to hydrogen is 90∶5∶5.
Key words:tobacco curing; natural gas; hydrogen; syngas; emissions
As a common fuel, coal has long been used for tobacco backing in Yunnan, China.However, this traditional mode has gradually changed to another sustainable direction to meet stricter environmental policies.For example, natural gas(NG)has been chosen as an alternative to coal to reduce polluting emissions.In addition, a series of carbon-neutral fuels(e.g., syngas, biomass gas, and hydrogen)is used to completely or partially replace high-carbon fuel[1].Furthermore, biomass gas has great potential because of its abundant sources and environmentally friendly characteristics[2].
Some studies[3-4]showed that the use of syngas affects the combustion characteristics of burners.The flame characteristics of NG and syngas from noncatalytic reforming under the eddy dissipation concept(EDC)and flamelet/progress-variance-based approach were compared by Voloshchuk et al[5].They found that EDC methods tend to underestimate the CH4conversion process and therefore require a careful adjustment of the volume fraction.The flamelet/progress-variance-based approach overestimates the CH4conversion process and depends on the dynamics of a small flame formation.In addition, some studies[6-7]found that changes in the syngas composition will affect the temperature, emissions, and combustion efficiency of combustion chambers.
Hydrogen(H2)not only has a great potential for combating climate change and environmental protection, but it can also be obtained from various sources(biomass, wind, solar, and electrolyzed water).There has been extensive combustion testing of hydrogen as an additive and alternative fuel to NG, including studies on how to accommodate more hydrogen in NG fuels for industrial combustion equipment, internal combustion engines, and gas turbines[8-10].Cellek et al.[11]found that when hydrogen-rich NG or pure hydrogen was used to replace NG as fuel, the emissions of CO and CO2from combustion were significantly lower than those of NG.Rahnama et al.[12]found that the use of hydrogen and syngas as additives provides full combustion, which will reduce CO and HC emissions.However, NOXemissions exceed acceptable levels.
Although syngas from biomass pyrolysis and H2have great potential in tobacco curing applications, there is very limited research on this subject.Furthermore, most studies on the mixed combustions of syngas and NG are mainly aimed at the improvement of burners[13-14], but the application of the mixed combustions of hydrogen, syngas, and NG is lacking.Although some studies have performed comparative analyses on the NOXemission levels of different types and proportions of mixed combustions[15-16], there is still a lack of research on the effects of different NOXgeneration mechanisms on NO emissions and changes in pollutant generation rates during combustion.
In this study, a tobacco curing system using NG and fuel was designed and analyzed.This system includes an inlet and outlet system for fuel, air, and wet air(IO system), combustion and heat transfer system(C&HT), curing room system(CBS), gasification system(GS), and circuit wind cycle.In particular, the combustion and emission characteristics of the mixed combustion(NG, hydrogen, and syngas using discharged tobacco stems)were analyzed through a numerical analysis based on the idea of improving the utilization ratio of resources.Furthermore, the turbulence interaction mode in the NOXformation mechanism and the NOXreburn were considered.This research proposes how to simplify the problem of complex engineering by decoupling the entire system into subsystems.Furthermore, it presents insights into the combustion and emission characteristics of different fuel mixtures in the tobacco curing system and provides a theoretical basis for the process of replacing the fuel in the tobacco curing system.Further experiments and numerical simulation works are expected to lead to new developments in the tobacco curing system.
1 System Design
Based on the law of conservation of energy and mass, the computational fluid dynamics(CFD)model of the tobacco curing system using NG was established.In this section, considering the energy availability and requirements of design rules, the replaceability of fuel is introduced.
1.1 System configuration
The schematic diagram of the tobacco curing system is shown in Fig.1.The system is mainly composed of the IO system, C&HT system, CBS, GS, and circuit wind cycle.NG and air from the IO system(inlet)were mixed with syngas from the GS in the burner.After combusting in the combustion chamber, exhaust flow was discharged through the secondary plate heat exchanger.The main components of the tobacco curing system are as follows:
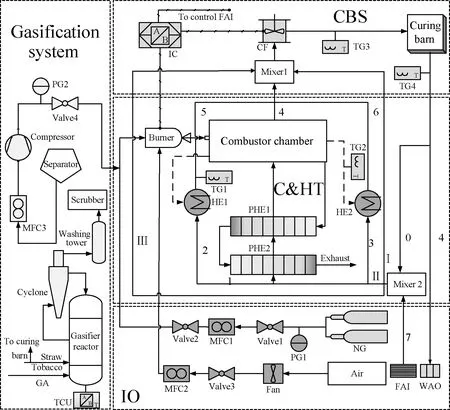
Fig.1 Schematic diagram of the tobacco leaf curing system
1)IO system.Air is continuously supplied to the curing system by a fan via valve 3(Valve3)and mass flow controller 2(MFC2).The pressure gauge(PG1)monitors the pressure of NG, and NG is mixed with the syngas produced in the GS before entering the burner.Fresh air enters through the fresh air inlet(FAI), which is controlled by an intelligent controller(IC)if the humidity of the cycling air exceeds the limit.At the same time, the wet air is discharged from the wet air outlet(WAO)due to the positive pressure in the curing room.
2)C&HT system.The mixed gas is injected and ignited in the corrugated combustion chamber from the burner and releases heat to all circumfluence air.After releasing heat to the first circuit wind branch in a two-stage plate heat exchanger(PHE1 and PHE2), the low-temperature flow is discharged through a chimney.Particularly, the wasted heat from the outer chamber surface is recovered by the second and third circuit wind branches.
3)CBS.Nos.4, 5, and 6 circuit wind branches are mixed before entering Mixer 1 and blown into the curing room with low-temperature circuit wind(branches Ⅱ and Ⅲ)by a circulating fan.At the same time, IC controls the opening and closing of the burner and FAI.In addition, IC collects the value of the temperature gauge(TG3)in the curing room in real time.There is no need to control the opening and closing of WAO because the wet air outlet will be automatically opened due to the positive pressure in the curing room.The air supplied in the curing room is 23 000 kg/h.
4)GS.The unused tobacco stems are reacted with a gasifying agent in the gasification reaction unit, and the temperature control unit controls the reaction temperature.The syngas produced by the reaction is mixed with NG before entering the burner after passing through a series of devices, such as a cyclone separator.
5)Circuit wind cycle.High-temperature air enters the curing room from Mixer 1, releases heat to the tobacco leaves, and takes the humidity from them.This process can be considered a constant-enthalpy process.The fourth branch air(4)is discharged from the WAO, and No.0 branch air(0)is mixed with fresh air from the FAI in Mixer2.The whole mixture is divided into three branches(Ⅰ, Ⅱ, and Ⅲ), and branch Ⅱ flow enters the C&HT system to complete its combusting and heat exchange process.The circuit wind volume of branch Ⅰ accounts for 50% of the total circuit wind(branches Ⅰ, Ⅱ, and Ⅲ)volume.
1.2 IO system
The temperatures of the inlet air and fuel are both 20 ℃.In addition, the volume fraction ratio of the air composition is 79% N2and 21% O2.The volume fraction ratio of the NG composition is 98.46% methane, 0.724% nitrogen, 0.735% carbon dioxide, and 0.081% water vapor.The amount of fuel required by the curing system is related to the total loadQduring the curing process.The total load of the curing process includes the dehydration heating loadQ1and fresh air heating loadQ2.Tab.1 shows the parameters of the tobacco leaf curing system when NG is used as fuel.And the heat required for the dehydration of tobacco leaves per hour is shown as

Tab.1 Parameters of the tobacco curing system
(1)
wheremtobaccois the mass of fresh tobacco, kg;βis the dehydration rate in 1 h; andris the theoretical heat consumption required to discharge 1 kg of water, kJ/kg.
The relationship between the mass flowGof fresh air and moisture content during dehumidification is shown as
(2)
wheredfreshis the moisture content of fresh air, g/kg; anddwetis the moisture content of wet air, g/kg.
The heat required to replenish the ambient air in the dehumidification phase is shown as
(3)
whereH1is the enthalpy of fresh air at the FIO, kJ/kg; andH2is the enthalpy of moist air at the WAO, kJ/kg.
1.3 C&HT system
This study mainly focuses on the combustion chamber performance in the C&HT system.Fig.2 shows that the combustion chamber consists of a corrugated cylindrical front part and a rectangular back part.The inlet diameter of the combustion chamber is 40 mm.
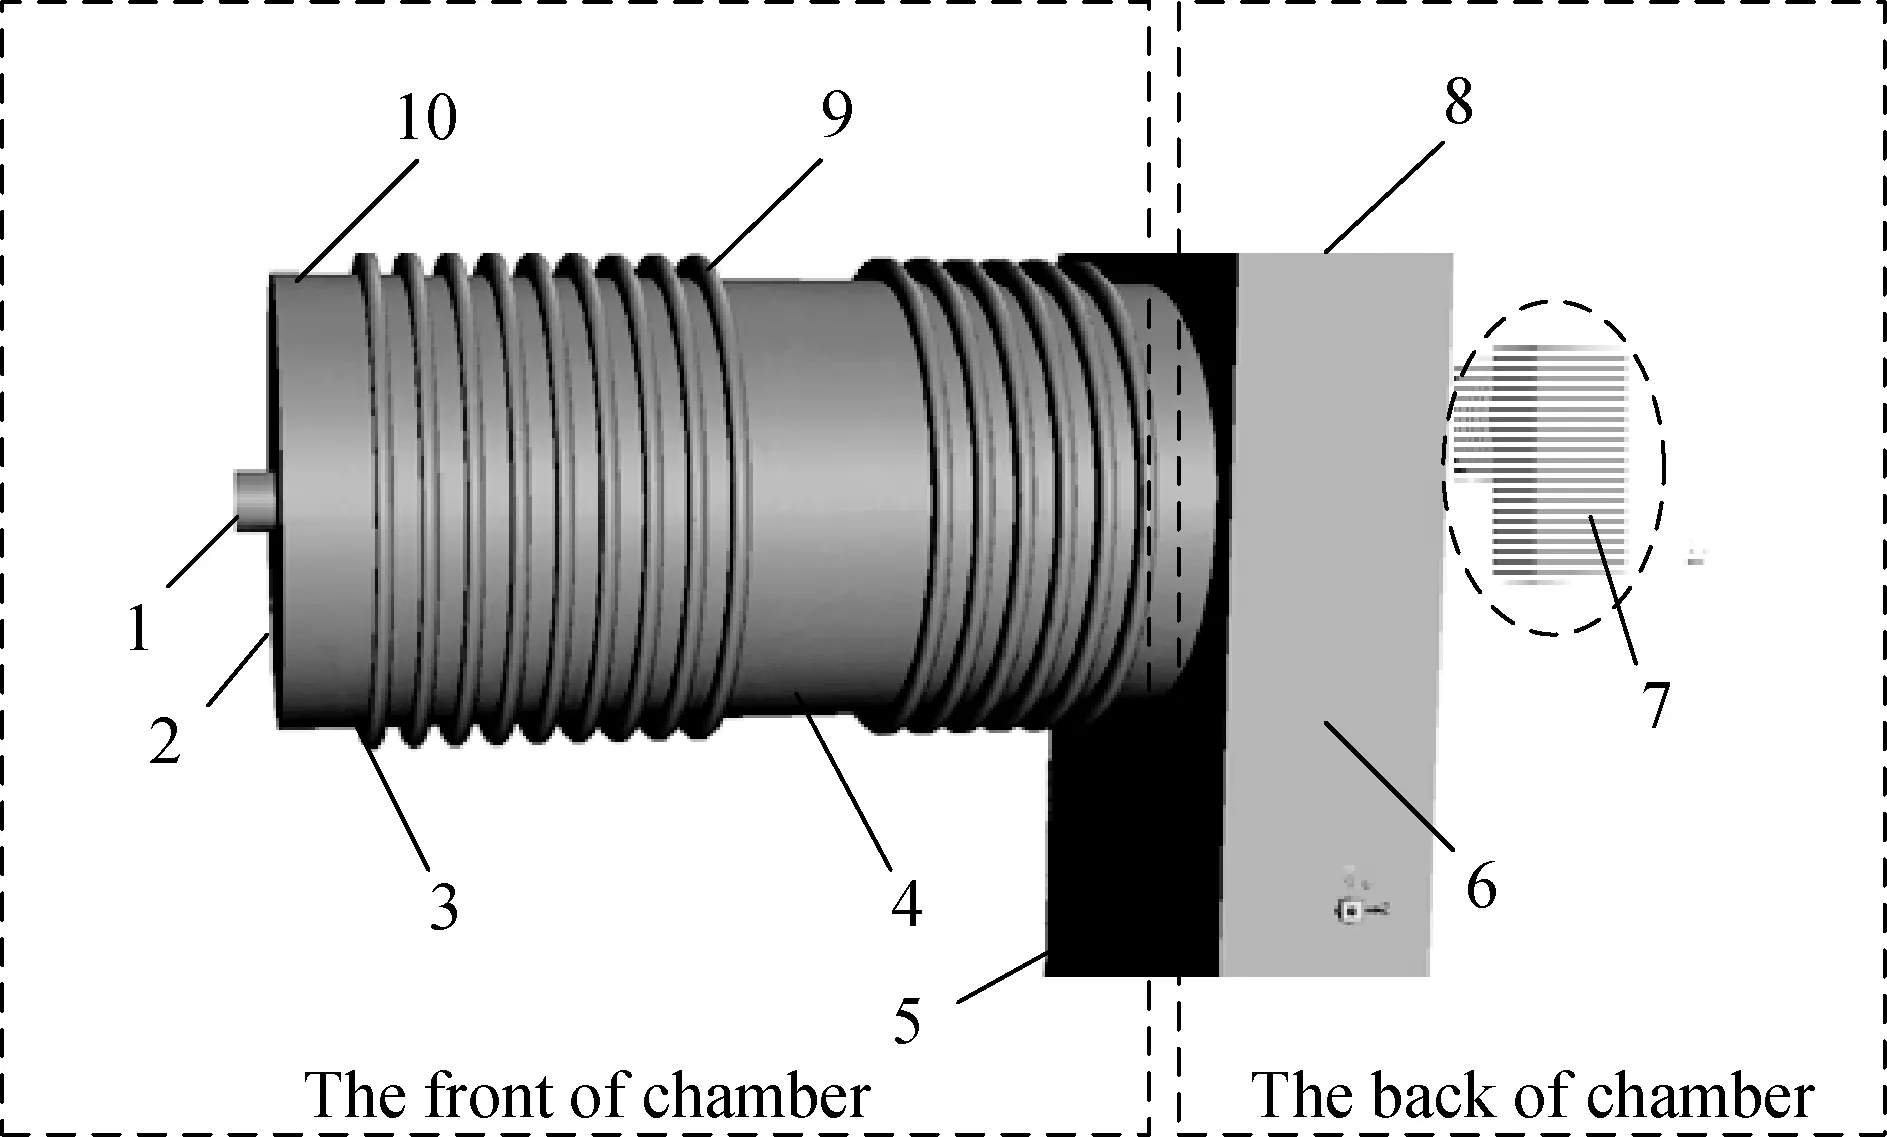
1—Front area; 2—Front face; 3—Corrugation bottom;4—Wall bottom; 5—Front; 6—Side; 7—Back;8—Upper; 9—Wall top; 10—Corrugation top
To reduce the calculation cost, the combustion simulation and heat transfer calculations were decoupled, as shown in Fig.3.In this study, the surface temperature distribution and heat transfer coefficient(h)were obtained through a hypothesis validation process.When iterationhwas conducted, the core was to use a two-dimensional(2D)simplified simulation(only convection was considered)to simulate the scene of cross-swept circulating air in the combustion chamber.First, it was necessary to set a reasonable temperature difference between the upper and lower surfaces of the combustion chamber, and the lower surface of the combustion chamber was used as a reference surface to set the boundary conditions and initial parameters of the 2D simulation.Then, the heat transfer coefficient 0 obtained by the 2D simulation was brought into the combustion simulation.The purpose of this stage is to compare whether the temperature difference between the upper and lower surfaces of the combustion chamber obtained in the combustion process is consistent with the wall temperature difference set in the previous step.When the temperature difference is consistent, the required convergencehis obtained.
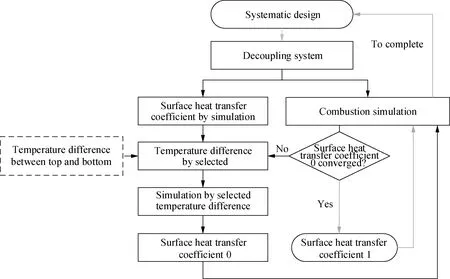
Fig.3 Flow chart of the heat transfer coefficient simulation
Fig.4 shows that the temperature of the top of the chamber is 140 K higher than that of the bottom, which is because the bottom is on the windward side and the top is on the leeward side.The upper point of the back is 120 K higher than that of the side.Based on the iteration results, the trend of the surface heat transfer coefficient of the top point slightly decreases from 12.5 to 10.8 W/(m2·K)with the increase in the bottom chamber temperature, but the value of the bottom point remains nearly constant at 22 W/(m2·K).Furthermore, the trend of the surface heat transfer coefficient of the side point slightly fluctuates near 22.9 W/(m2·K), and the value of the upper point slightly decreases from 12.5 to 11.5 W/(m2·K).
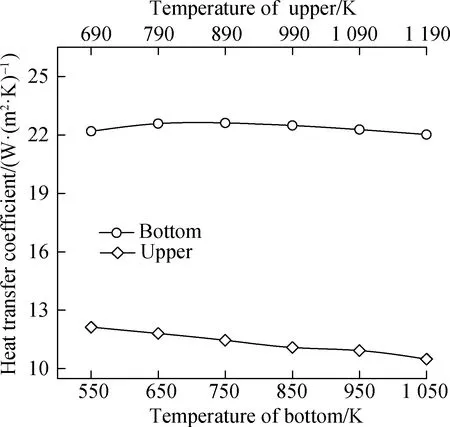
(a)
1.4 Gasification system
Several tobacco stems are discarded after leaves are reaped, which results in a waste of resources.In this study, biomass gasification technology was used as a solution.The recycled tobacco stem was gasified into syngas, which can be used as a new alternative fuel.This study mainly considered two kinds of biomass gasification methods, i.e., direct pyrolysis(SYN1)and catalytic pyrolysis(SYN2).At the same time, a new clean energy source(hydrogen)was also considered as an alternative fuel.The volume fraction of the SYN1 composition was 11.69% CH4, 44.32% CO, 40.81% CO2, and 3.18% H2, and the volume fraction of the SYN2 composition was 12.63% CH4, 53.99% CO, 28.64% CO2, and 4.74% H2.
The Wobbe index is an important index for evaluating fuel gas interchangeability.A burner can normally work within a Wobbe index ratio of ±10%.The variation trend of the Wobbe index with the volume ratio of an admixture in fuel is shown in Fig.5.Although the high heating value of hydrogen is lower than that of NG, the small density of hydrogen leads to a large volume flow per unit mass.Therefore, they compensate each other.When hydrogen and NG are mixed by the volume fraction, the Wobbe index of the mixture slightly decreases.By contrast, when the hydrogen volume ratio is 50%, the Wobbe index of the mixture is still higher than 35 MJ/m3.The Wobbe index ratio of the mixture increases in the range of 0%-14%, with the hydrogen volume ratio increasing.In addition, when the hydrogen volume ratio is in the range of 0%-35%, the Wobbe index ratio will be within the appropriate value(±10%)to meet industrial requirements.As the syngas volume ratio in the mixture of hydrogen and NG increases, the Wobbe index will decrease due to the high density of syngas, and the slope decrease is significantly greater than the slope decrease of hydrogen and NG.As a result, the Wobbe index ratio of syngas, hydrogen, and NG only meets the ratio within ±10% in the syngas volume ratio of 0%-9%, which is on a small scale.Based on the above analysis, a fixed volume proportion of syngas(5%)was selected as the component of the mixture, and the hydrogen volume ratio in the mixture was gradually increased from 5% to 15%.
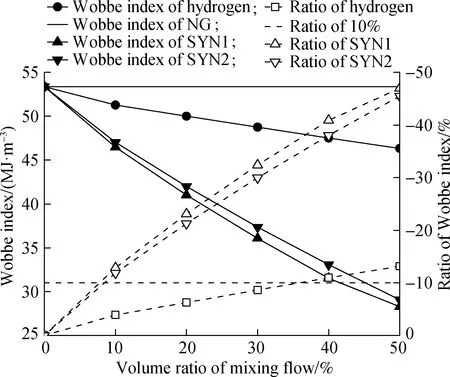
Fig.5 Wobbe index and ratio
2 CFD Models
2.1 Numerical methods
The EDC model was adopted for the combustion model of fuel gas because the EDC model has been proven to accurately predict the combustion characteristics of fuel gas[17-18].The combined effects of chemical reaction kinetics and turbulent mixing rate on the combustion rate are considered by the EDC model.It is assumed that a chemical reaction takes place in a fine-scale structure.The definition is shown as
(4)
whereζ*denotes the length fraction of the fine scale;Cζdenotes the constant volume fraction with a value of 2.137 7;kis the turbulent kinetic energy;εis the turbulent energy dissipation; andνis the kinematic viscosity, m2/s.
The realizablek-εmodel was used to treat turbulent flows, which is shown as
(5)
(6)
whereρis the fluid density, kg/m3;trepresents the time, s; ∂k/∂trepresents the local change rate of pulsating kinetic energy;ujis the velocity in the directionj, m/s;xjrepresents the spatial coordinate in thejdirection, m; ∂(kuj)/∂xjrepresents the migration and change rate of the pulsating kinetic energy;μrepresents the molecular viscosity coefficient, Pa·s;μtrepresents the viscous coefficient of the turbulence vortex, Pa·s; andGkandGbrepresent the generation of turbulence kinetic energy due to the mean velocity gradients and buoyancy, respectively;YMrepresents the contribution of the fluctuating dilatation in compressible turbulence to the overall dissipation rate;σkandσεrepresent the turbulent Prandtl numbers ofkandε, respectively.In addition, for the buoyancy shear layer with the main flow direction consistent with the gravity direction,C3ε=1; for the buoyancy shear layer perpendicular to the gravity vector,C3ε=0; for others,C1ε=1.44,σk=1.0,σε=1.2, andC2=2.0.
2.2 Reaction mechanism
The gas-phase combustion process is mainly described by the reaction rate and reaction mechanism, which can be described by either a detailed one involving thousands of basic reactions or a simplified global reaction mechanism, both of which can be mainly described by the reaction rate.In general, the detailed CFD models, including reaction kinetics, will take an unacceptable long time to solve the differential equation of the system.Therefore, it is necessary to establish simplified global or quasi-global mechanisms[19]as a solution to reduce the number of reactions required in the simulation.The breakdown of methane, carbon dioxide, and water vapor is considered, and the oxidation of carbon monoxide and hydrogen is considered.The reactions are shown as follows.In addition, the reaction kinetics of the equations are shown in Tab.2.WhenMis diatomic molecules(e.g., H2, O2, CO, and N2),α=1.2.WhenMis C2H6, CH4, or H2O,α=6.5.Ais the preexponential factor;nis the reaction order;Eis the activation energy, J/mol;Ris the global gas constant, J/(mol·K); andTis the reaction temperature, K.The value in the square brackets represents the concentration of the substance to be measured.

Tab.2 The reaction kinetics of the equation

(7)

(8)

(9)

(10)

(11)
In general, the formation modes of NOXmainly include a thermal NOX, prompt NOX, fuel NOX, and N2O-intermediate.In the NG combustion process, the formation mechanisms of the thermal NOX, prompt NOX, and N2O-intermediate were mainly analyzed.The formation mechanism of NOXis shown as follows.The formation of NOXinvolving very complex chemical reactions will form more intermediate products.In addition, the prompt NOXwas mainly produced by burning in a fuel-rich environment, and nitrogen radicals will only generate NOXinstead of nitrogen where the oxygen concentration is high.

(12)

(13)

(14)

(15)

(16)

(17)

(18)

(19)
2.3 Calculation method
In this study, the 3D combustion chamber model(see Fig.2)was established by ANSYS Design Modeler and simulated by Fluent19.0.The 2D combustion chamber model is shown in Fig.6.The coupling situation of the pressure and velocity was solved by a simple algorithm.The momentum, energy, gases(CH4, CO, CO2, H2, H2O, O2, and N2)and NOXpollutants were discretely solved in the double-precision second-order upwind scheme.Heat transfer was performed via convection(gravity was considered)and radiation(discrete ordinate method and weighted-sum-of-gray-gases model).The discrete ordinate method was discretized using the first-order upwind scheme.The mass flow inlet boundary condition and outflow boundary condition were adopted in the model.The mass flow rate is 0.023 4 kg/s, and the internal emissivity is 0.85.Moreover, the turbulent intensity is 4.7%, and the hydraulic diameter is 80 mm, whose calculation method is shown as
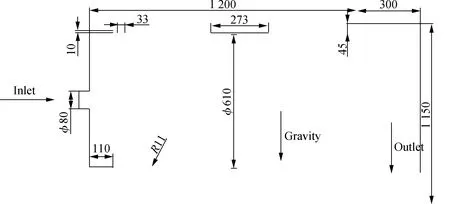
Fig.6 2D combustion chamber model(unit: mm)
(20)
whereIis the turbulent intensity;u′ is the ratio of the root mean square of the velocity fluctuations;uavgis the mean flow velocity; andReis the Reynolds number of the fluid.The detailed boundary conditions are shown in Tab.3.
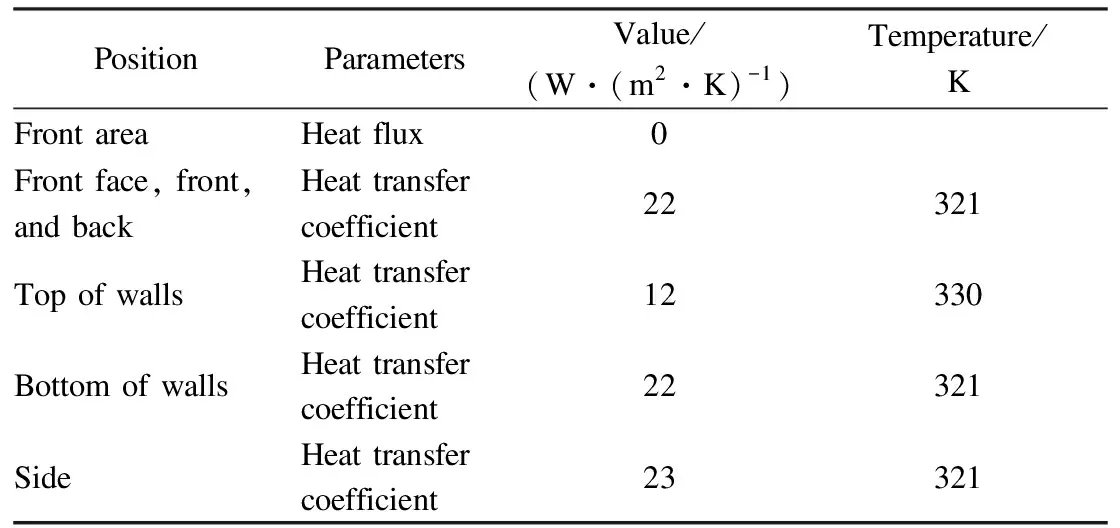
Tab.3 Summary of the wall boundary conditions
2.4 Model validation
Based on the experimental data of Refs.[11,20,21], the numerical models used in the simulation process were compared and analyzed.According to the NOXcomparison data in the figure, the NOXemission obtained by the simulation is close to the test result of Okafor et al.[20], and the obtained error is less than 3×10⁻⁵.As Cellek et al.[11]has adopted measures such as swirling to reduce NOXemissions, the data obtained from the simulation are slightly higher than the results measured by Cellek et al[11].The comparison data of CO emissions in Fig.7 show that the error between the simulated CO emissions and the results of Ref.[20]is smaller than 2.2×10⁻⁵, whereas the corresponding CO emissions of Ref.[21]are also large due to the great combustion power.
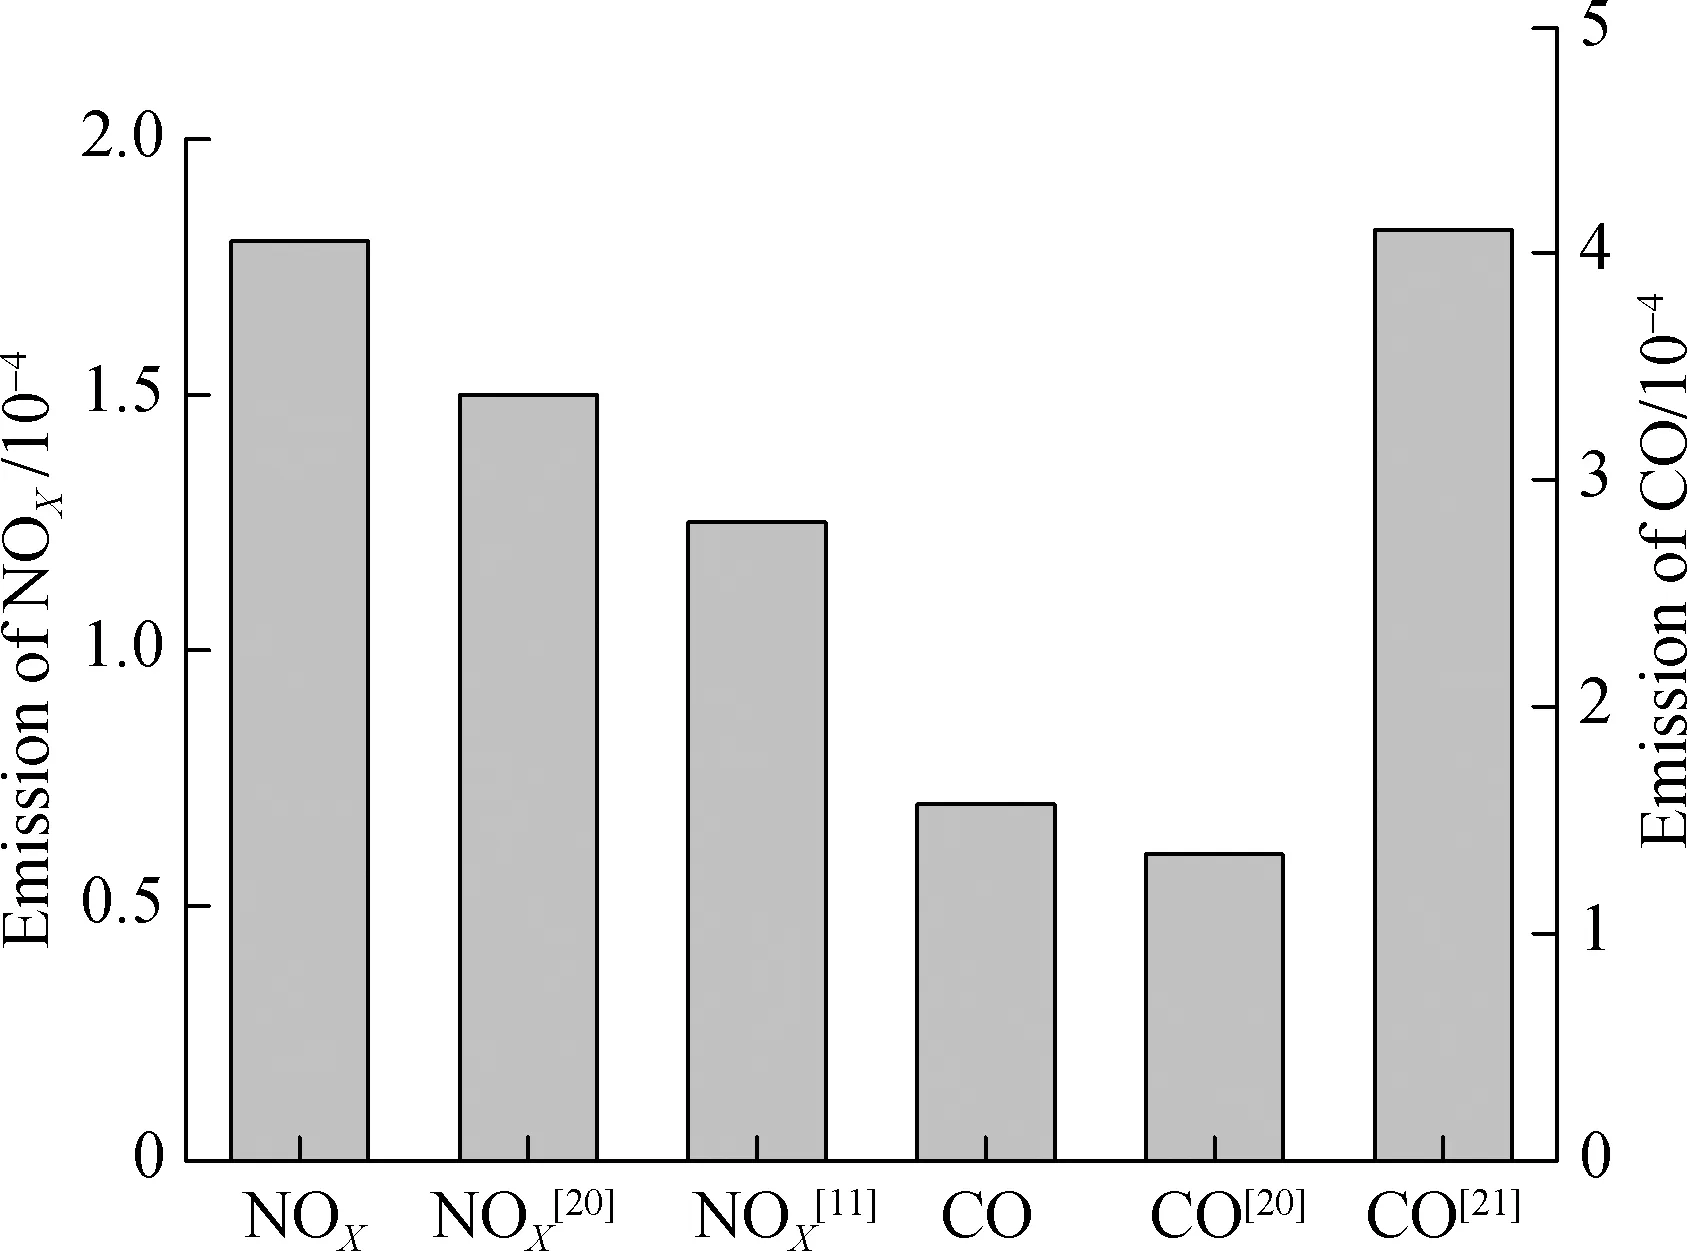
Fig.7 Validation of the model
A mesh sensitivity study for the simulation models was made to verify the important characteristics that impact the fuel combustion performance, as shown in Fig.8.
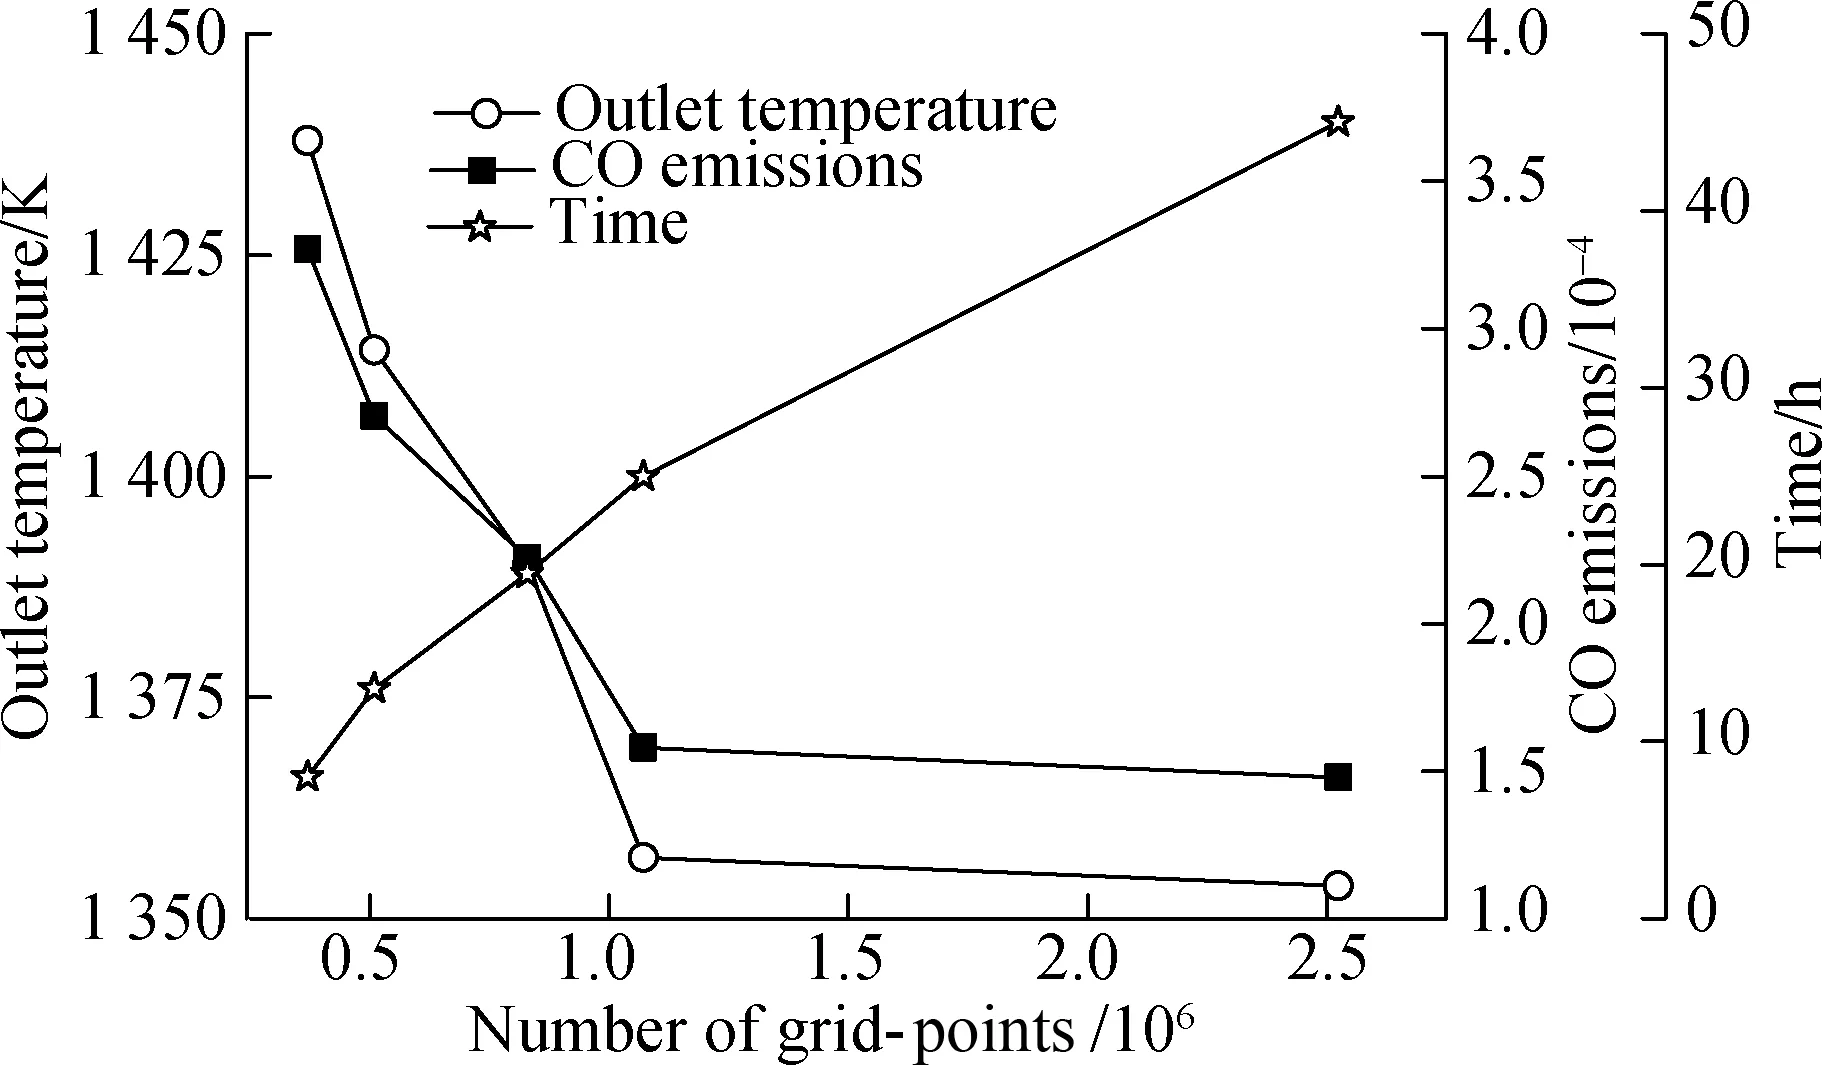
Fig.8 Grid independence test
This was conducted using five grids consisting of 369 468, 509 332, 829 171, 1 071 576, and 2 524 052 cells.The outlet temperature, CO emission, and time of simulation were selected to verify the grid independence.Clearly, the time of simulation rapidly increases with the cells increasing.The outlet temperature and CO emission between 1 071 576 and 2 524 052 cells are essentially in agreement.The outlet temperature values vary by 0.2% between 1 071 576 and 2 524 052 cells and by 2.4% between 1 071 576 and 829 171 cells.Compared to 2 524 052 cells, the CO emission value varies by 6.4%.However, the CO emission values vary by 40.6% between 1 071 576 and 829 171 cells.Therefore, the 1 071 576 cells were selected for the simulation to reduce the time of the simulation.
3 Results and Discussion
In this section, the simulation results of different fuel combustion mixtures are introduced according to industrial design rules, heat calculation requirements, and simulation.The details are as follows: 1)The power of the tobacco curing system is always guaranteed at a constant 60 kW.2)The combustion of NG with different syngas and hydrogen addition rates was simulated, and the various properties of emissions and temperature were also obtained.3)The combustion of NG with pure hydrogen was simulated, and the emissions and temperature were also obtained.4)The thermal characteristics of NG mixed with different fuel proportions were compared and analyzed.
3.1 Combustion of NG, syngas, and hydrogen
The direct pyrolysis of syngas(SYN1)and catalytic pyrolysis of syngas(SYN2), whose heating values were lower, and H2were chosen as the alternative fuels.The volume ratios of H2were 5%, 10%, and 15%, to achieve the desired Wobbe index of the mixture(NG and syngas).The syngas volume ratio(SYN1 or SYN2)was selected as a fixed value(5%), and the details of the mixtures are shown in Tab.4.VNG∶VSYN∶VH2represents the ratio of the volume fractions of NG, syngas, and H2.The syngas type in the mixture is SYN1 from case 1 to case 4, and that of the others is SYN2.Clearly, the LHV(kJ/kg)of mixture 2(composed of SYN2)is higher than that of mixture 1(composed of SYN1)because the CO mole fraction of SYN2 is higher than that of SYN1.

Tab.4 LHV of fuel mixtures and inlet boundary conditions
The combustion, emissions, and heat transfer characteristics of mixture 1 and mixture 2 were investigated.The difference in thermal characteristics between mixture 1 and mixture 2 was also examined, considering the differences in the CO concentrations.
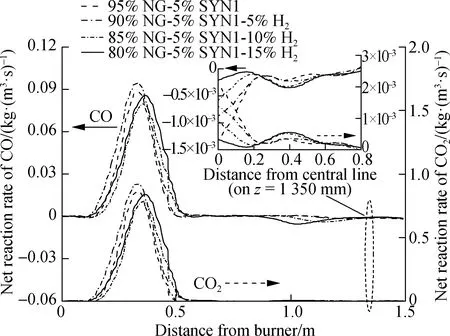
Fig.9 shows the reaction rates of CO and CO2in the combustion chamber.As shown in Fig.9, the rate curve trends of CO and CO2are very similar, and both of them reach the peak atz=0.25-0.4 m.This is because the concentrations of O2and CO were high beforez=0.3 m, and the oxidation rates of O2and CO will be at a higher level.When the hydrogen ratio is 0%-5% and 10%-15%, the peak values of CO and CO2will rise with the increase in the hydrogen ratio in mixture 1.When the hydrogen ratio is 5%-10%, the peak values of CO and CO2decrease with the increase in the hydrogen ratio, and with the proportion of hydrogen addition, the peak reaction rate of CO decreases by 9.5%, and that of CO2decreases by 11%.This result indicates that the hydrogen addition can reduce the peak of the CO(CO2)rate.Combined with Fig.9(b), the peak net reaction rates of CO and CO2(mixture 2)show an upward trend as the proportion of hydrogen in the fuel increases, which is different from that of mixture 1.In addition, the peak net reaction rate of mixture 2(i.e., 95% NG and 5% SYN2 CO)is lower than that of mixture 1(i.e., 95% NG and 5% SYN1).Evidently, the peak reaction rate of CO(CO2)drops as the CO concentration increases in the fuel.
(a)
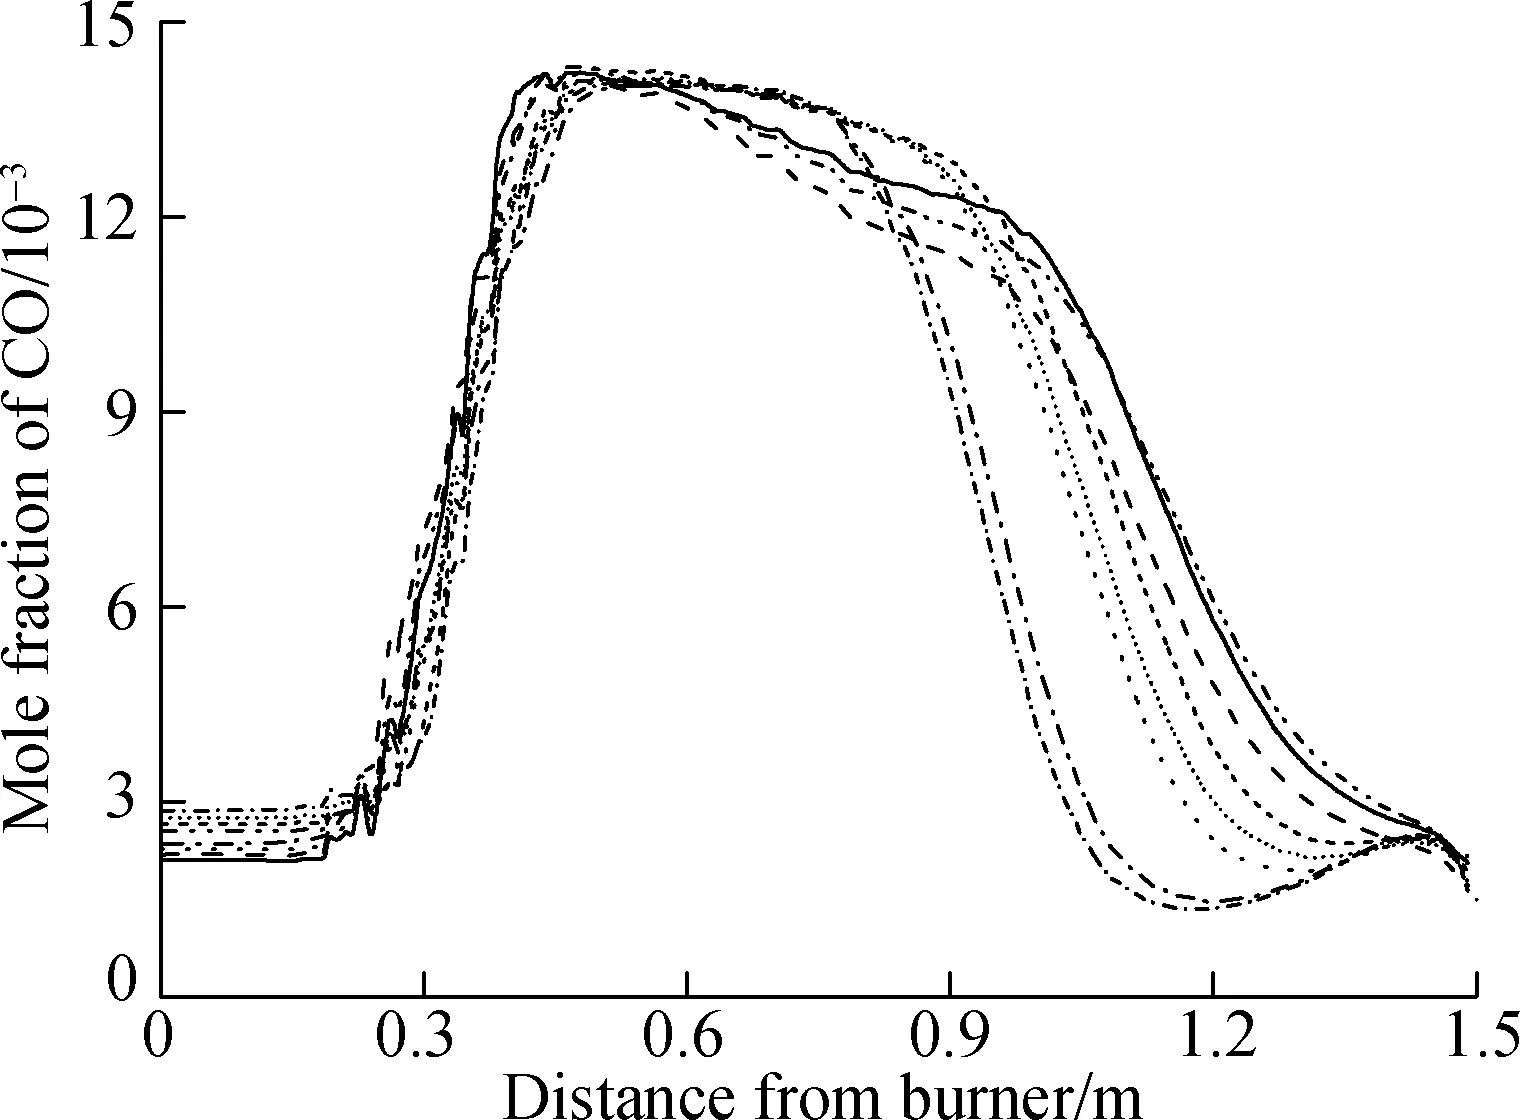
Fig.10 shows the curve of the CO(NO)concentration and temperature along the center line of the combustion chamber.The peak of CO concentration, which reached between 450 and 750 mm, arrived earlier than that of NO, which reached approximately 935 mm.With the increase in CO concentration in the fuel, the peak of CO concentration(mixture 2)was earlier than that of mixture 1.As depicted in Fig.10, the peak of CO(NO)concentration is positively correlated with the high-temperature region(2 000 K and above).With the increase in H2concentration in the fuel, the peak of CO concentration first increases and then decreases, which forms a critical point for reducing emissions.This finding shows that the increase in H2concentration can only reduce the peak of CO emission to a certain extent.After the critical point, the increase in H2concentration(10%, 15%)cannot effectively reduce the peak of CO emission.Moreover, the increase in CO concentration in the fuel(mixture 2)can reduce the peak of CO emission to some extent.
(a)
Fig.11 illustrates the outlet emissions and temperature of the combustion chamber.The maximum combustion temperature and outlet temperature of mixture 1 and mixture 2 both tend to increase as the hydrogen proportion increases.This is because the calorific value per unit mass of hydrogen is higher than that of NG, and the combustion of hydrogen will release a lot of heat.When the hydrogen ratio was increased from 5% to 15%, the outlet temperature of mixture 1 and mixture 2 increased by nearly 26 ℃, and their maximum combustion temperature increased by nearly 40 and 35 ℃, respectively.In the premixed combustion, due to the increase in the H2content in the fuel, the combustion temperature of the combustion chamber rose, and a large amount of thermal NO was generated when the flue gas stayed in the high-temperature area.Therefore, the increase in hydrogen concentration will increase the NO emissions.When the fuel ratio of mixture 1 was 95% NG-5% SYN1, the growth rate of the NO emission was the largest.By contrast, when the fuel ratio of mixture 2 was 95% NG-5% SYN2, the NO emission growth curvature was smaller.As the hydrogen content in mixture 2 increased, the curvature of NO emission greatly increased when mixture 2 was at a fuel ratio after 95% NG-5% SYN2.Compared with the CO emission of mixture 2, because the calorific value of mixture 1 was lower than that of mixture 2, the CO emission of mixture 1 did not increase even if its content was increased within the H2ratio of 0%-10%.
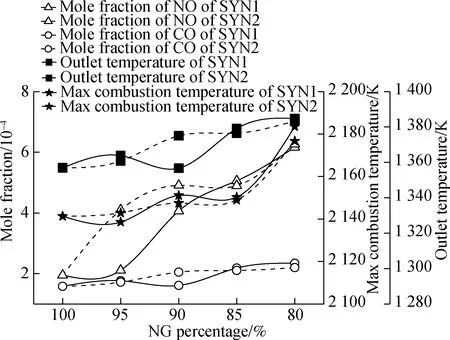
Fig.11 Outlet emissions and temperature of the combustion chamber
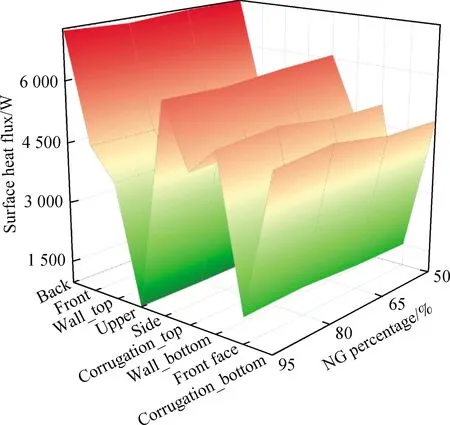
Due to the different geometrical shapes and boundary conditions, the heat transfer characteristics on the surfaces are also different.Fig.12 shows that the maximum heat flux on the combustion chamber surface(back)can reach 7 198 W, and the upper has the lowest heat flux among all surfaces.With the increase in H2concentration in the fuel, the heat flux of each surface presents an overall upward trend.When the CO concentration in the fuel increases, the heat flux is higher(>3%)than that of mixture 1, and the maximum heat flux occurs at the back among all surfaces, which reaches 7 216 W.
(a)
Therefore, the increase in CO and H2concentrations in the fuel can promote the surface heat transfer ability.However, due to the impact of cryogenic fluid at the bottom of the combustion chamber, the temperature of corrugation_bottom and wall_bottom was low.On the contrary, the temperatures of upper, wall_top, and corrugation_top were higher because they were on the leeward side.Particularly, the increase in CO concentration in fuel can significantly reduce the temperature fluctuation.
3.2 Combustion of NG and hydrogen
In this study, by simulating the mixed combustion of NG and pure hydrogen, the performances of the mixed combustion of NG, syngas, and hydrogen were compared.The LHV(kJ/kg)and inlet boundary conditions are shown in Tab.5.Because of the high LHV of hydrogen, the LHV of the mixture increased when H2was mixed with NG.

Tab.5 LHV of the fuel mixtures and inlet boundary conditions
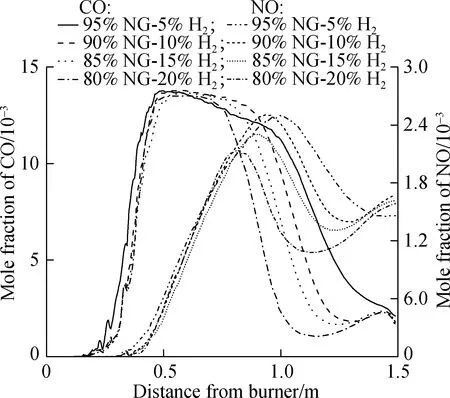
Fig.13 shows the variation curve of the CO(NO)emission and temperature in the combustion chamber.As shown in Fig.13, with the increase in H2concentration, the peak concentration of NO is almost unchanged, but the range of high concentration is shrinking.Evidently, the NO emission presents an upward trend with the increase in the H2proportion, but the formation rate of the NO concentration in the mixed(NG and pure hydrogen)combustion is slower than that of the mixture containing syngas.
(a)
With the increase in H2concentration, the proportion of C/H decreases, which results in a decrease in the peak concentration of CO emission in the combustion chamber.Clearly, the overall emission of H2tended to decrease.Compared with the emission of the mixture containing syngas combustion, the NG mixed with pure hydrogen combustion has a lower CO emission.
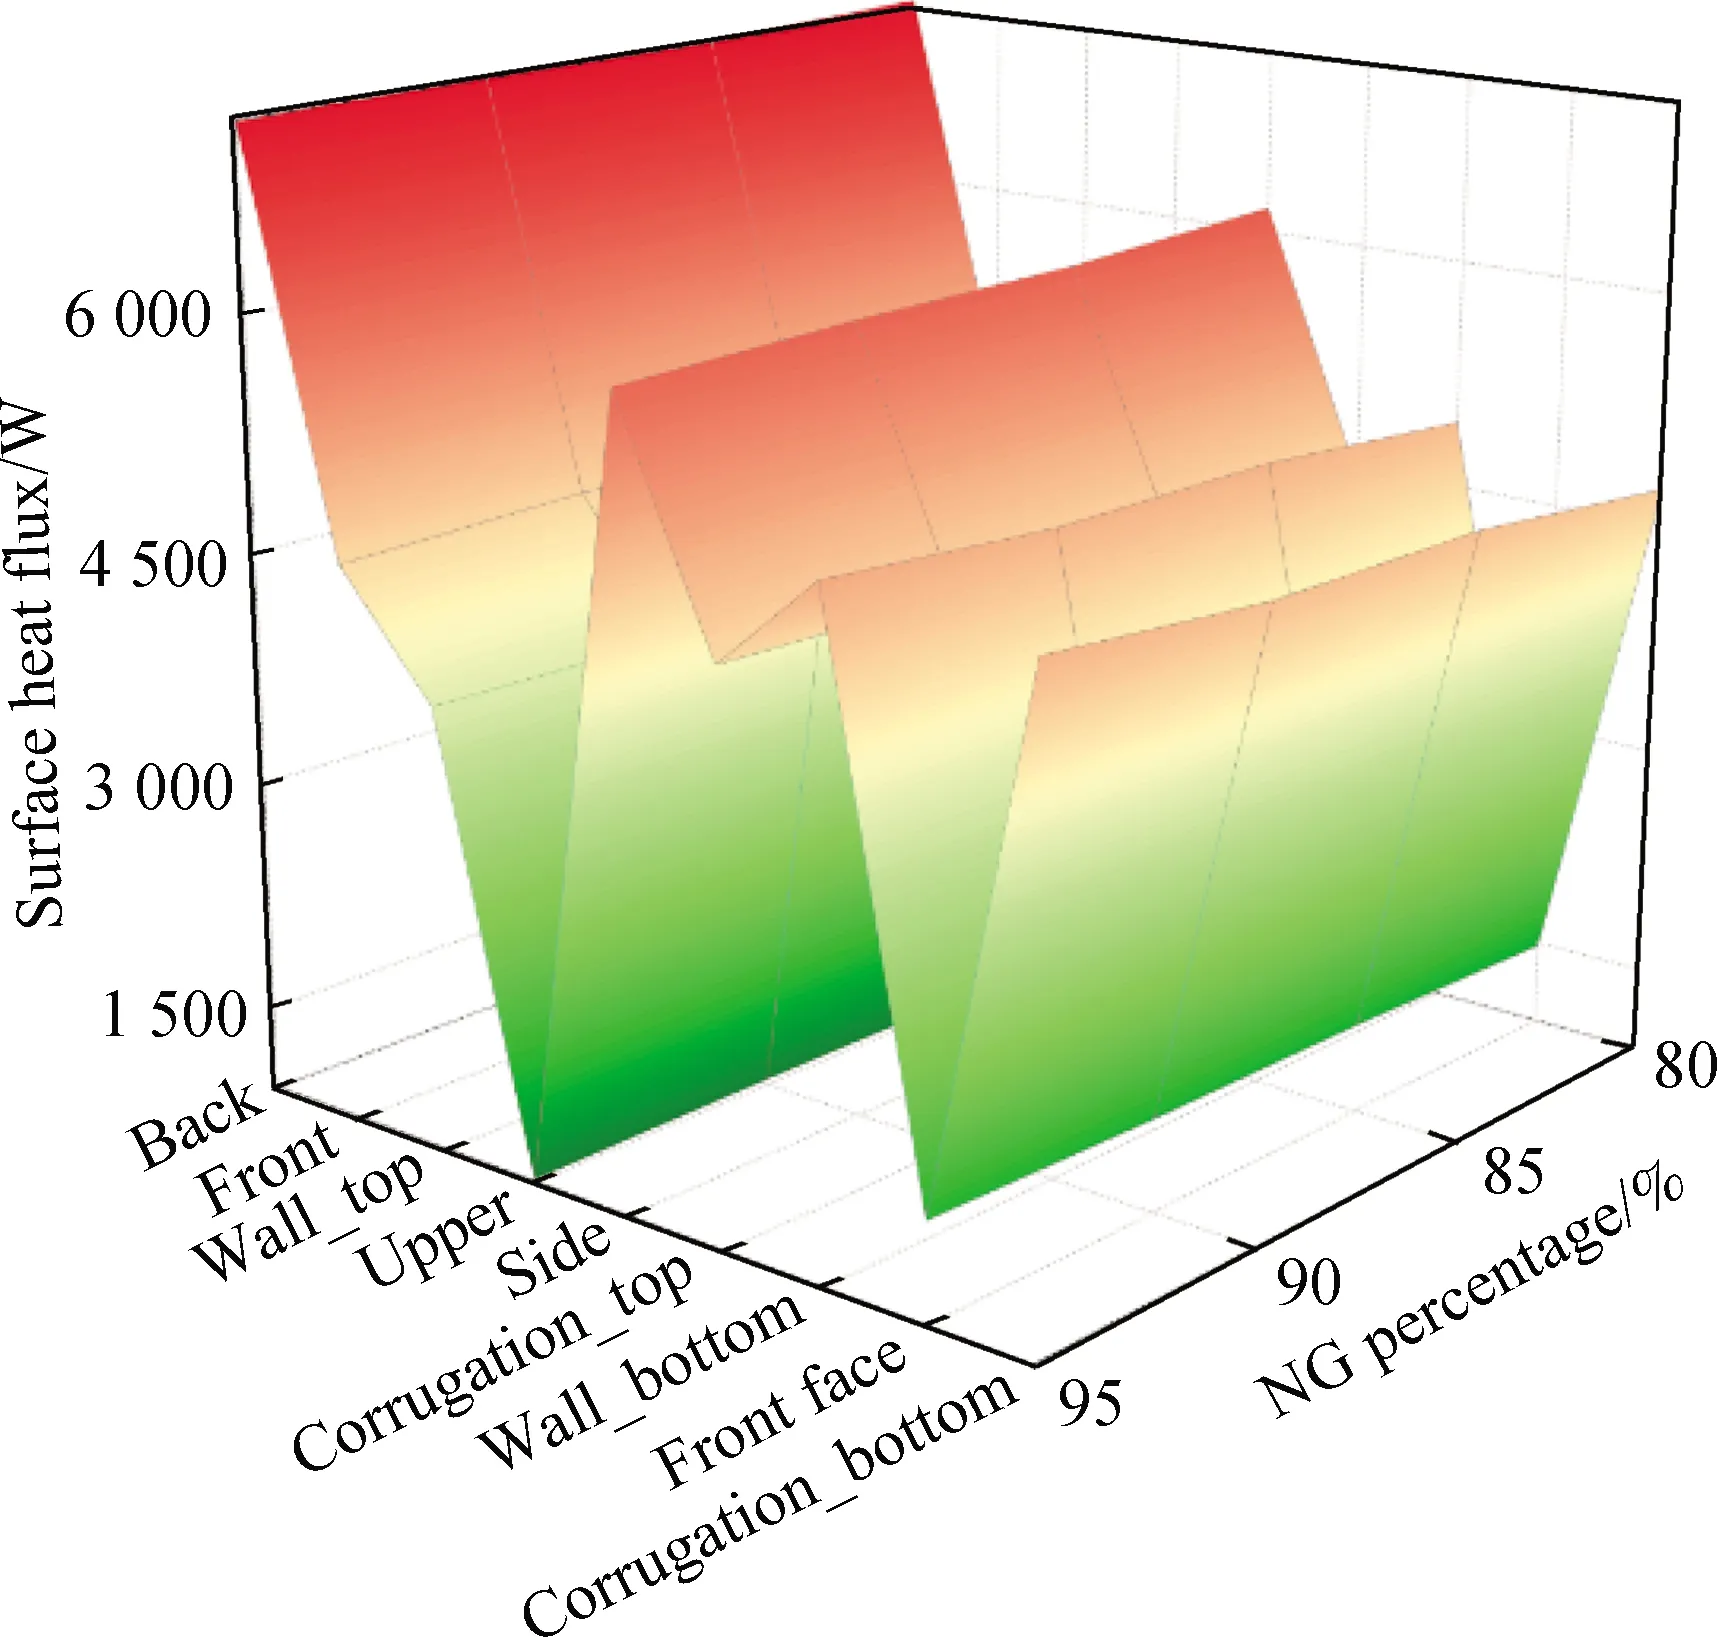
Fig.14 shows the distribution of the surface heat flux and temperature in the NG mixed with pure hydrogen combustion.The surface heat flux of the NG mixed with pure hydrogen combustion is higher(0.7%)than that of the mixture containing syngas.The combustion of NG mixed with pure hydrogen also reduces the temperature fluctuations on the surface due to the change in the hydrogen ratio.At the same time, the combustion of NG mixed with pure hydrogen has a higher surface temperature up to 731 K at the back than that of mixture 1(727 K)and mixture 2(728 K).However, when NG mixed with pure hydrogen is burned, the minimum surface temperature of the combustion chamber is lower than that of the others.
(a)
3.3 System performance evaluation
Case 1, case 2, case 3, case 4, case 9, and case 10 were selected to compare the system performance with the original NG curing system.The comprehensive performance evaluation of the system is shown in Tab.6.The total cost consists of fuel cost, electricity cost, and labor cost.The NG consumption of case 1 increased by 3.41% as compared to the NG system, and the cost per kilogram of fuel-cured tobacco for case 1 is 2.92% higher than that of the NG system.However, the cost of other cases is lower than that of the NG system.Particularly, the cost of case 4 is 12.52% lower than that of the NG system.In addition, the CO emission of case 4 is only 1.92% higher than that of the NG system; the CO emission of case 9 and 10 is 9.39% and 16.72% lower than that of the NG system, respectively; and the CO emission of the other systems is more than 10% higher than that of the NG system.Nonetheless, with the increase in the hydrogen volume ratio, NO emissions are far beyond the acceptable range.In general, case 2 and case 9 perform better overall than NG and other systems.

Tab.6 Comprehensive performance evaluation of the system
4 Conclusions
1)The peaks of CO and NO concentrations are positively correlated with the high-temperature region, which is approximately 2 000 K and above.
2)The increase in H2concentration in the fuel increases the NO emissions and decreases the CO emissions on the whole.There is a critical point(5%-10% H2addition)where the increase in H2concentration can reduce CO emissions in the case of mixture 1.
3)The combustion of NG and pure hydrogen has lower CO emissions than that of the mixture containing NG, H2, and syngas.However, the NO emissions of NG mixed with pure hydrogen combustion are higher compared to the mixture with NG, H2, and syngas.
4)The increase in CO concentration in the fuel makes the surface temperature fluctuate less, and when NG is only combusted with pure hydrogen, the surface temperature distribution is extremely uneven.However, NG and pure hydrogen combustion have a higher surface heat transfer ability, followed by fuel with a higher CO concentration.
5)Compared with the NG system, case 2 and case 9 have a better comprehensive performance.The cost per kilogram of fuel-cured tobacco for case 2 and case 9 is 2.24% and 5.04% lower than that of the NG system.The CO emission of case 2 is similar, whereas the CO emission of case 9 is 9.39% lower than that of the NG system.
杂志排行
Journal of Southeast University(English Edition)的其它文章
- Multi-head attention-based long short-term memory model for speech emotion recognition
- Graph-enhanced neural interactive collaborative filtering
- Path prediction of flexible needles based on Fokker-Planck equation and disjunctive Kriging model
- Mapping relationship analysis of welding assembly properties for thin-walled parts with finite element and machine learning algorithm
- Dependency-based importance measures of components in mechatronic systems with complex network theory
- Simulation analysis of significance and interaction of influencing factors on mixing uniformity of double-drum recycling mixing plant
