A nonlinear wave coupling algorithm and its programing and application in plasma turbulences
2022-06-29YongShen沈勇YuHangShen沈煜航JiaQiDong董家齐
Yong Shen(沈勇) Yu-Hang Shen(沈煜航) Jia-Qi Dong(董家齐)
Kai-Jun Zhao(赵开君)4, Zhong-Bing Shi(石中兵)1, and Ji-Quan Li(李继全)1
1Southwestern Institute of Physics,Chengdu 610041,China
2School of Information and Communication Engineering,University of Electronic Science and Technology of China,Chengdu 611731,China
3Institute for Fusion Theory and Simulation,Zhejiang University,Hangzhou 310013,China
4College of Nuclear Science and Engineer,East China University of Technology,Nanchang 330013,China
Keywords: bispectral analysis,wave coupling,algorithm,plasma turbulence,energy cascade
1. Introduction
Digital bispectral analysis method can be applied to the studying of fluid turbulence,[1]plasma saturated turbulence,[2–5]and other nonlinear systems,which has proved to be a very important data analysis technology in practice. In the late 1980s, Ritzet al. studied this problem and presented an algorithm using bispectral analysis technique.[6–8]In the Ritzet al.’s method the iterative technique is used to solve the wave coupling equation, but the fourth-order moment in the equation is approximated by a second-order moment. The input signals can be non-Gaussian signals or Gaussian signals.The typical application of this method is to deal with the transiting flow.[7]Using the Ritzet al.’s algorithm,one can use experimental turbulence data to quantitatively estimate nonlinear coupling coefficients or estimate the magnitude of energy cascades between waves in a fully developed turbulence system.However, because in the Ritzet al.’s method, the authors did not take into consideration the non-ideal fluctuations,the calculation results tend to have large systematic errors and often produce large non-physical damping coefficients.
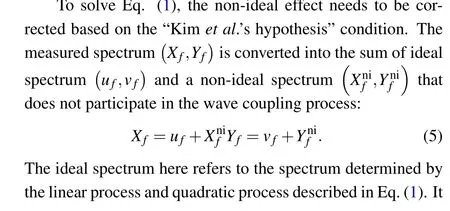
In order to make up for the defects of Ritzet al’s method,Kimet al. reconstructed the power spectrum by retaining the role of the fourth moment and proposed Kimet al.’s algorithm in 1996,[9]where the spectrum is divided into ideal spectrum component and non-ideal spectrum component,and the spectrum components directly related to the quadratic nonlinear interaction are called ideal spectrum, while the non-ideal spectrum does not participate in the linear coupling process nor the tree-wave coupling process. Kimet al.’s method imposes a time-static condition of “input ideal spectral power equals output ideal spectral power”to include an assumption of local homogeneity.
Nevertheless, in some nonlinear systems such as developing turbulent systems such as shallow ocean waves,the assumption of Kimet al.’s algorithm may not hold. In such systems, forcing the power of the input spectrum to equal that of the output spectrum would lose a lot of valid information.In this respect,Kim proposed the linear regression method and successfully solved such problems.[10]In the process of studying such systems, in Ref. [11] the authors proposed another new digital bispectral analysis algorithm — complete iterative method—to calculate and analyze the three-wave interaction inside the developing turbulence. The complete iteration method is an extension of Ritz method,while it contains the effect of the fourth moment in the wave coupling equation, so that all the wave information has been considered.In Ref.[11],the applicability of complete iterative method in fluid turbulence was discussed in detail,however,the application prospect of this method in plasma has not been analyzed yet. Subsequently, the study of Ref. [12] focused on this issue and made the comparative analysis of the performance of the complete iteration method and Kim method, and studied the applicability of these two mainstream algorithms in edge plasma turbulence spectrum analysis. The results show that the spectral characteristics of edge plasma turbulence are different from those of fluid turbulence. That is,in the edge plasmas,the energy mainly concentrates in the low-frequency region, and the high-order coupling may occupy a certain proportion, which needs to be eliminated from the three-wave coupling effect,which can be done by employing the Kim hypothesis.
According to the above results,Kim’s algorithm is shown suitable to be used in the study of edge plasma turbulence.It is of significant importance for the study of the energy transfers occurring in fully developed turbulent system due to nonlinear properties of the flows, and the wave coupling equation describing the changes of spectral components has representative significance in such nonlinear systems. However,none of the previous studies has involved the specific program implementation with respect to this algorithm,although it is indeed an important topic. Shenet al. carried out this kind of work in advance.[13,14]In Ref. [14], an algorithm and its programing for solving the wave coupling equation were presented,while the algorithm still belongs to a kind of linear regression analysis methods,therefore,its structure turns relatively complex. In this work, an algorithm and program based on Kimet al.’s method are developed to solve the nonlinear wave coupling equations, in which the Kim’s hypothesis is completely adopted. The algorithm has simpler structure and higher precision. This work focuses on realizing the idea,the programming and simulation-verifying the algorithm,thereby improving the work of Ref. [11] and providing a feasible software tool for studying the plasma turbulence.
2. Modeling and algorithm implementation
2.1. Physical and mathematical model
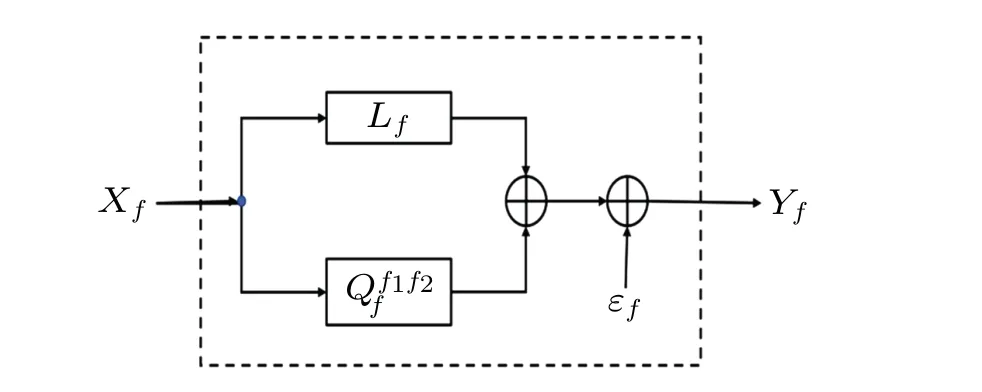
In sea waves and some other wave systems, the input and output signals are given, and the output signals can be generated through linear transformation process and nonlinear transformation process.[15,16]Such a system can be seen as a “black box”. If only linear transformation process and quadratic nonlinear transformation process are considered,and the cubic and higher order nonlinear processes are weak,the nonlinear system can be expressed by the following nonlinear transfer equation:
On the other hand,in order to quantitatively estimate the linear growth rate of fully developed turbulence and the energy cascade between waves,we consider the nonlinear drift wave coupling equation in the following form:

2.2. Solution algorithm
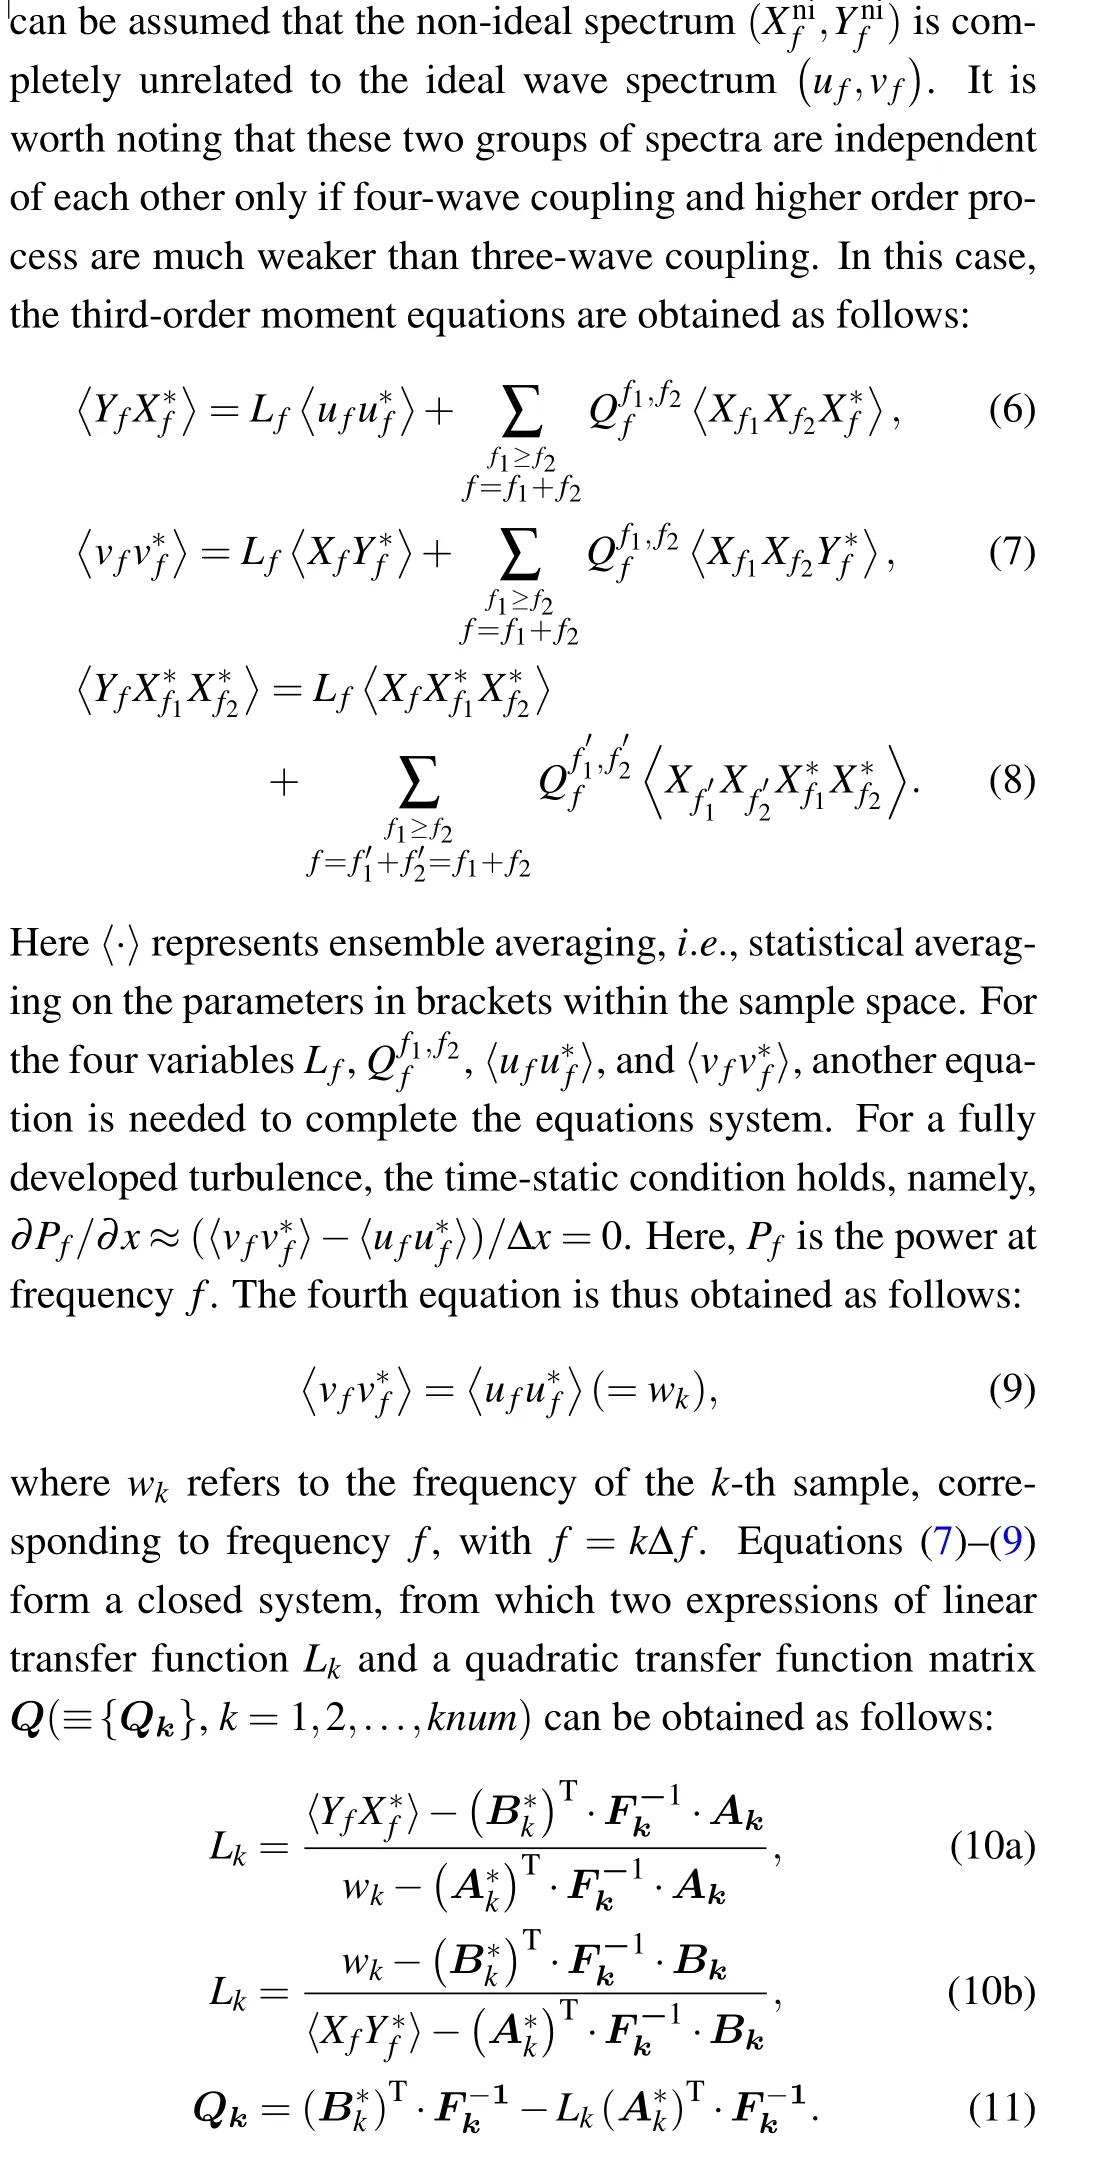
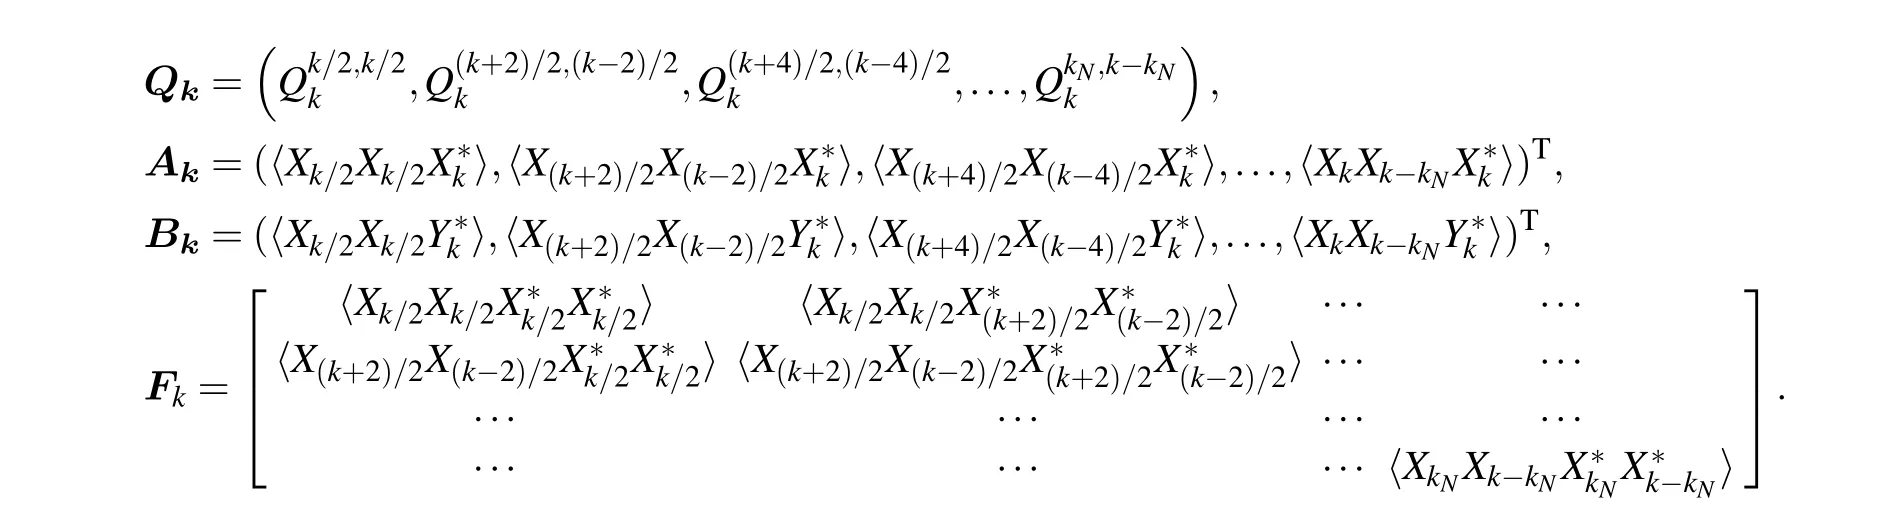
Here,the vectors and matrices involved are defined by
And here,we have definedf=H(k),whereHis a linear function andkis a constant number.That is,kis used as an index of frequencyf,and is always an integer. In fully developed turbulence,it is approximatelyf ≈kΔf,andγk ≈(|Lk|2-1)/Δx.
2.3. Programing
The programing flow of the specific algorithm is as follows.
Algorithm: Solver of wave coupling equations
Step 1 Original data: input signalx(t,x),y(t,x);
Step 2 Pre-process:
Step 2.1 Defining and inputting assemble number (n),sample number(num),
Step 2.2 Performing Fourier transform on original data so as to get the source data set of input and output signal spectraXiandYi,i=1,2,...,N;
Step 3 Fork=-num/2 tonum/2-1,the following steps are executed:
Step 3.1 Calculating all groups (k1,k2) that satisfy the condition‘k1+k2=k’,and saving the group number asknum,
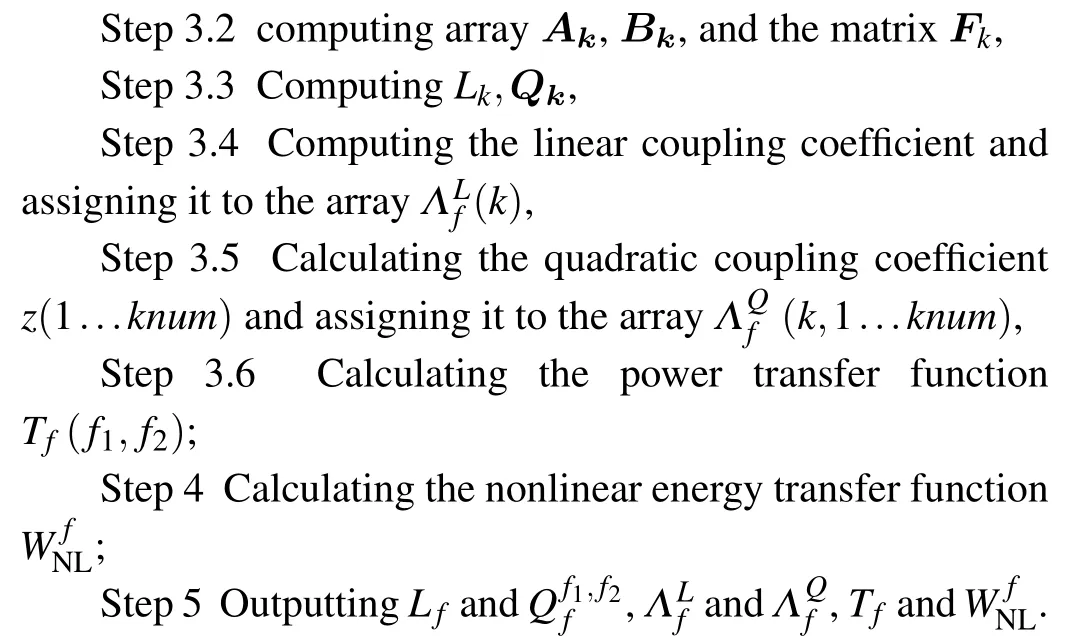
Here two issues need to be addressed. First,the parametersk,k1andk2should meet the three-wave coupling conditionk=k1+k2,and the determination of these indicators is one of the basic points for this program.[14]Secondly, the ensemble number(n)and sample number(num)should be big enough to ensure the accuracy of spectrum estimation. In a fully developed turbulence system,n ≥1000 andnum ≥64 are generally taken,and the number of samples overlapped for each realization segment takesnp~num/2, or the total number of sampled data meets the conditionn×(num-np)+np >3×10⁴.Also,nummust be an exponential multiple of 2; or, in the Fourier transform,fill some numbers‘0’in sample data set to meet this requirement.
The pre-processing of input and output data is described below. Taking the study of edge plasma turbulence in tokamak for example,[13]we take the float potentials as the original signals,obtaining at two adjacent spatial points in poloidal direction during the period of[600,700]ms in an experimental discharge, with a sampling frequency of 1 MHz and thus the Nyquist frequency of 500 kHz. There are two groups of sample data. The first set of data (corresponding to the first spatial point) serves as the input signal and the second set (corresponding to the second point) as the output signal. We can take 780 realizations(n=780)and 256 samples(num=256) for each realization. It is worth noting that the sampled data need to be partially overlapped. The number of overlapping samples for each realization can benp=128,thus the total number of source data required for each channel is(num-np)+np=99968<105; and it is obvious that the practically total number of sample data can meet this requirement. Subsequently, the Fourier transform can be performed on the data for each realization to obtain the input and output signal spectra,which will be used as the input and output data in the program.
The third step is the core of the program,which is actually the solver for Eq.(1)or Eq.(1a). In addition,if the program is used for energy transfer analysis of turbulence,it is necessary to calculate nonlinear energy transfer function,that is,
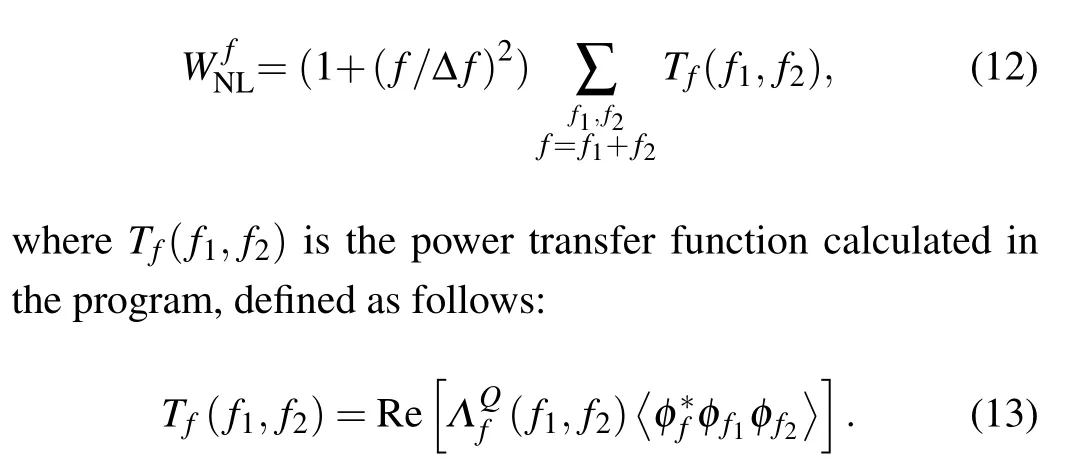
The power transfer function represents the power change in the wave with the frequencyfin the wave coupling process(f=f1+f2). The nonlinear energy transfer functionW fNL represents the variation of the nonlinear energy of wave with frequencyf.
3. Simulation
3.1. Simulation data generation
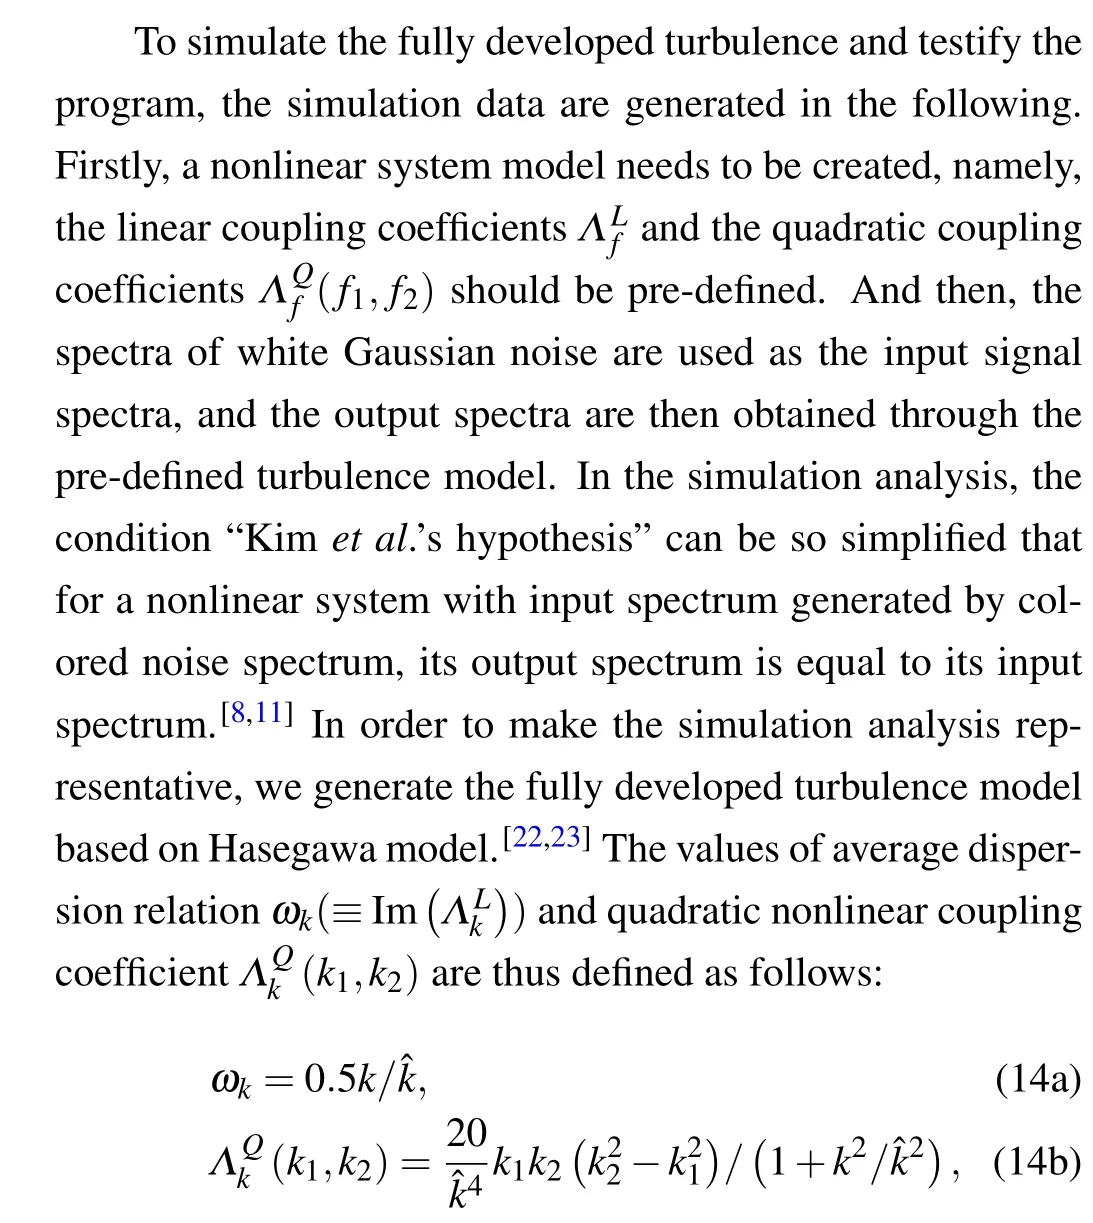
wherekis defined as the index of frequencyfas mentioned above, which approximately satisfies the relationf=kΔfand three-wave coupling condition, namelyf=f1+f2, or say,k=k1+k2. And for simplicity, we take ˆk= 32, and Δf=1 kHz.
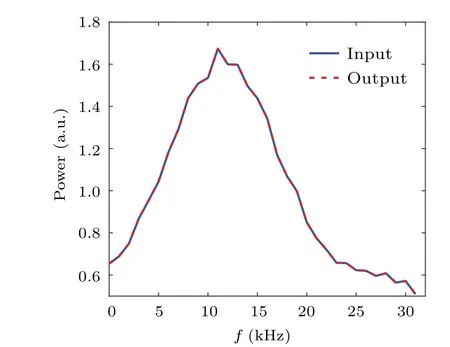
In the simulation,the original input data are white Gaussian noise signals, which pass through the “black box” 12 times, and the output signal of the last black box serves as the final input signal to simulate a fully developed turbulence. Its power spectrum is shown in solid blue lines in Fig. 2. And then, according to the given mean dispersion relation(Eq.(14a)),the quadratic nonlinear coupling coefficient
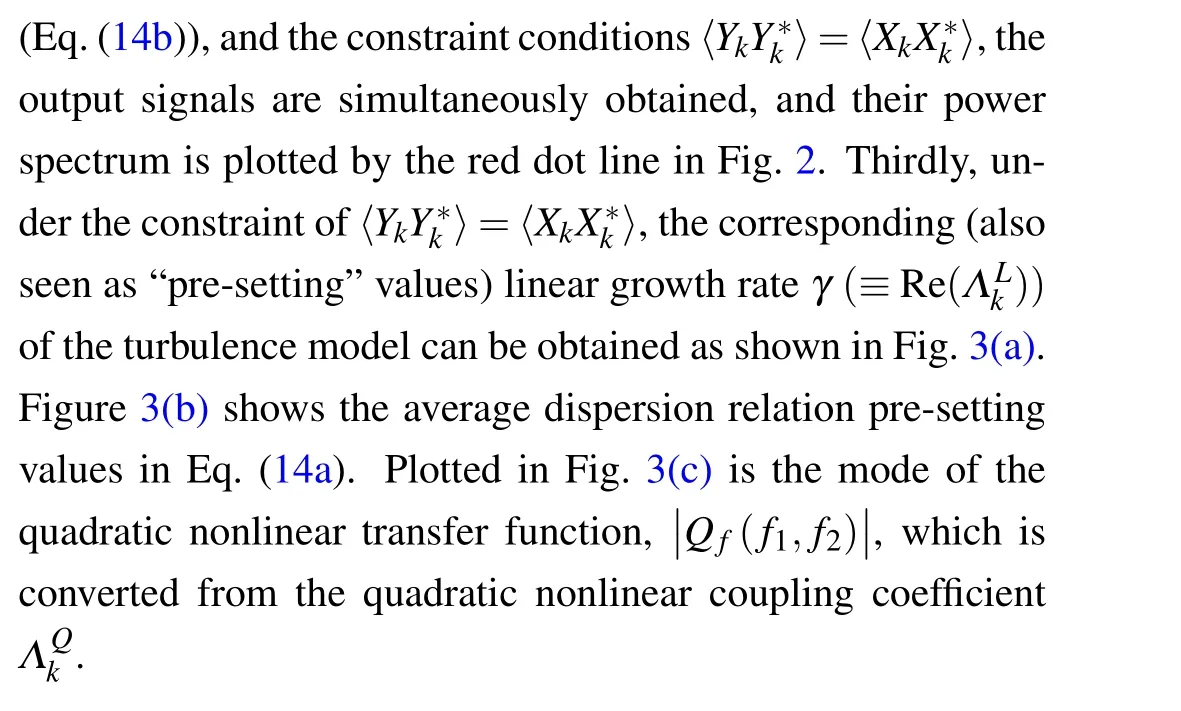
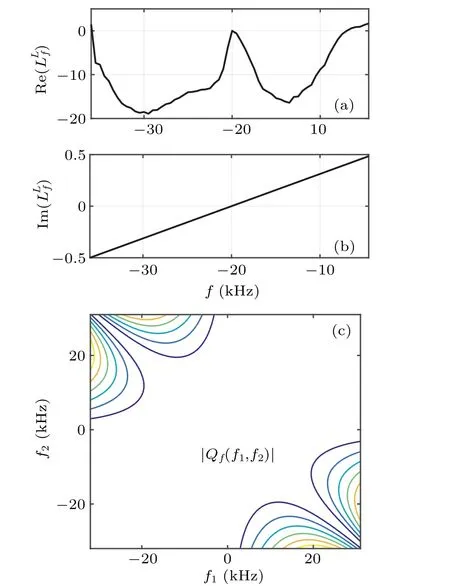
Fig. 3. Pre-setting values of nonlinear system model: (a) real part of(b) imaginary part of , and (c) the mode of quadratic nonlinear transfer function.
As seen from Figs.3(a)and 3(b),the real part of the linear coupling coefficient (corresponding to the growth rateγ)is basically symmetric about the axisx=0, while its imaginary part (corresponding to the mean dispersion function) is symmetric about the origin point.
3.2. Comparison and analysis of simulation results
The ideal turbulence model that satisfies Kimet al.’s hypothesis has been defined above. The input and output spectrum signals generated are input in the present program for computations, and then the calculated phase spectrum, linear and quadratic coupling coefficients, and the estimated quadratic transfer function, are obtained and illustrated in Fig. 4. Note that the real part of the linear coupling coefficientΛLfis also the linear growth rateγ,and its imaginary part is the average dispersion relationω-r.
As seen from Fig. 4(a), since the ideal output spectrumYkis calculated from the input signal spectrumXkaccording to the constraint condition〈YkY*k〉=〈XkX*k〉, the phase difference between the output signal spectrumYkand the input signal spectrumXkis not smooth,while this does not weaken the correctness of the simulation results. Comparing Fig.4(c)with Fig.3(a),as well as comparing Fig.4(b)with Fig.3(b),it is demonstrated that the real part and the imaginary part ofΛLfcalculated are basically equal to the pre-setting values within a certain error range. And the mode of the nonlinear transfer function,Qf(f1,f2),as shown in Fig.4(d),is approximately identical with that in Fig. 3(c). All these results confirm that the program runs well.
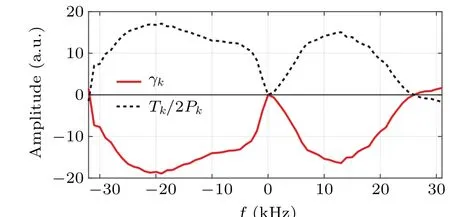
Plotted in Fig. 5 is the comparison between the linear growth rateγfcalculated andTf/2Pf. Obviously,it indicates the relationshipγf-Tf/2Pf ≈0,suggesting that
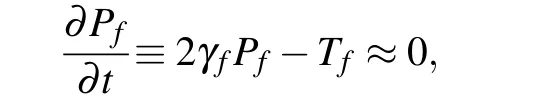
namely,as the difference between the input power and the output power satisfies ΔPf ≡Pf(x+Δx)-Pf(x)≈0, indicating an approximately constant power. It can be shown that the output spectrum here belongs to the ideal output spectrum,the model meets Kimet al.’s hypothesis, so it is suitable for the algorithm in this paper, and the program running results are physically accurate.
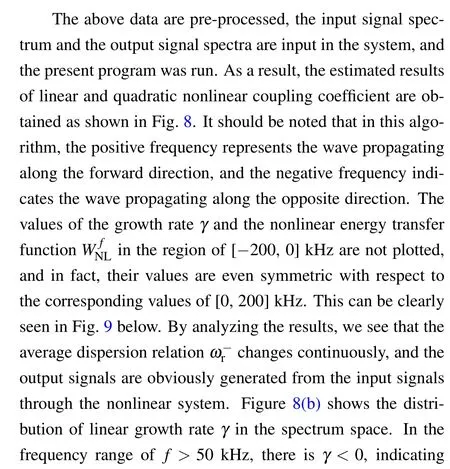
4. Application: Case calculation
The study of plasma in a toroidal device involves with many aspects.[25–28]Here we choose the edge plasma turbulence data measured in an experiment on the toroidal device,and employ the present program to calculate and analyze the energy transfer in the turbulent system, so as to test the efficiency of the algorithm and program in practical application.Shown in Fig. 6 is the signals evolve with time in the input channel and the output channel in Discharge 53441 on TPERX RFP device. The sampling frequency is 1 MHz. The measured 3.1×10⁴data in total in a range fromt=18.5 ms to 49.5 ms are taken as the original signals. The number of realizations is taken to ben=480,and the number of samples at a time isnum=128, and the number of overlapped samples in each segment is takennp=64. Hence,the total number of sample data required for each channel is 30784 (<31000).
The input and the output power spectra are shown in Fig.7. For this experimental edge plasma turbulence, clearly most of the energy is concentrated in the lower frequency region.In this system,the auto-power spectrum reaches its maximum value atf=0 kHz,about 3 a.u.,and most of the energy is concentrated within the range off <100 kHz.
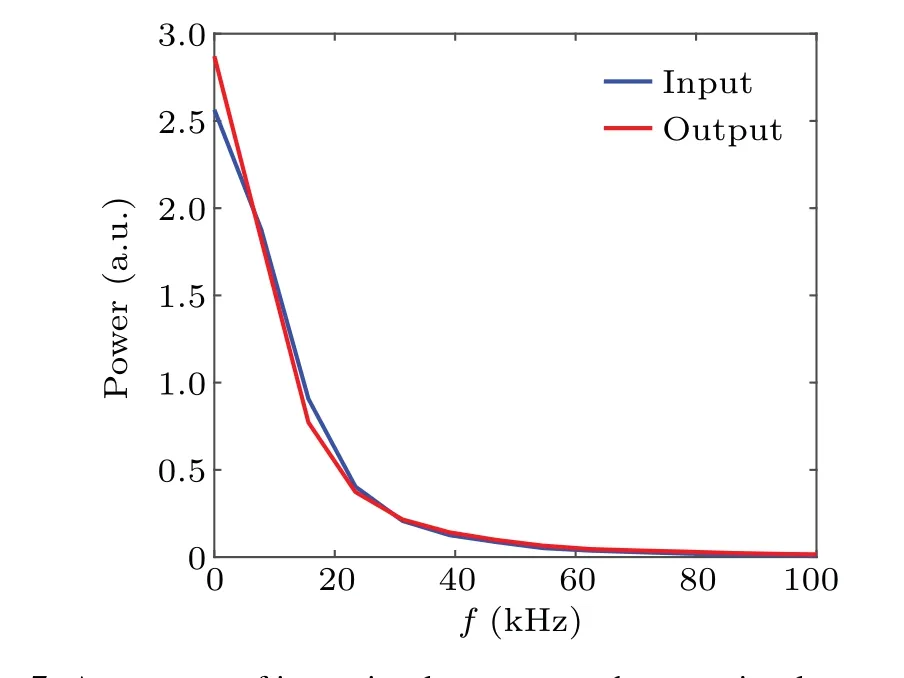
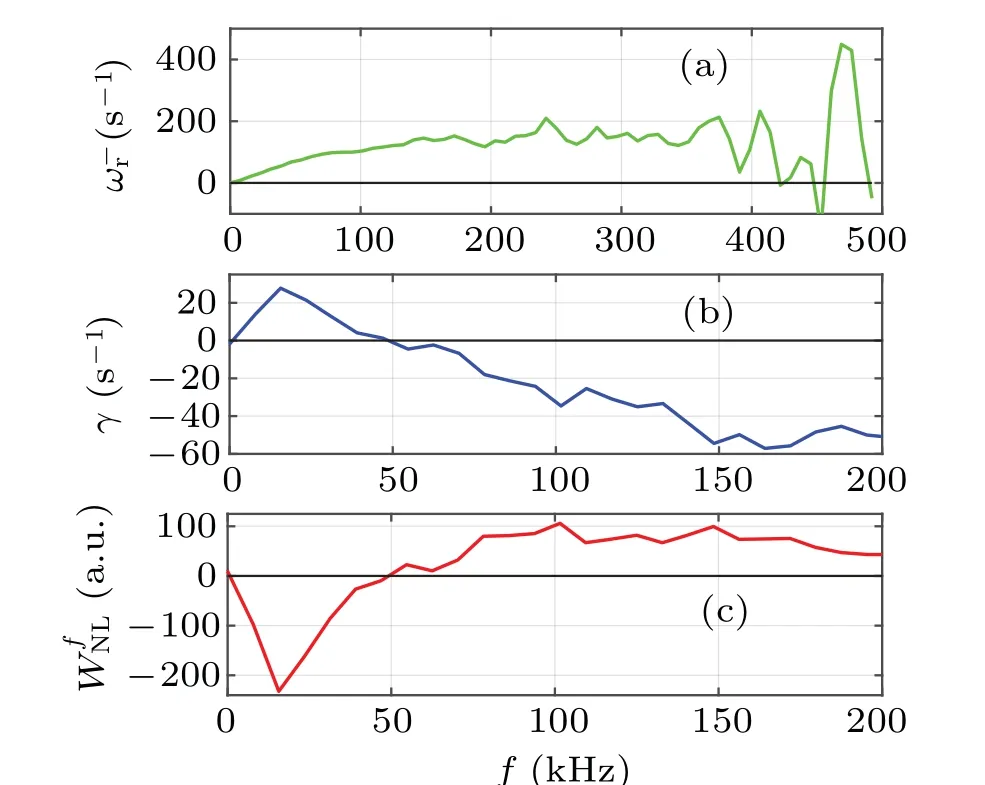
The auto-power spectra of the input signal and output signal shown in Fig. 7 are very similar, but there are still differences,which are the basic characteristics of the wave when the three-wave coupling predominates in the edge plasma turbulence. If such differences are small enough,the computational results are reliable; however, if the difference is too large, or say, the two auto-power spectra are not very similar, indicating that much useful information about spectrum would be lost when separating the non-ideal spectrum from ideal one, the computational results seem not precise as discussed in detail in Ref.[11].
In addition, the coherence of turbulence at two spatial points can affect the calculation results. In order to avoid such adverse effects, it is required to make the two spatial points
where the input and output signals are measured close enough,that is,the value of Δxshould be small enough. Generally,in a medium-sized toroidal device,the accuracy can be guaranteed by selecting Δx~0.1 cm–0.5 cm.
5. Summary
In this paper,a nonlinear wave coupling algorithm is proposed and implemented by a program. The algorithm is based on digital bis-spectrum estimation analysis and Kimet al.’s hypothesis,[9]that is,it is assumed that the input signal spectral power is equal to the output spectral power. Shenet al.have compared Kimet al.’s method with the complete iterative method[12]and proposed that Kimet al.’s method is more suitable for the analysis of energy transfer in edge plasma turbulence. The algorithm in this work belongs to Kimet al.’s method in essence.
In this algorithm, the nonlinear energy transfer function is calculated directly from the wave coupling coefficients,thereby improving the computation accuracy. When we apply the algorithm to the identification of turbulent energy transfer process, the original algorithm is transformed from wavenumber space into frequency space, which is appropriate to the physical characteristics of edge plasma turbulence.[29]The programing flow is given, and the simulation analysis is carried out, showing that the calculation results are reliable. As an application, the energy cascade analysis of typical edge plasma turbulence is performed.As a result,a physical picture of the energy transfer in the turbulent system is constructed,confirming that the energy transfer in this turbulent system spreads from lower-to higher-frequency region and its corresponding wave turns from a linear growing wave into a damping wave. The case analysis also demonstrates that the algorithm and program are both suitable to the study of the fully developed turbulence or saturated turbulence, such as edge plasma turbulence.[18,19]
Acknowledgements
Project supported by the National Key Research and Development Program of China (Grant No. 2017YFE0301200),the National Natural Science Foundation of China (Grant Nos. 12075077 and 12175055), and the Science and Technology Project of Sichuan Pprovince, China (Grant No.2020YJ0464).
猜你喜欢
杂志排行

Chinese Physics B的其它文章
- Ergodic stationary distribution of a stochastic rumor propagation model with general incidence function
- Most probable transition paths in eutrophicated lake ecosystem under Gaussian white noise and periodic force
- Local sum uncertainty relations for angular momentum operators of bipartite permutation symmetric systems
- Quantum algorithm for neighborhood preserving embedding
- Vortex chains induced by anisotropic spin–orbit coupling and magnetic field in spin-2 Bose–Einstein condensates
- Short-wave infrared continuous-variable quantum key distribution over satellite-to-submarine channels