Most probable transition paths in eutrophicated lake ecosystem under Gaussian white noise and periodic force
2022-06-29JinlianJiang姜金连WeiXu徐伟PingHan韩平andLizhiNiu牛立志
Jinlian Jiang(姜金连), Wei Xu(徐伟), Ping Han(韩平), and Lizhi Niu(牛立志)
School of Mathematics and Statistics,Northwestern Polytechnical University,Xi’an 710072,China
Keywords: eutrophicated lake ecosystem,Freidlin–Wentzell action functional,Onsager–Machlup action functional,most probable transition path
1. Introduction
The evolution of the lake system is a natural process and may take decades to hundreds of years from the state dominated by phytoplankton to the state governed by higher aquatic plants. However, disturbances and forces from outside the ecosystem can quickly break the natural evolution process.[1]Many investigations have manifested that ecosystem sometimes experience rapid regime shifts, as shown by transition from one stable state to another. This transition will change the nature of the ecosystem, leading to the degradation of ecosystem services.[2–5]For example, eutrophication due to excessive inputs of nutrients, mainly phosphorus, is a common problem in lakes, rivers, estuaries and coastal oceans.[6]Excess phosphorus will cause the clear-water attractor of lake change to the turbid one, which comes from sewage and industrial discharges.[7,8]Lake eutrophication has proven to be a stubborn environmental problem,[9]which seriously affects the ecological balance of the lake system. In addition,it may induce important social,economic,and environmental consequences.
Eutrophicated lake ecosystems have two stable attractors for specific parameters,corresponding to the oligotrophic and eutrophic states.[8,10]The stable states are generally related to the circulation of phosphorus between sediment and water.[8]Recently, an extensive number of researches have been conducted to explore the early warning indicators, in order to predict and describe the beginning of tipping points or critical transitions. Carpenteret al.indicated that the increase in the variance of dynamical variables can predict the upcoming catastrophic changes in the lake eutrophication model in advance.[11]Dakoset al.suggested that the flickering could serve as a warning indicator which could predict the critical transition to the eutrophic state.[12,13]Maet al.considered the amplitude difference, phase lag, largest Lyapunov exponent and the Shannon entropy to detect early-warning signals of the regime shifts of the lake eutrophication system. In addition, Maet al.showed that it is possible to slow down the upcoming critical transition in lake eutrophication system by Gaussian white noise and periodic excitation.[14–16]Unlike the existing works in detecting the early warning signals,we study the most probable transition paths to characterize the rapid regime shifts in lake eutrophication system between the two stable states as time goes on.
For a system with multiple attractors,the random perturbation will cause the sample trajectories of the system to depart from the basin of attraction and cross the boundary of the attract basin,or even lead to the system to transfer among multiple steady states.[17–21]Generally speaking, we utilize the deterministic trajectories to characterize the deterministic system. However, it is hard to find useful information from the trajectories to analyze the dynamics of the stochastic systems.Consequently, the most probable transition paths[22]will be introduced to research the dynamics of the stochastic system.The most probable transition path has been widely applied to many scientific fields.[23–27]However,for the ecosystem,it has few documents to research the most probable transition path.In an attempt to further characterize the state transition mechanism between the oligotrophic state and the eutrophic state in the lake eutrophication system, we employ the most probable transition path to research the impact of the noise on the eutrophicated lake ecosystem.
Based on the above researches, it is worthy of further study on the most probable transition paths of the lake eutrophication system under the random perturbation. This paper is organized as follows. In Section 2, we introduce the lake eutrophication model with and without period force, whose deterministic structure are discussed. Furthermore, the system under white noises is provided. Next,we give two kinds of action functionals,that is,Freidlin–Wentzell(FW)and Onsager–Machlup (OM) action functionals, to obtain the most probable transition paths in Section 3. Section 4 presents the most probable transition paths for the lake eutrophication system under Gaussian white noise and periodic excitations. Finally,we summarize the above results in Section 5.
2. Lake eutrophication system
2.1. Lake eutrophication model
We firstly introduce the one-dimensional lake eutrophication model established by Carpenteret al.[8]The lake eutrophication model considers the phosphorus exchange between the interface of water and sediment in the lake as one of the main sources of water nutrients,and represents the level of eutrophication with the dynamic changes in the water environment of the lake. It has the following form:

The bifurcation diagram for the parameterαis given in Fig. 1(a). Its middle-dashed line indicates the unstable equilibrium points.In the bistable region(shaded part),Eq.(2)has three equilibria under certain control parametersα. We usexSto represent the unstable equilibrium point,and usexLandxHto represent the oligotrophic state and the eutrophic state,respectively.
Figure 1(b) shows the potentials of Eq. (2) for three differentα, whereU(x) =-f(x)dxrepresents the potential function of system (2). From the perspective of the potential well, the oligotrophic state is more stable than the eutrophic stateα=0.40.Nevertheless,the eutrophic state is more stable than the oligotrophic state atα=0.64. Specially,the stability ofxLandxHis almost the same whenα=0.52.

Fig. 1. (a) Bifurcation diagram for the parameter α of the system (2).The cyan shaded part defines the bistable region,where the system has three equilibria. (b)The potential of the lake eutrophication system for different α.
2.2. Lake eutrophication model with period force
The change of season,annual cycle,rainfall and so on all affect the ecosystem. And research shows that periodic force can slow down the upcoming critical transition of the lake eutrophication system.[16]The effect of the periodic excitation on the ecosystem is worthy of the further study,

in whichAcos(ωt)represents the periodic force with the amplitudeAand the frequencyω.
The time history diagram shows that nullclinesf(x,t)=0 have different features for differentAandα,in the(t,x)-plane in Fig.2.
In Fig. 2(a), the nullines consist of three independent curves and divide the(x,t)plane into four parts,which means thatf(x,t) = 0 has three different roots at any time. And given the parameters, the system (3) has two stable periodic solutions and one unstable periodic solution. Letx*Landx*Hcorrespond to the oligotrophic stable periodic solution and the eutrophic stable periodic solution, respectively, andx*Scorresponds to the unstable periodic solution.
In Figs. 2(b) and 2(c),f(x,t) = 0 has three different solutions at some times, and only one solution at other times. Which means the double well structure of the original system is temporarily lost during certain stages. And the number of periodic solutions is affected by parameterω. In Fig.2(b),the nulline divides the(x,t)plane into two parts by a curve. In Fig. 2(c), the nullines are composed of several independent curves, among which one nulline always exists,while other closed curves only appear in certain periods.
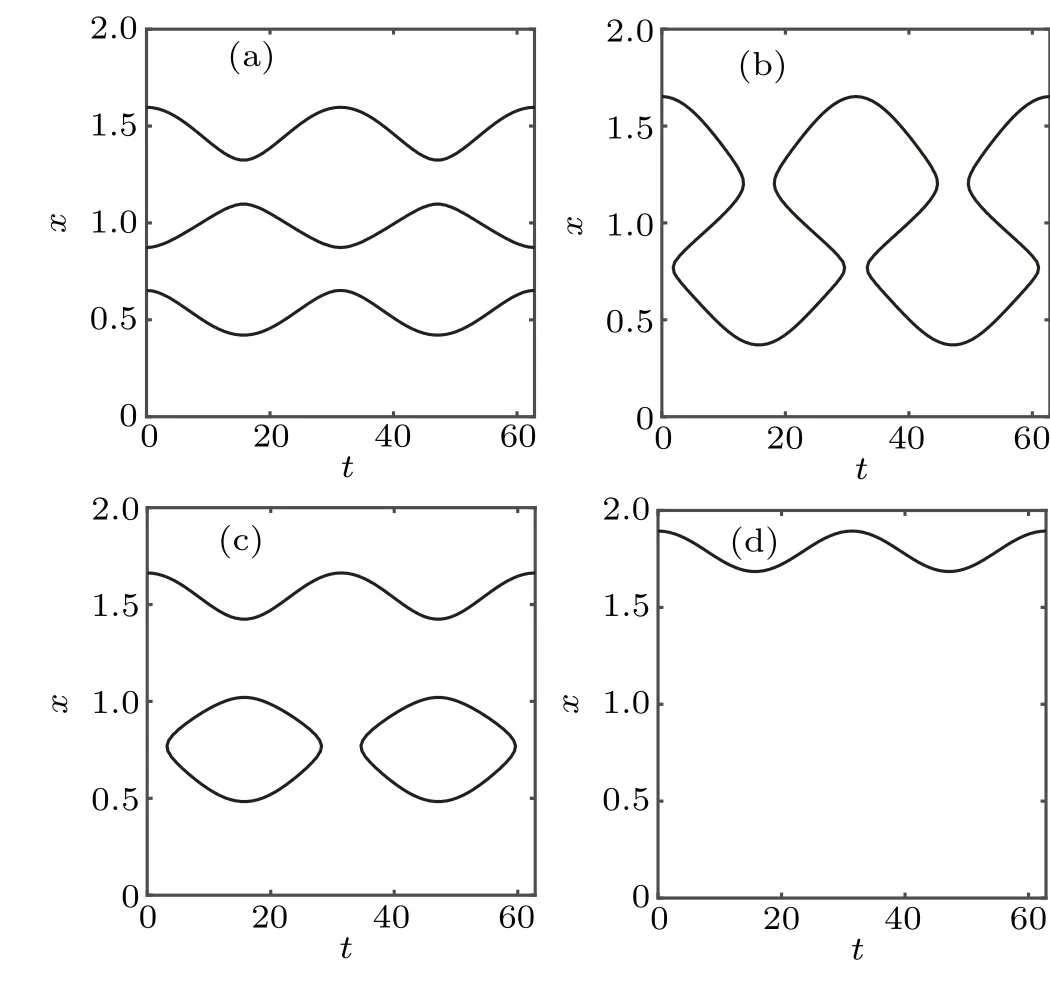
Fig.2. The nullclines(f(x,t)=0)of the system(3)with ω =0.2. (a)A=0.1,α =0.52;(b)A=0.15,α =0.52;(c)A=0.1,α =0.58;(d)A=0.1,α =0.8.
In Fig.2(d),a nulline divides the(x,t)plane into two parts by a curve.In this region,f(x,t)=0 there is only one root at any time, and the system has only one eutrophic stable periodic solution.
2.3. Lake eutrophication system with Gaussian white
In order to describe the ecological model of lake eutrophication more accurately, the influence of environmental disturbance must be considered. Environmental disturbance has always been considered as an important factor in ecosystem modeling.On the one hand,it is the inherent uncertainty of the ecosystem.On the other hand,anthropogenic disturbances add to the uncertainty of the ecosystem.[28]In lake eutrophication system, Carpenter and Brock[29]pointed out that phosphorus input rates are affected by external fluctuations. This means that the phosphorus input rateαis a random variable. Consequently,we consider the systems(2)and(3)with Gaussian white noise

whereξ(t)satisfies〈ξ(t)〉=0,〈ξ(t)ξ(t+τ)〉=σδ(τ).
With three representative potentials as shown in Fig. 2,we consider the most probable transition paths under Gaussian white noise. For system with periodic excitation,the double well structure is temporarily lost and the periodic solution is affected by parameters. Hence, we choose two groups of appropriate parameters to study the most probable paths of the periodic excitation system.
3. Two kinds of action functionals
3.1. Freidlin–Wentzell action functional
For the stochastic bistable system, noise could lead to transitions from one stable state to another stable state. If the noise intensityσis small, the large deviation theory is a powerful method to study the noise induced transition. Freidlin and Wentzell introduced the action functional with path as the variable, which describes the probability of sample trajectory[22]
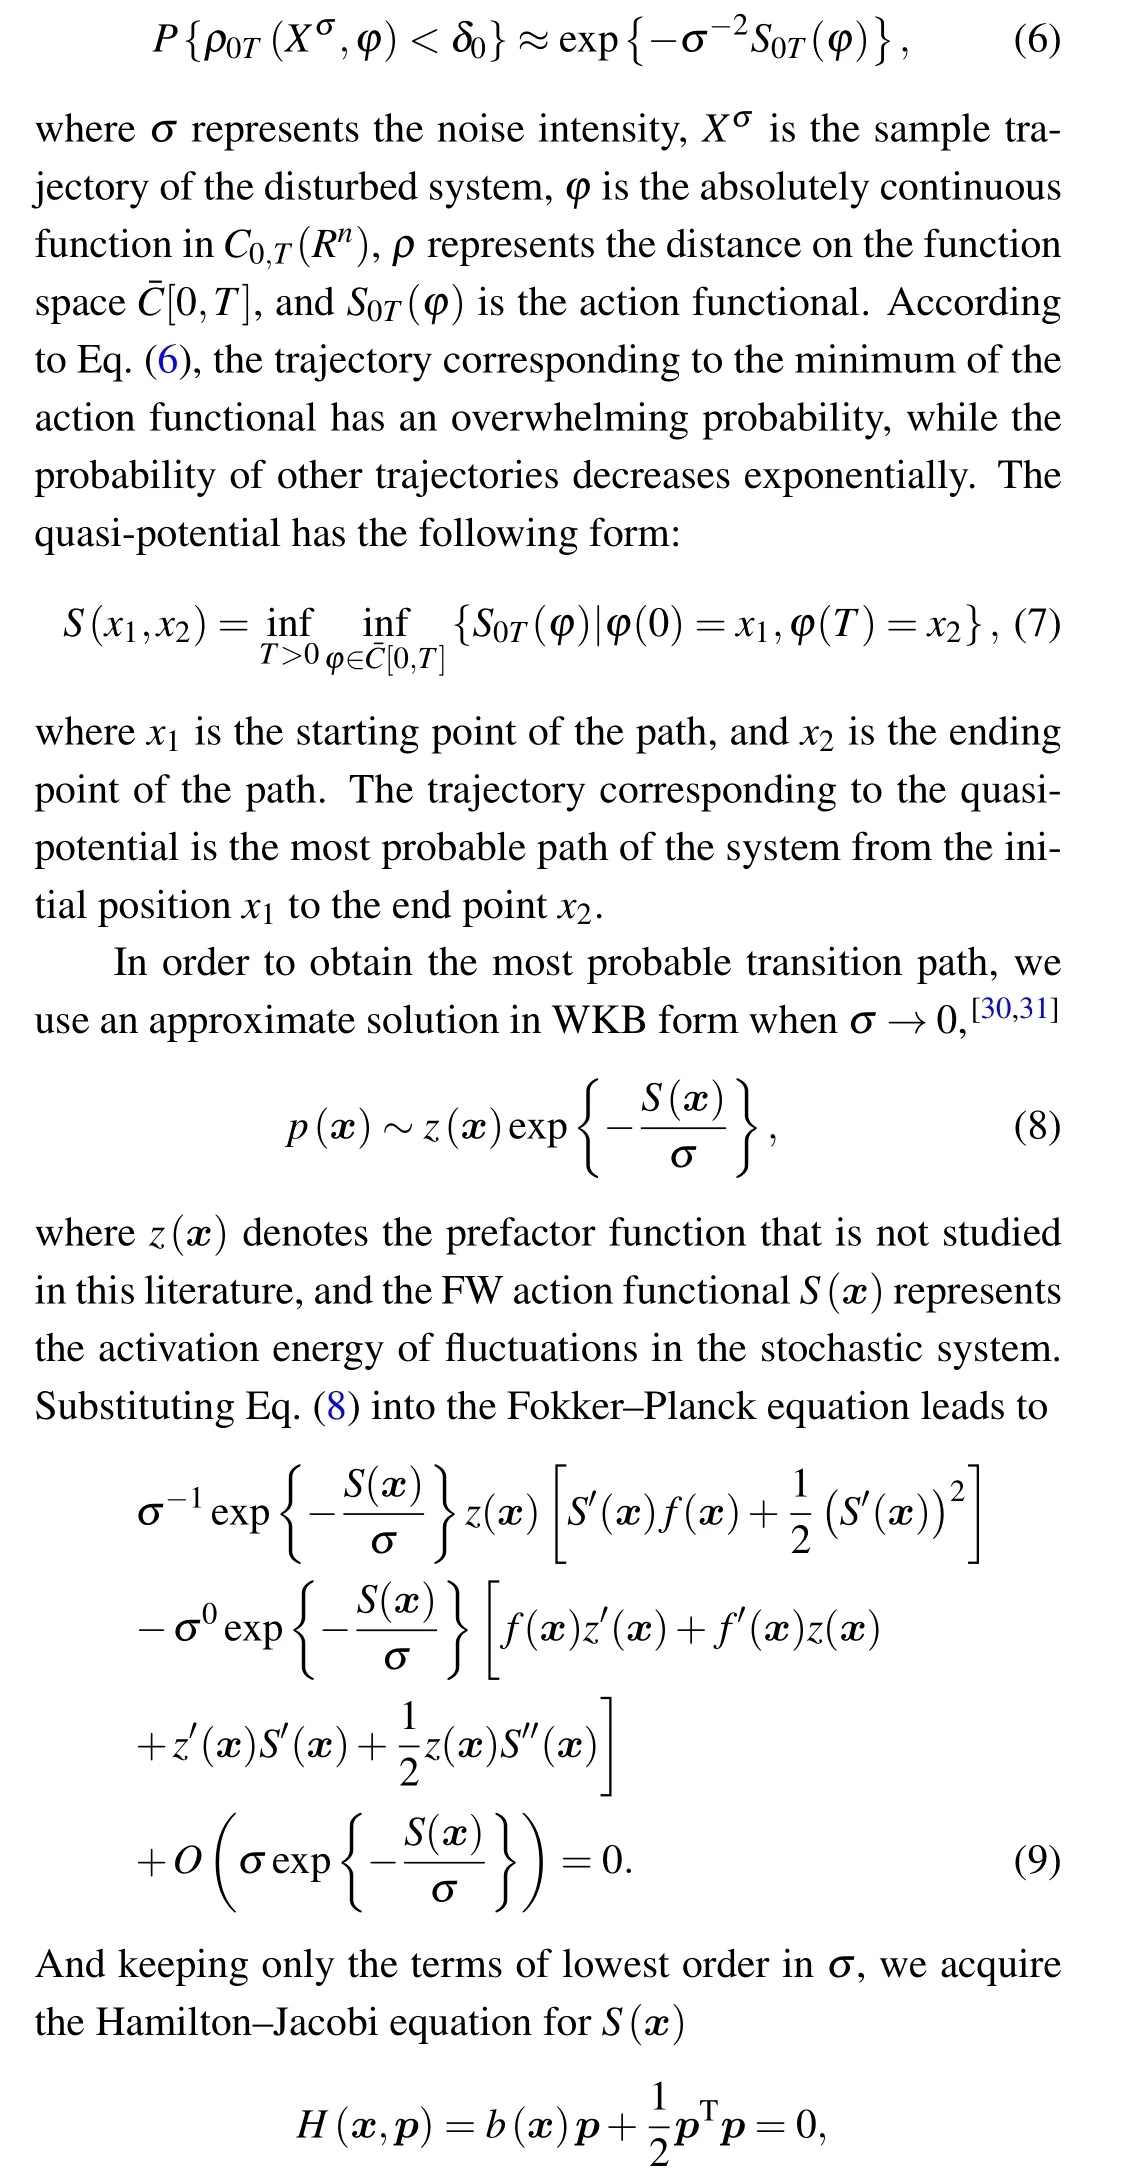
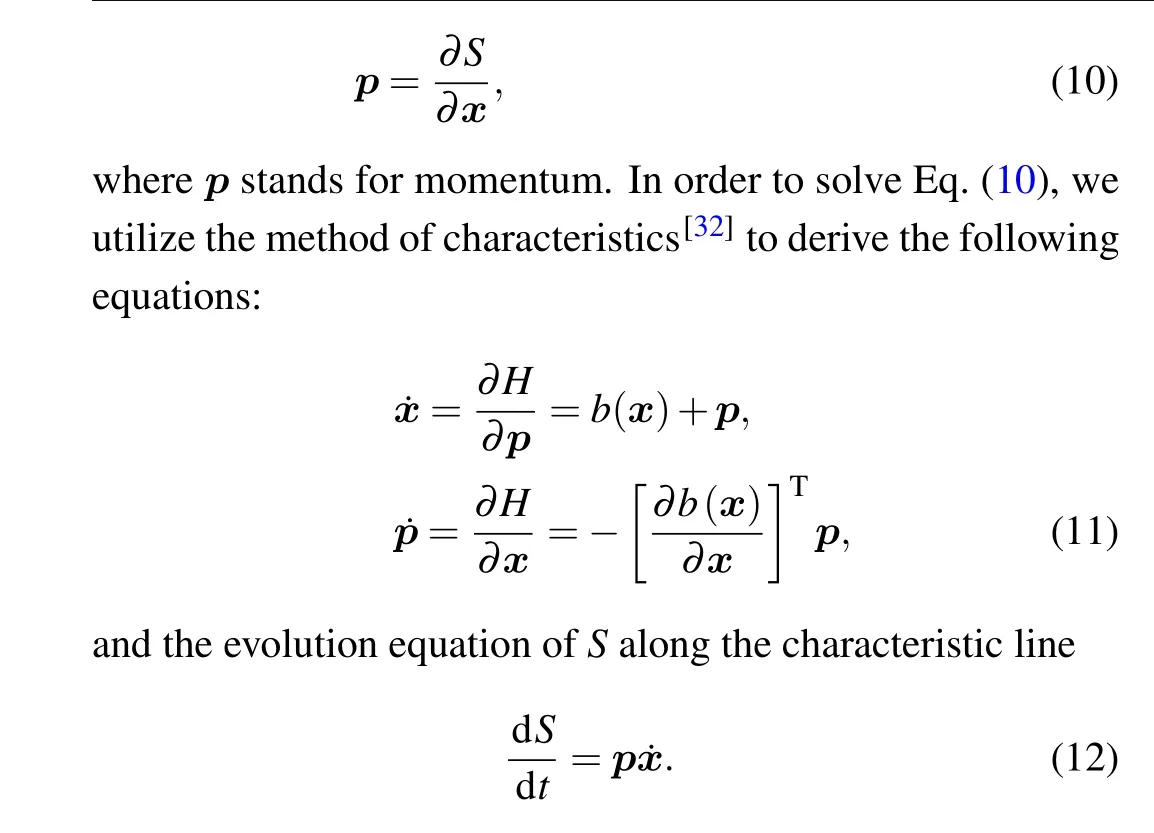
Equation(11)is an auxiliary Hamiltonian system,[33]andprepresents the disturbance term in the original equation.Thus,the most probable transition path can be obtained from Eq. (11). If the original fixed point is a stable equilibrium point, the noise disturbance can add an unstable manifold; if the original fixed point is an unstable equilibrium point, the noise disturbance can lead to a stable manifold. We apply the action plot to get the FW action functionals of the escape paths. From this we can acquire the minimum of the FW action functional and the corresponding most probable transition path.
3.2. Onsager–Machlup action functional
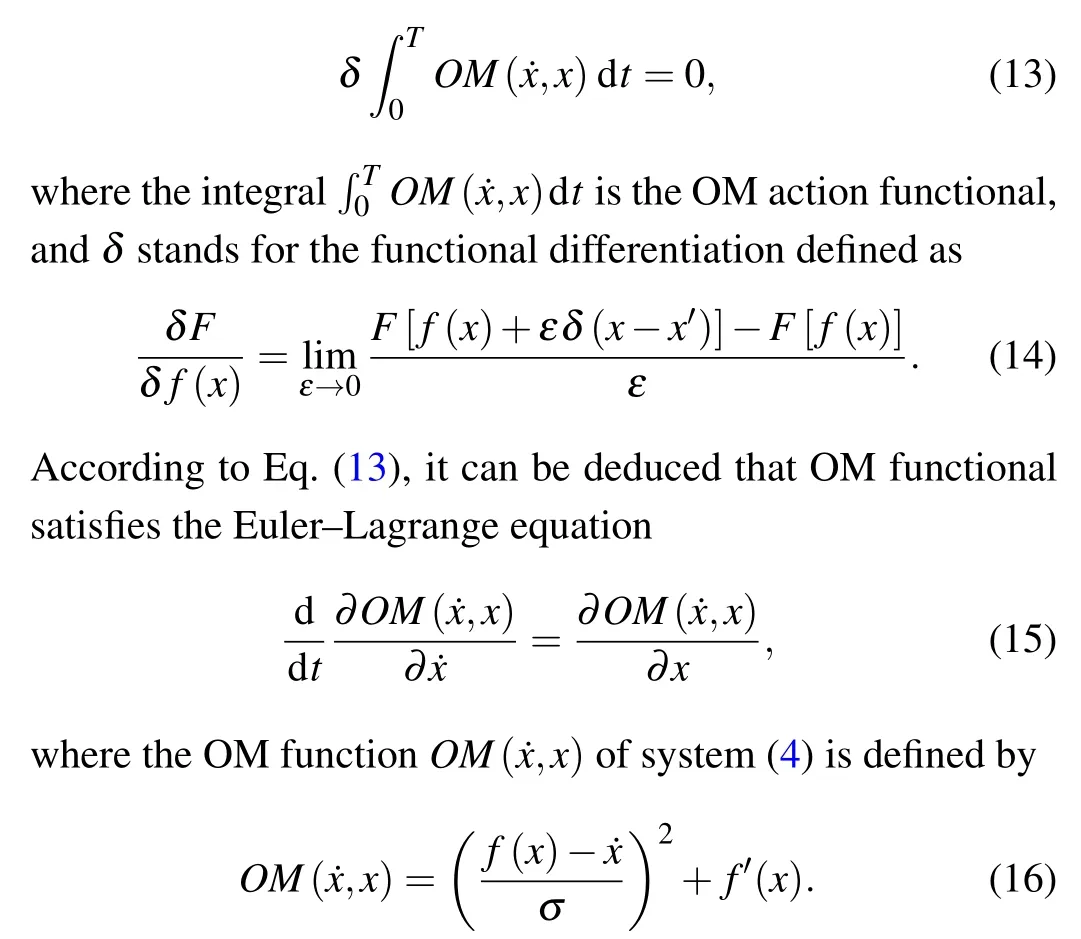
The noise intensity also has an important effect on lake eutrophication system, so it is worthy to further discuss the most probable transition paths under different noise intensities. We obtain the most probable transition path by minimizing the OM action functional[34–36]for the stochastic lake eutrophication systems(4)and(5). According to the principle of least action principle,the most probable transition pathxmcan be obtained by Therefore,the most probable transition pathxm(t)satisfies the following equation:

4. Results
In this section, we use the above two methods to compute the most probable transition paths. The characteristics of the most probable transition path can help analyze how the lake transfers between the oligotrophic state and the eutrophic state. For stochastic systems,we utilize FW action functional to get the most probable transition paths in weak noise. In addition,we use the OM action functional to study the influence of the noise intensity on the most probable transition path.
4.1. Lake eutrophication system under Gaussian white noise
For system (4), we display the most probable transition paths betweenxLandxHfor differentα. According to the FW large deviation theory,we acquire the most probable transition paths and the momentum required to transition fromxLtoxHwith different parameters. Furthermore, by minimizing OM functional,the most probable transition paths betweenxLandxHunder different noise intensity can be obtained.
As can be seen from Fig.3,the changes of the most probable path and momentum have same characteristics. The most probable transition paths start at the stable equilibrium pointxL, and it wanders in the basins ofxLand the momentumpstarts at zero and grows slowly. As time goes on,the momentumpsuddenly increases and the large momentum makes the system transition fromxLtoxS.Then the momentumprapidly decreases to zero,while the system stays atxS(unstable state)for a long time. But because of the attraction ofxH,the system will eventually reachxH.
Under different parametersα, the relative stability between the attractors is different,and the maximum momentum required for transition are different. The value of theY-axis on the right of Fig. 3 represents the momentum of the system. The larger momentumpis, the more energy is needed to escape from the stable equilibrium point. By comparing Figs. 3(a)–3(c), it can be seen that the maximum momentum decreases successively, indicating that within a certain range,with the increase of parameterα, the lake system is easier to transition from the oligotrophic state to the eutrophic state.

Fig. 3. The most probable paths and momentum of lake eutrophication system from xL to xH under different parameters α. The black lines represent the most probable escape paths,and the red lines represents the momentum change during transition. (a)α =0.40;(b)α =0.52;(c)α =0.64.
In Fig. 4, it is easy to understand that the most probable transition path is a heteroclinic orbit connecting three fixed points. Heterotonic orbitals visually show that the momentumpchanges the topology of the original system. The most probable paths connect the three equilibrium points of the system,but not just along thex-axis. Because of the influence ofp,the system transition occurs. The most probable path of the system fromxLtoxSis an arc orbit containing the manifold of the auxiliary Hamiltonian system.Once the system reachesxS,the disturbance forcepbecomes zero and the system will relax to another equilibrium point. With the increase of parameterα,the heteroclinic orbitals fromxLtoxHare shrinking,while the heteroclinic orbitals fromxHtoxLare increasing. With the increase of parameterα, the lake system transition from the oligotrophic state to the eutrophic state requiring less energy.The results of Fig.4 confirm the conclusion of Fig.3.

Fig.4. Phase portrait of the Hamilton equation. The green and magenta curves represent the most probable paths from xL to xH and from xH to xL,respectively. (a)α =0.40;(b)α =0.52;(c)α =0.64.
In Fig. 5, we obtain the most probable transition pathsxm(t) beginning at the oligotrophic statexLand ending at the eutrophic statexHwith different noise intensities. On the whole, the residence time of the system in oligotrophic state became shorter with the increase of parameterα. And with the increase of noise intensity,the transition time occurs earlier and the residence time in the unstable equilibriumxSbecomes shorter.
The inset diagrams of Figs. 5(a) and 5(b) show that the most probable paths transition between the two stable equilibrium states. Whenα=0.40,although the potential well in the eutrophic state is not deep,the system will still stay in the eutrophic state for some time. Whenα=0.52, the system will wander in the eutrophic state for a longer time. Although the difference between the depths of potential well is not great,the eutrophic state is more stable than the oligotrophic state from the perspective of the transition path. That is, eutrophication is a very difficult problem to solve. Whenα=0.64, the system switches from the oligotrophic statexLto the eutrophic statexHquickly,because eutrophic state is more stable at this parameter.
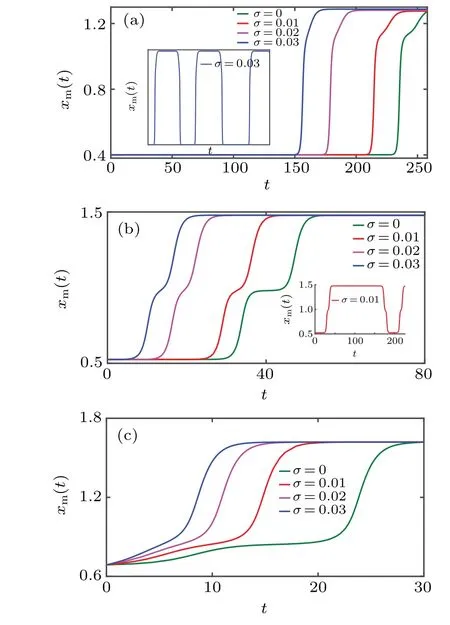
Fig.5. Most probable transition paths xm(t)starting at the oligotrophic state xL and ending at the eutrophic state xH for different noise intensities. (a) α =0.40, the inset figure displays the most probable path between xL and xH at σ =0.03. (b)α =0.52,the inset figure displays the most probable path between xL and xH at σ =0.01. (c)α =0.64.
4.2. Lake eutrophication system under Gaussian white noise and periodic excitations
Now,we consider not only white Gaussian noise but also periodic excitation on the most probable transition path between the oligotrophic state and the eutrophic state. Based on the characteristic of the nullines of the periodic system, the most probable paths of the system with two sets of parameters are considered in this paper.
According to Subsection 3.1, we have the Hamiltonian for Eq.(4)as follows:


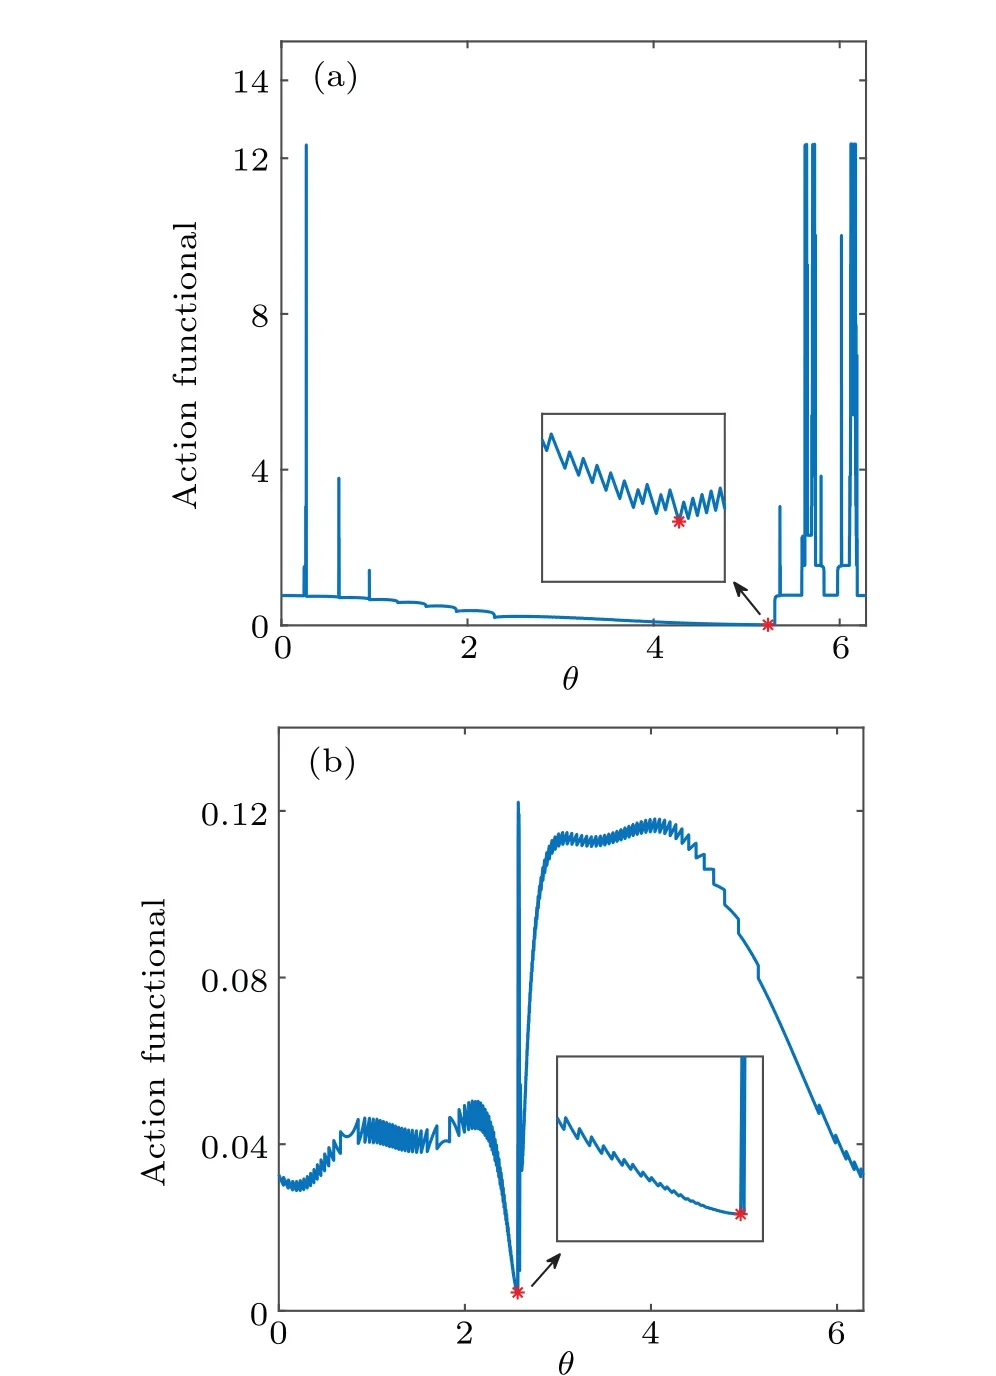
Fig.6. Freidlin–Wentzell action functionals of escape paths from x*L to x*H. The minimum of Freidlin–Wentzell action functional is marked by the red asterisk. (a)α=0.52,A=0.1,ω=0.1;(b)α=0.58,A=0.1,ω =0.5.
Figure 6 shows the action functional for different (x,θ).Its global minimum, indicated by a red asterisk, corresponds to the most probable path of the system.
In Fig.7,the thick solid red line represents the most probable escape path. It can be seen that the transition of the most probable path occurs at the closest distance betweenx*Landx*S. And the most probable path tox*His near the intersection of the nulline and periodic solution.
For Fig.7(a),the most probable path does not move along the unstable periodic solution after exiting fromx*Ltox*H,but directly reachesx*H. As can be seen from other escape paths,they firstly move towards the unstable periodic solutionx*Sbut their momenta are too small to escape. Then they will fluctuate between the original stable periodic solution and the unstable periodic solution to prepare for a next trial to escape. For Fig.7(b),after the most probable path switches fromx*Ltox*S,it moves along the unstable periodic solutionx*S,and the most probable path begins to transition tox*Hnear the intersection of the unstable periodic solution and the nulline.
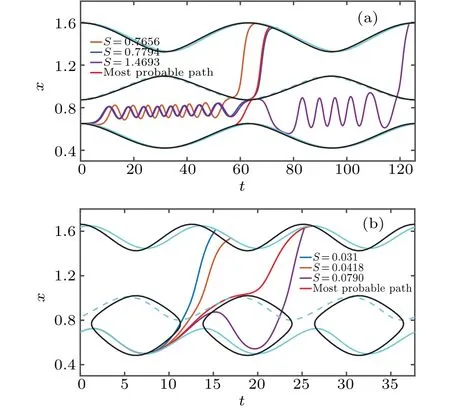
Fig. 7. Escape paths from x*L to x*H. The solid cyan lines represent the two stable periodic solutions and the dotted cyan line represents the unstable periodic solutions. The black lines represent the nullclines.The red thick line represents most probable transition path, and the other lines for other escape paths. (a) α =0.52, A=0.1, ω =0.1;(b)α =0.58,A=0.1,ω =0.5.
In Fig.8,we compare the most probable transition paths obtained from Eq.(19)for various values ofσ. Herein,for all the most probable transition paths, we choose the same start pointx*L(0), the same end pointx*H(T) and the total time for five periods. Given the parameters,the nullines are very close to the periodic solutions but they do not overlap. The nullines only intersect the highest and lowest points of the periodic solutions. The insets in Fig.8 indicate that the transition occurs in the gap between the stable periodic solution and nullcline,where the flow of the period solutions will change directions.
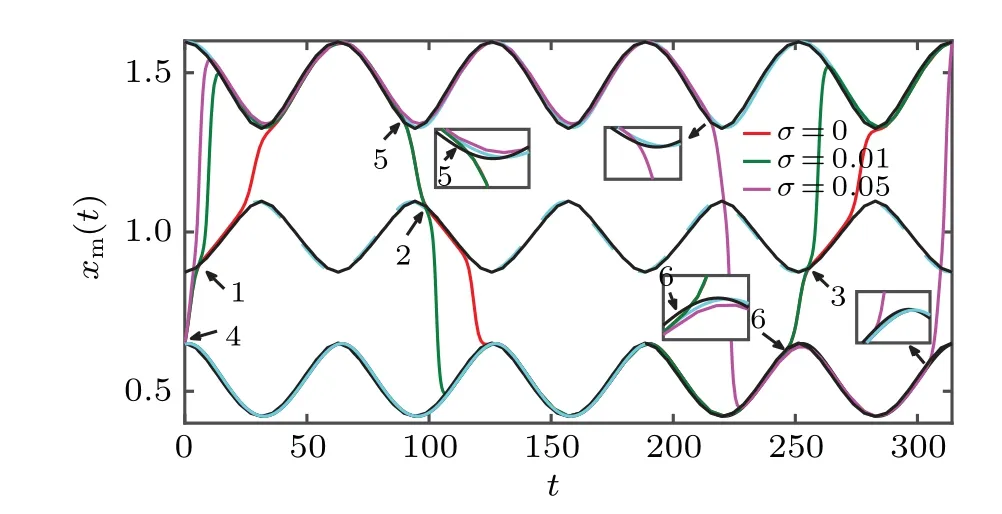
Fig. 8. Most probable transition paths for different σ with α =0.52,A=0.1,ω=0.1. The solid cyan lines represent the two stable periodic solutions and the dotted cyan line represents the unstable periodic solution,the black lines represent the nullclines. The arrow-1 to arrow-3 mark where paths arrive at x*S,and the arrow-4 to arrow-6 mark where paths leave x*L and x*H. And the insets indicate that the transition occurs in the gap between the stable periodic solution and the nullcline.
We observe that the transition of the system occurs between two stable periodic solutions three times in five periods.The first transition is fromx*Ltox*H,and the places leavingx*Land reachingx*Sare not different with the change of noise intensity. The second transition is fromx*Htox*L. The residence time inx*Landx*Hvaries greatly under different noise intensities. Whenσ=0.05, the most probable path stays longer inx*H, while forσ=0 andσ=0.01, the most probable paths stay longer inx*L. The third transition is fromx*Ltox*H. Every transition indicates that the transition occurs near the nearest distance between the stable periodic solution and the unstable periodic solution.
Whenσ= 0, the most probable transition path moves alongx*Sfor a half cycle after reaching the unstable periodic solution.Nevertheless,the most probable transition paths switch quickly to the other stable period solution forσ=0.01 andσ=0.05. And there have interesting phenomenon forσ=0 andσ=0.01. For each transition, the most probable transition paths follow a similar trajectory to the unstable periodic solutionx*S, marked by arrow-1 to arrow-3. And the transitions begin at a similar point at stable periodic solutions,that is, they all leave the stable periodic solutionx*Landx*Haround the same phase,marked by arrow-4 to arrow-6.
In Fig.9,we compare the most probable transition paths obtained from Eq.(15)for various values ofσ. Herein,for all the most probable transition paths, we choose the same start pointx*L(0), the same end pointx*H(T) and the total time for four periods.
As shown in Fig. 9, the influence of noise intensity on the most probable paths is not very large. Basically,the most probable paths move alongx*Lto the red square and transition tox*H. The place where the most probable paths transition is the same,and the higher the noise intensity,the earlier the system reachesx*H. Whenσ=0, the most probable transition path moves alongx*Sfor a half cycle, while whenσ/=0, the most probable paths hardly stay atx*S.

Fig.9.Most probable transition paths for different σ with α=0.58,A=0.1,ω =0.5. The solid cyan lines represent the two stable periodic solutions and the dotted cyan line represents the unstable periodic solution,the black lines represent the nullclines. The red square indicates the most probable paths transition occurs at the same place under different noise intensity.
The most probable paths will deviate fromx*Lwhere the double-well structure disappears. In particular, where the double-well structure of the system disappears,the most probable path atσ=0 initially moves up tox*Sand along it. After the unstable periodic solution intersects the nulline,the system begins to move down tox*Lunder the action of the deterministic vector field. It can be seen that when the double-well structure disappears,the distance betweenx*Landx*Sis closest,and the system is prone to transition.
5. Conclusions
In this paper,we have investigated the most probable transition paths of the lake eutrophication system under Gaussian white noise and the periodic force. The characterization of the most probable paths provides a new perspective for the study of the lake eutrophication system. We visualized transitions between the eutrophic state and the oligotrophic state. We introduced two kinds of action functionals,FW action functional and OM action functional,for the calculation of the most probable transition paths under different noise intensities.
Firstly,the influence of noise is only considered.We used large deviation theory to observe the most probable transition paths. In weak noise intensity, the Hamilton–Jacobi equation is obtained by using WKB approximation for the system,and the FW action functional is obtained by using the method of characteristics. We used the minimum of the FW action functional to obtain the most probable transition paths between the oligotrophic state the eutrophic state. Further, we examined the most probable transition pathsxm(t)from the oligotrophic statexLto the eutrophic statexHwith different noise intensities by minimizing the OM action functional. By characterizing the most probable transition paths under certain parameters,we have found that the stability of the eutrophic state and the oligotrophic state has different results from the two perspectives of potential well and the most probable transition path.
Then,Gaussian white noise and periodic excitation were considered. Considering the influence of parameters on the periodic solutions and nullines of the system,we have chosen two groups of parameters to study the most probable path of the system with periodic excitation. The most probable transition paths fromx*Ltox*Hwere obtained by using the large deviation theory. In addition, by minimizing the OM functional,we obtained the most probable transition paths starting at the same initial point onx*Land terminating onx*Hfor different noise intensities. The transition points in periodic lake eutrophication system have same characteristics,and the transition is more likely to occur near the closest distance between stable and unstable periodic solutions.
Acknowledgement
Projected supported by the National Natural Science Foundation of China(Grant Nos.12072261 and 11872305).
猜你喜欢
杂志排行
Chinese Physics B的其它文章
- Switchable terahertz polarization converter based on VO2 metamaterial
- Data-driven parity-time-symmetric vector rogue wave solutions of multi-component nonlinear Schr¨odinger equation
- Neutron activation cross section data library
- Multi-phase field simulation of competitive grain growth for directional solidification
- A novel similarity measure for mining missing links in long-path networks
- Effects of electrical stress on the characteristics and defect behaviors in GaN-based near-ultraviolet light emitting diodes
