Effects of Planting Density and Cutting Time on Hay Yield and Nutritional Value of Forage Soybean HN389
2022-06-25LiuWeiGuoYueLuYalinWangBoHuaYiZhuSiqiQinLigangandHuGuofu
Liu Wei, Guo Yue, Lu Ya-lin, Wang Bo, HuaYi, Zhu Si-qi, Qin Li-gang, and Hu Guo-fu
College of Animal Sciences and Technology, Northeast Agricultural University, Harbin 150030, China
Abstract: Forage soybean is an important source of high protein forage. Variety screening and breeding not only can solve the adjustment of agricultural planting structure, but also can provide a large amount of high-protein forage material, and effectively solve the problem of a serious shortage of high-protein forage in herbivorous animal husbandry in China. In this study, the feeding-type soybean strain HN389 was selected as experimental material, with three planting densities of 270 000, 405 000 and 540 000 plants • hm-2 and three cutting periods of the initial pod stage (R1), the initial grain stage (R2) and the early mature stage (R3) were set to determine the yield and feeding quality, in order to obtain the best planting density and harvest time of the variety. The results showed that in forage soybean strain HN389 at the R1 and R2 stages, plant height increased with increasing planting densities, while fresh and dry weight per plant decreased with increasing planting densities, and there was no significant difference at the R3 stage. The yield of hay at the R1, R2 and R3 stages increased firstly and then decreased with the increase of planting densities, and the yield per hectare was R3>R2>R1. The order of contents of crude protein (CP), neutral detergent fibers (NDF) and acid detergent fiber (ADF) in feeding quality of HN389 were R2>R1>R3, and ether extract (EE) content order was R3>R1>R2, and there was no significant difference among different groups. Two principal components were extracted from five forage indexes including CP, NDF, ADF, EE and fresh grass yield by principal component analysis. The cumulative contribution rate of principal components 1 and 2 was 90.053%, and their characteristic values were 3.617 and 0.885, respectively. After a comprehensive evaluation, harvested at the R3 stage and the density was 405 000 plants • hm-2, HN389 had the highest comprehensive score of 0.344, yield of 38 035.53 kg • hm-2, CP, NDF, ADF and EE contents of 17.61%, 17.61%, 21.54% and 3.81%, respectively.
Key words: soybean, nutritional composition, yield, planting density, cutting time
Introduction
Soybean (Glycine max) is one of the main sources of vegetable protein and edible oil in the world (Graham and Vance, 2003) and is also one of the main food crops in China (Liu, 2017). It is a dicotyledon plant and an annual herb of the soybean genus in the leguminous family and is often used as the main raw material for grain, oil and feed (Sunet al., 2019). It has a long history of cultivation in Asia (Donget al., 2021). In the early 1990s, soybeans were already known for their protein contents and other nutritional benefits (Qinet al., 2021). As the origin and main production area of soybeans, China has a cultivation history of more than 5 000 years and is the largest producer and exporter of soybeans in the world (Wang, 2010). As one of the cradles of soybeans, Heilongjiang Province has a soybean planting area of about 3.93 million hectares and a total output of about 8 million tons in recent years (Li, 2018), and the ratio of its soybean planting area to the national soybean planting area has been maintained at 38%-42% (Geng, 2018). However, due to the limitations of varieties and traditional farming methods, the yield of traditional soybeans is not high,and it loses its competitive advantage with imported transgenic soybeans, resulting in the dependence of the domestic soybean industry on imported soybeans exceeding 89% (Han, 2019). How to improve the added value of traditional soybean is an important topic.
The spatial distribution of plants in crop communities is an important factor in determining crop yield(Egli, 1988). Determining the optimum planting density is the main method to increase crop yield.Prevention of lodging and premature senescence under high planting densities and screening and improving density tolerance of crop varieties are the main goals of agronomy. In the actual production of forage grass, planting density also has a certain effect on the nutritional quality of forage grass. Therefore, it is important to determine the optimal planting density of forage soybean not only for its yield, but also for its feeding quality. In addition, the growing period of forage soybean harvest has a significant influence on the yield and quality of hay, therefore, the harvest period is also an important factor to determine the yield and quality of soybean hay.
In this study, different planting densities and cutting periods were set to explore the optimal planting densities and cutting periods of feeding soybean HN389 strain, which had important theoretical value and practical significance for the supplement of high protein forage and rational adjustment of agricultural planting structure in animal husbandry.
Materials and Methods
Plant materials and field experiment
The experimental material was HN389 (a high-quality forage soybean variety), and the control group was Dongnong 252, which had high yield, high protein,wide adaptability, large grain size and good disease resistance. The experiment was conducted in the field of Northeast Agricultural University (E126°44',N45°45') and Acheng Animal Husbandry Park(E127°05', N45°52') in Harbin City, Heilongjiang Province in 2019.
The feeding soybean variety HN389 and the control variety Dongnong 252 were planted in two fields. The field experiment adopted a random block experiment design, and the three planting densities were set up,namely 270 000, 405 000 and 540 000 plants • hm-2, and the three repeating plots were randomly set for each density. Each plot had nine rows and was 10 m long.Base application: pure potassium sulfate compound fertilizer 12-18-13 (the total nutrient>45%, Wuxi Poly Fertilizer Co., Ltd.). The seeds were sown in the experimental field of Northeast Agricultural University on May 25, 2019 and Acheng Animal Husbandry Park on June 2, 2019.
Material collection and index determination
Soybean samples were taken at the initial pod stage(R1), the initial grain stage (R2) and the early maturity stage (R3). Three complete soybean plants were collected from each plot and weighed on the spot, and plant height and fresh weight were recorded (pod dry weight and pod proportion were calculated at the R2 and R3 stages). A 1.2 m sample was randomly selected in the middle area of each plot to cut and measure the yield, and the stubble height was 5 cm. The growing period was determined by the experimental group HN389, and the control variety Dongnong 252 was harvested on the same day as the experimental group.
Soybean samples were taken at the initial pod stage (R1), the initial grain stage (R2) and the early maturity stage (R3). The three complete soybean plants were collected from each plot and weighed on the spot, and plant height and fresh weight were recorded (pod dry weight and pod proportion were calculated at the R2 and R3 stages). A 1.2 m sample was randomly selected in the middle area of each plot to cut and measure the yield, and the stubble height was 5 cm. The growing period was determined by the experimental group HN389, and the control variety Dongnong 252 was harvested on the same day as the experimental group.
Specific determination steps of soybean plant height, stem/leaf ratio and dry weight were as the followings:
Plant height: random sampling method was used to measure the plant height of soybean, and the three plants were randomly selected in the plot to measure the natural height.
Stem and leaf ratio: the three soybean plants were randomly selected in each plot, the stems and leaves were separated, dried at 65℃ oven for 12 h to constant weight, the dry weight of stems and leaves was measured, and the stem and leave ratios were calculated.
Dry weight: the three plants were randomly selected in each plot, placed in the oven for 105℃ for 30 min,then dried at 65℃ until constant weight, and the dry weight of the whole plant was measured.
Measurement of nutritional indexes
After the whole soybean was collected, it was baked at 105℃ for 2 h, and then baked at 65℃ for 24 h to constant weight. After it was taken out, it was crushed and passed through a 40 mesh sieve. Among them,crude protein (CP) was determined by the Kjeldahl nitrogen determination method, neutral detergent fiber(NDF), and acid detergent fiber (ADF) was determined by the normal fiber method, determination of ether extract (EE) by ANKOM Automatic analyzerfor,specific reference to Feed Analysis and Feed Quality Detection Technology (Yang, 1993).
Data collation and analysis
WPS2021 (Zhu, 2018) was used for data statistics.SPSS21.0 software was used for data analysis and significance analysis, and SPSS21.0 software was used for principal component analysis after standardization.
Results
Effects of planting density on yield-related indexes of forage soybean HN389
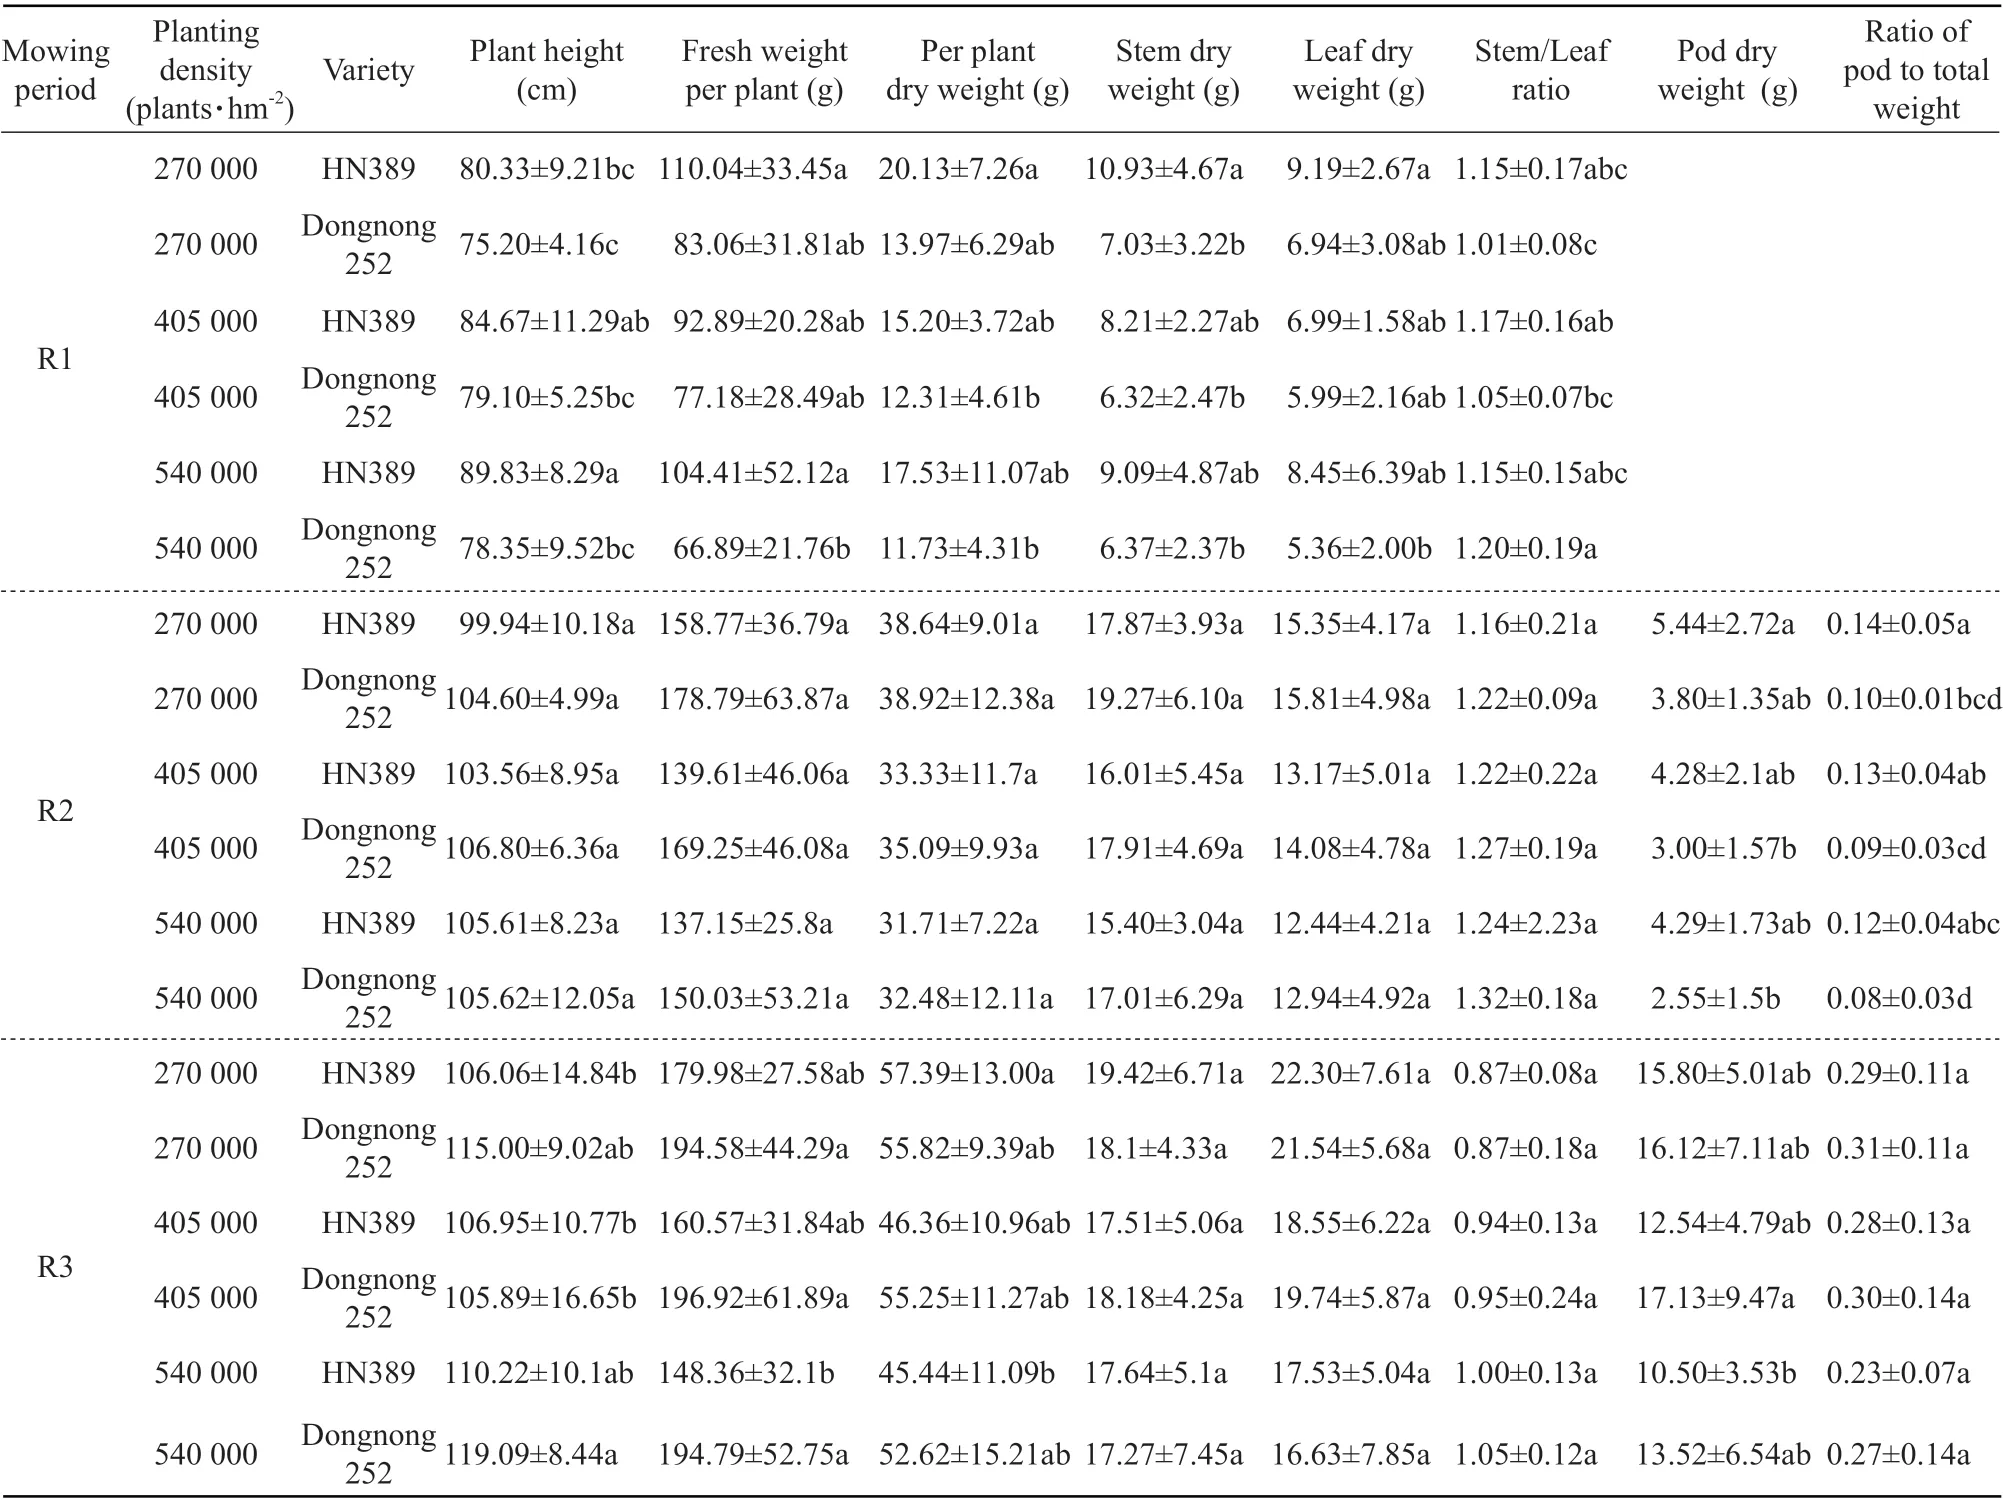
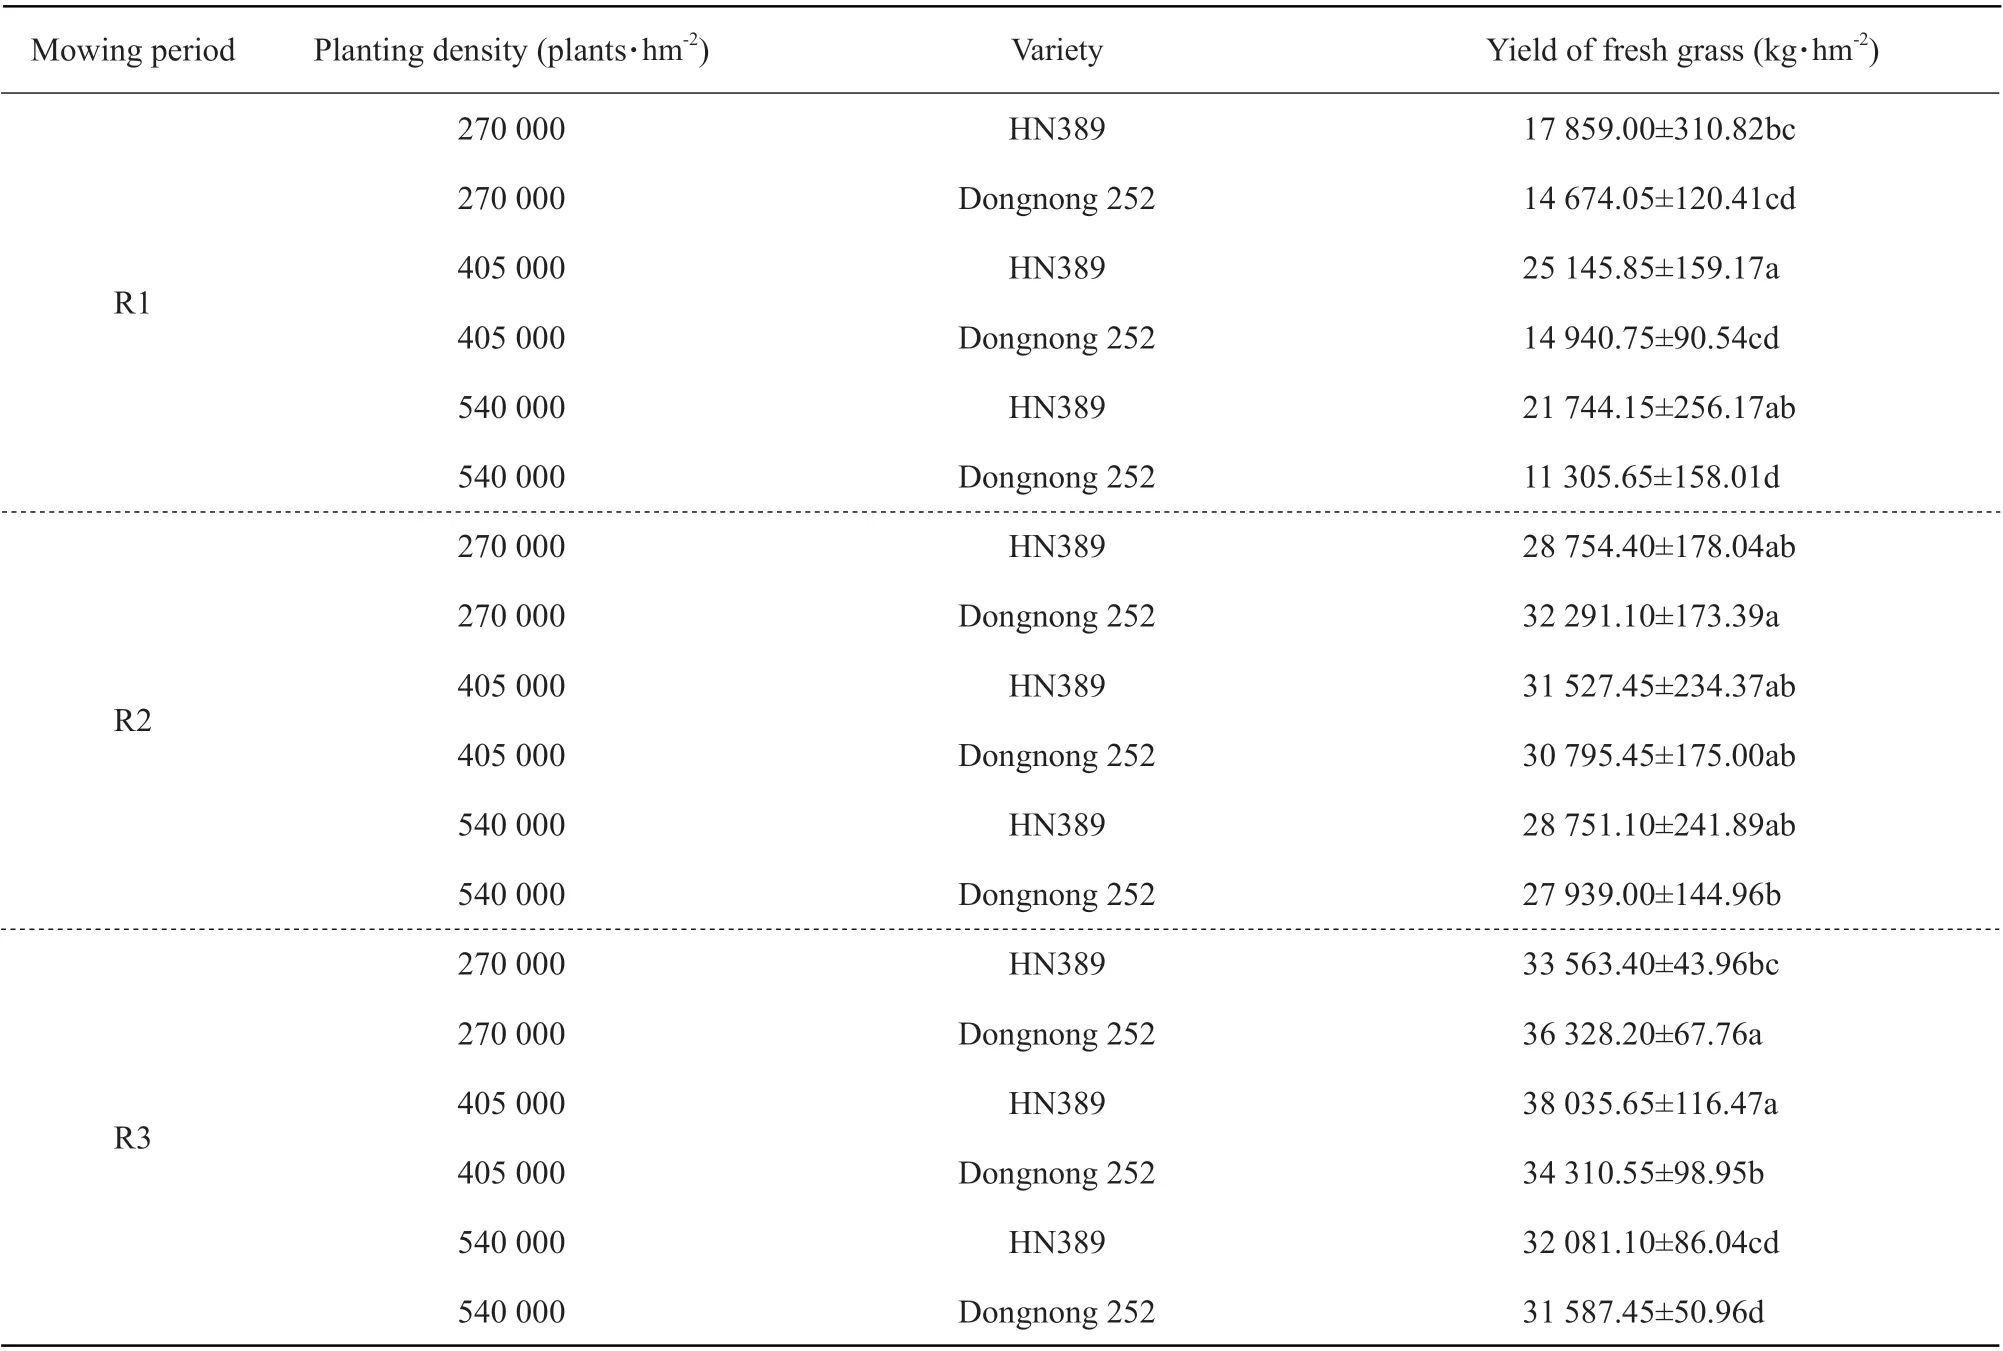
Plant height and fresh weight per plant could best reflect the growth of plants. As shown in Table 1,the plant height of HN389 at the R1 stage showed a rising trend with the increase in planting densities.When the planting density was 540 000 plants • hm-2,the maximum mean plant height reached 89.83 cm.The fresh weight, dry weight, stem weight and leave weight of HN389 and Dongnong 252 plants decreased with the increase of planting densities, and HN389 had no significant difference in stem/leaf ratio, then Dongnong 252 leaves significantly higher with the increase of planting densities, suggesting that the influences of planting densities on different varieties of soybean yield-related traits were different. HN389 with the planting density from 270 000 plants • hm-2to 540 000 plants • hm-2, the yield of fresh grass increased first and then decreased significantly. When the planting density was 405 000 plants • hm-2, the yield of fresh grass was the highest, and the average yield per hectare was 25 134.03 kg. The yield per hectare of HN389 was significantly higher than that of Dongnong 252, when the planting densities were 270 000 and 405 000 plants • hm-2(P<0.05), as shown in Table 2.
The plant height of HN389 at the R2 stage increased with the increase of planting densities, and the highest plant height was 105.61 cm at the planting density of 540 000 plants • hm-2. The fresh weight and dry weight per plant of both cultivars decreased with the increase in densities. At the planting density of 270 000 plants • hm-2, the average fresh weight per plant of HN389 was 158.773 g, which was 13.72%-15.76%higher than that of 405 000 and 540 000 plants • hm-2,respectively. The dry weight per plant of HN389 was slightly lower than that of Dongnong 252 at the same density. In terms of stem/leaf ratio and pod ratio, pod ratio gradually decreased with the increase of planting densities, while stem/leaf ratios gradually increased with the increase of planting densities, as shown in Table 1.HN389 fresh grass yield increased with planting densities from 270 000 plants • hm-2to 405 000 plants • hm-2and then decreased significantly, when planting density was 540 000 plants • hm-2(P<0.05). At the R2 stage,when the planting density was 405 000 plants • hm-2,the yield of fresh grass was the highest, the average yield of HN389 was 2 101.865 kg • hm-2, and the yield of HN389 was always higher than that of Dongnong 252, as shown in Table 2.
The variation trend of plant height at the R3 stage was the same as that at the R1 and R2 stages, and the highest plant height was 110.22 cm at the planting density of 540 000 plants • hm-2. Other indexes, except stem/leaf ratio, all decreased with the increase of planting densities, which was the same trend as that at the R2 stage. HN389 fresh grass yield increased with planting densities from 270 000 plants • hm-2to 405 000 plants • hm-2and then decreased obviously,when planting density reached 540 000 plants • hm-2. At the R3 stage, when the planting density was 405 000 plants • hm-2, the highest average yield of fresh grass was 38 035.53 kg • hm-2, and the yield of HN389 per hectare was significantly higher than that of Dongnong 252 (P<0.05). Under the same density, the yield order of the R1, R2 and R3 fresh grass per hectare was R3>R2>R1, as shown in Table 2.

Table 1 Effects of planting density at different stages on yield-related traits of forage soybean HN389

Table 2 Effects of different planting densities at different stages on yield of HN389
Effects of planting density on nutritional indexes of forage soybean HN389
It could be seen from Table 3 that at the R1 stage, the nutrient indexes of HN389 and the control variety showed no significant change trend. Under the planting environment of 270 000 plants • hm-2, the average contents of HN389, CP and EE slightly higher than those of other planting densities, while the average content of NDF and ADF was lower than that of other planting densities, with the contents of CP, NDF,ADF and EE being 18.644%, 41.003%, 25.075% and 3.387%, respectively.
There was no significant difference in CP content between HN389 at the R2 stage and the control variety Dongnong 252, and the contents of HN389 CP,NDF and ADF at the R2 stage were higher than those at the R1 stage. Under the planting environment of 270 000 plants • hm-2, the average HN389EE content was slightly higher than that of other planting densities, while the average NDF and ADF content was lower than that of other planting densities, and the contents of CP, NDF, ADF and EE were 19.212%,43.135%, 26.54% and 3.25%, respectively, as shown in Table 3.
As shown in Table 3, at the R3 stage, the nutrient indexes of HN389 and the control variety showed no obvious change trend. Compared with the R2 stage,CP, NDF and ADF contents of HN389 and the control cultivars decreased at the R3 stage, while the EE content increased. Under the planting environment of 270 000 plants • hm-2, the average content of HN389 CP, NDF, ADF and EE was higher than that of other planting densities, and the contents of CP, NDF, ADF and EE were 17.945%, 41.505%, 23.258% and 4.033%,respectively.

Table 3 Effects of planting densities on feeding traits of forage soybean HN389 at different stages
Determination of planting densities and cutting time of forage soybean variety HN389
Different planting densities and cutting time had different effects on forage yields and nutrient indexes. To further explore the optimal planting density and cutting time of feeding soybean strain HN389, principal component analysis (PCA) was used to analyze and comprehensively evaluate the five forage indexes of CP, NDF, ADF, EE and fresh grass yield. The characteristic value, contribution rate and cumulative contribution rate of forage quality evaluation of feeding soybean strain HN389 are shown in Table 4. The characteristic value and the cumulative contribution rate were the main basis for determining the principal component. The extraction of the principal component was usually based on the principle that the cumulative contribution rate was greater than 85%. Therefore, two principal components could be extracted in this experiment, with the cumulative contribution rate reaching 90.053%,which could explain the variance of 90.053%.Among them, CP, NDF and ADF were the main indexes reflecting the nutritional qualities of soybean HN389, indicating that CP, NDF and ADF were the leading factors determining the nutritional qualities of soybean HN389. The characteristic value of principal component 2 was 0.885, and the contribution rate was 17.708%, in which the yield of fresh grass was the largest, indicating that principal component 2 was the yield factor of soybean HN389. Therefore, the two extracted principal components could summarize most of the nutritional qualities and yield information of feeding soybean variety HN389.
Through the analysis of the characteristics of the contribution rates of the two principal components, the following expression could be obtained:
Principal component score=factor score×arithmetic square root of eigenvalue.
Namely, principal component 1 score=factor score 1×1.902, principal component 2 score=factor score 2×0.941.
Composite score = principal component 1 score +principal component 2 score.
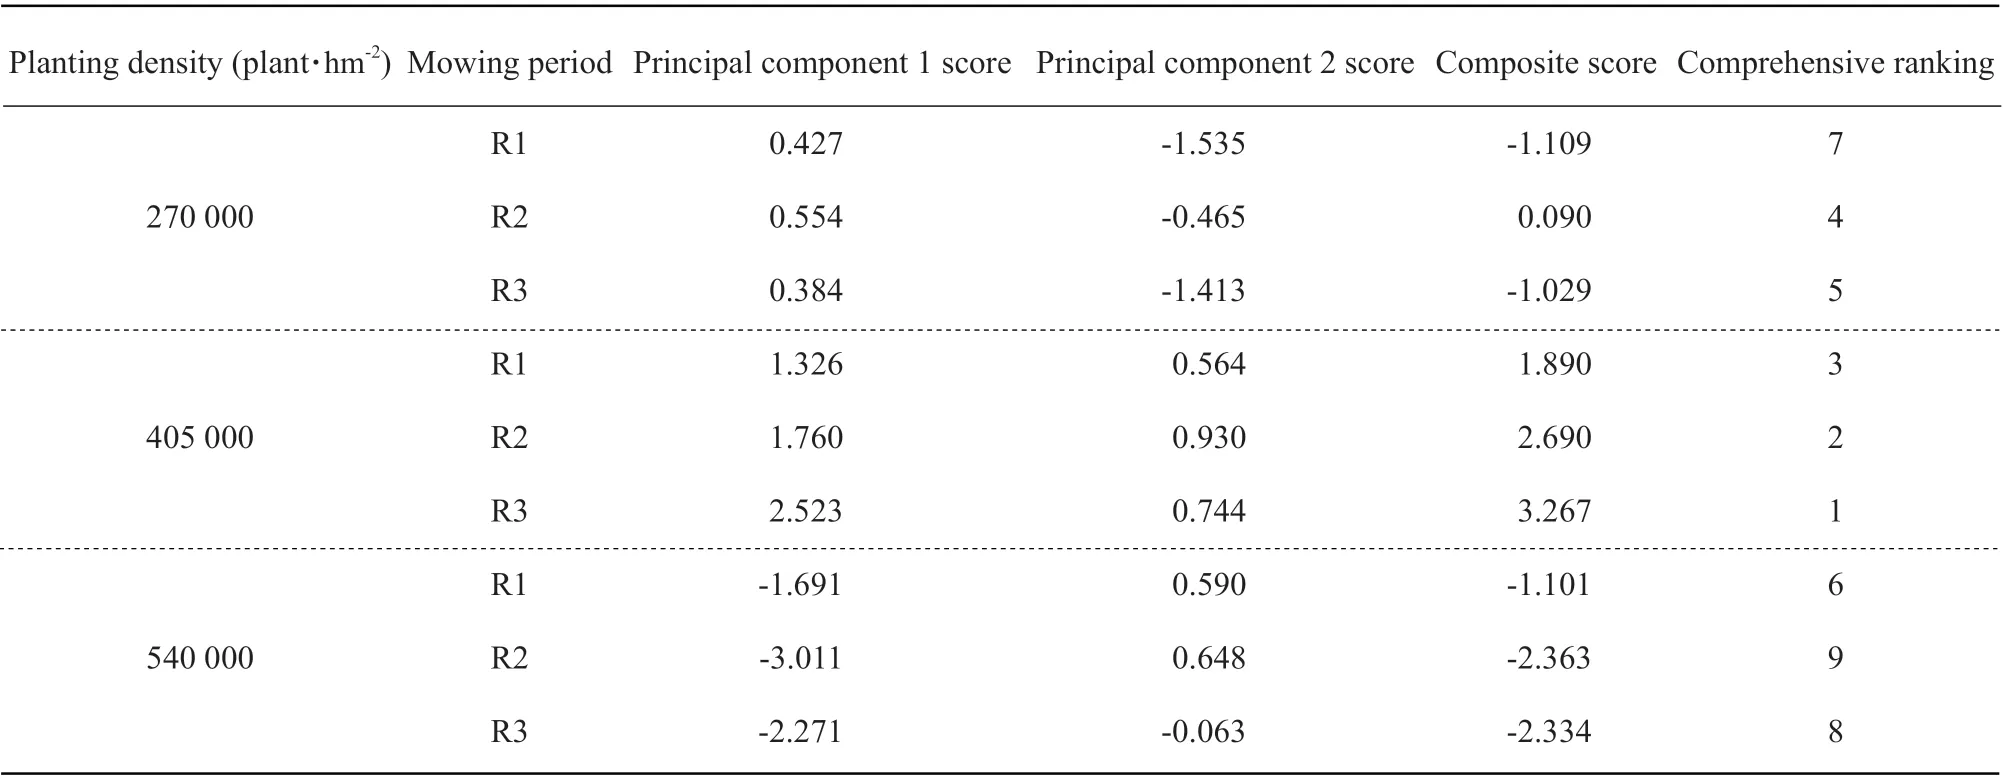
It could be seen from Table 5 that the comprehensive score and ranking of feeding soybean strain HN389 under different planting densities and cutting periods could be obtained through calculation. Among all the planting densities and cutting periods, HN389 had a planting density of 405 000 plants • hm-2and the comprehensive score of cutting at the R3 stage was the highest. That was, HN389 forage performed best, when it was cut at the R3 stage and the planting density was 405 000 plants • hm-2.

Table 4 Principal component characteristic value, contribution rate and cumulative contribution rate of forage soybean strain HN389

Table 5 Comprehensive evaluation of forage value of forage type soybean strain HN389 under different planting densities and cutting periods
Discussion
In this experiment, the three planting densities were set up, the high-quality grain type soybean variety Dongnong 252 was used as the reference control, and the feeding type soybean strain HN389 was measured in terms of yield-related traits and feeding traits at the growth stages of the R1, R2 and R3 in the two environments, respectively. The results showed that different planting densities had a great influence on yield-related traits of soybean. In this study,increasing planting densities made the fresh weight per plant, dry weight per plant, stem dry weight, leaf dry weight, pod dry weight, stem leaf ratio and pod weight proportion generally decrease, it was the same as the results of Suoet al. (2020) on the agronomic traits and aboveground biomass of soybean strain 15 that high planting densities resulted in thinning of soybean main stem and decrease of aboveground biomass per plant. While, it was different from the results of Suoet al. (2020) that over-dense planting would lead to a significant decrease in plant height.In this experiment, plant height of soybean at the R1, R2 and R3 stages increased with the increase of planting densities. However, this was the same as the research results of Songet al.(2020), which might be due to the differences caused by different cultivation management techniques and varieties. Compared with the change of stem dry weight, the change of leaf dry weight was small, probably because the leaf weight accounted for the whole plant weight was small (Tianet al., 2021).
According to the results of nutritional quality traits, planting densities had no significant influence on the contents of CP, NDF, ADF and EE, which was consistent with the results of Hintzet al.(1992)on grain soybean. In contrast, soybean varieties had a more obvious effect on feeding traits, which was consistent with the results of Duet al(2016).Soybean was used as forage mainly because of its high protein content, and HN389 could be used as high-quality forage grass because of its similar forage characteristics, especially the CP content with grain type soybean Dongnong 252.
In this experiment, the content order of HN389NDF and ADF were R2>R1>R3, and the content order of EE was R3>R1>R2. This was similar to the research results of Leeet al.(2014) on the yield and quality of soybean forage obtained by interspecific hybridization of wild soybean and cultivated soybean at the R2,R4 and R6 growth stages, respectively. The contents of NDF and ADF at the R4 stage were higher than those at the R2 and R6 stages, and the content of EE at the R6 stage was much higher than that at the R2 and R4 stages. However, different from the fact that the CP content at R6 stage was higher than that at the R2 and R4 stages, the CP content of HN389 was the highest at the R2 stage in this experiment, which was the same as the research results of Hintzet al.(1992)on cultivated soybean, the CP contents in stems and leaves decreased with the delay of the growth period,which might be because the accumulation of protein in soybean seeds was a dynamic process with the development of soybean seeds, and there were some differences among different varieties (Wuet al.,2021). This result was also similar to the results of researches on wild soybean harvest season: the CP content decreased with the delay of the growing season (Liet al., 2008), and this result might also be related to the increase of rainfall in the test site after the R2 stage.
In this study, soybean yield per plant varied greatly under different planting densities. Theoretically, the higher the planting density, the higher the yield of soybean per unit area; however, when the planting densities exceed a certain range, the increase of canopy densities would affect the efficiency of the photosynthetic effect, and the direction of increasing yield would change to decreasing yield (Lianget al.,2021). Over time, it would lead to the deterioration of population structure, due to the increase of inter-plant humidity, insufficient temperature, early ridge sealing,poor ventilation and another harsh growth environment that would lead to the soybean root absorption of water, nutrient capacity weakened. In addition to poor root development, thin stems were prone to lodging,early production of a large number of yellow leaves,plant overground due to insufficient nutritional supply and slow growth, and flower pod shedding, resulting in reduced yield. Therefore, to determine the reasonable planting densities of forage soybean, it was necessary not only to guarantee certain nutritional value, but also have a reasonable population structure, and coordinate the relationship between vegetative growth and reproductive growth (Yanget al., 2021), make better use of land efficiency to achieve high yield and high efficiency.
In this experiment, when the density reached 405 000 plants • hm-2, HN389 harvested the highest yield of 38 035.53 kg • hm-2at the R3 stage, which was the same as the research results of Anet al.(2020)that planted Qiandou No. 1 with a planting density of 360 000 plants • hm-2and Suoet al.(2020) that planted hybrid soybean strain 15 with a density of 60 cm row spacing and 40 cm plant spacing and achieved a maximum fresh grass yield of 47 500 kg • hm-2. In addition, the yield of fresh grass of HN389 under high density was significantly higher than that of the control group, which indicated that HN389 had better resistance to dense planting and was more conducive to efficient utilization of land resources.
Conclusions
In conclusion, increasing planting densities could improve plant height to a certain extent, but excessive planting densities directly led to a decrease in fresh and dry weight per plant of soybean. In the three cutting periods, the order of yield of fresh grass per hectare was R3>R2>R1, and the yield of fresh grass of HN389 was higher than that of Dongnong 252.Soybean as a forage plant had high nutritional value and yield, and planting densities had no significant effects on its nutritional indexes, but the contents of nutrients were different at different cutting stages,the CP content was the highest at the R2 stage, the NDF and ADF content was the lowest at the R3 stage, and EE contents were the highest. According to principal component analysis, HN389 had the best performance, when it was cut at the R3 stage and the planting density was 405 000 plants• hm-2, and its CP,NDF, ADF and EE contents were 17.61%, 17.61%and 21.54% and 3.81%, respectively. HN389 had the highest yield of 38 035.53 kg • hm-2, when the cutting density was 405 000 plants • hm-2at the R3 stage.
杂志排行
Journal of Northeast Agricultural University(English Edition)的其它文章
- Study on Antibacterial Effects of Purple, Yellow and White-skinned Onions
- Effects of Different Ventilation Modes and Outlet Height on Nursery Piggery Environment
- Measurement of Grain Production Efficiency in Main Grain-producing Areas and Analysis of Inter-provincial Differences
—— A Study Based on Super-SBM Model and Malmquist Index - Effects of Encapsulated Enzyme and Yeast Products on in Vitro Rumen Fermentation
- Attribution of Antioxidation of Quercetin in Vitro and Arbor Acre Broilers
- Study on Exogenous Ethylene Induced Rice Resistance to Rhizoctonia solani
