A topotactic tailored synthesis of waxberry-like mixed-phase TiO2 hollow spheres for dye-sensitized solar cells
2022-06-18YngHongWuKiYnYunYnHeHengWuLiJioGngWngXioDongQioBingXinLeiZhenFnSunZhoQingLiu
Yng-Hong Wu, Ki-Yn Yun, Yn-E He, Heng Wu, Li-Jio M, Gng Wng,Xio-Dong Qio, Bing-Xin Lei,*, Zhen-Fn Sun, Zho-Qing Liu
a School of Chemistry and Chemical Engineering, Key Laboratory of Electrochemical Energy Storage and Energy Conversion of Hainan Province, Key Laboratory of Electrochemical Energy Storage and Light Energy Conversion Materials of Haikou City, Hainan Normal University, Haikou 571158, China
b School of Chemistry and Chemical Engineering/Institute of Clean Energy and Materials/Guangzhou Key Laboratory for Clean Energy and Materials/Huangpu Hydrogen Innovation Center, Guangzhou University, Guangzhou 510006, China
ABSTRACT The waxberry-like mixed-phase TiO2 hollow microstructures (WMTHMs) are controllably prepared via a topotactic synthetic method, involving the synthesis of monodispersed CaTiO3 precursors by a solvothermal method and subsequently transforming them into TiO2 through a Na2EDTA-assisted ion-exchange process.The ratio of anatase-rutile is adjustable, and the two phases are connected well with each other.WMTHMs are composed of radially aligned nanorods, speeding up the electron transport.The optimum WMTHMs sample shows a specific surface area of 68.05 m2/g and exhibits an excellent light scattering capacity.The cell based on WMTHMs light scattering layer obtained an optimal efficiency of 9.12%.The improvement of cell efficiency is mainly attributed to the high specific surface area, the efficient light scattering, the appropriate ratio of anatase-rutile, the staggered bandgap structure, and the convenient one-dimensional electron transport channel.
Keywords:Titanium dioxide Phase composition Topotactic methodology Hollow sphere Dye-sensitized solar cell
Since the pioneer work of O’Regan and Grätzel in 1991, the dyesensitized solar cell (DSSC) has been a competitive photovoltaic device due to its advantages of low cost, easy of manufacture and remarkable energy conversion efficiency (η) [1,2].To boost the total performance of DSSCs, many researchers have optimized components, such as photoanodes [3], electrolytes [4,5], sensitizers [6,7],and counter electrodes [8,9].As one of the core components, the photoanode undertakes dye loading and charge transport.Among these studied photoanode materials, TiO2nanoparticle photoanode has attracted widespread attention due to its eco-friendliness, high chemical stability, and high specific surface area [10].However,this kind of photoanode film reveals lower light scattering ability due to its smaller particle size [11].Furthermore, TiO2nanoparticle photoanode has disordered electron transport channels, thereby affecting the charge transfer and collection efficiency.
As is well known, TiO2hollow structures are more effective to improve light scattering ability and facilitate the electrolyte diffusion than solid ones, which result in a better DSSCs performance[12,13].The tailoring of TiO2hollow structures is a crucial means to improve the efficiency of DSSCs.Up to present, TiO2hollow structures with tailored textural properties are prepared through a variety of methods [14].The most adopted method for the tailoring synthesis of hollow structure is a template method, including hard templates (mono-dispersed silica [15,16] or polystyrene beads[17,18]) or soft templates (surfactant micelles/vesicles [19], emulsion droplets [20] or gas bubbles [21]).For CaTiO3templates, Ca2+is easily exchanged from the perovskite Ti-O frameworks in an acidic medium [22].CaTiO3is chosen to act as self-template for the formation of TiO2via a topotactic synthetic method, which is in favor of tailoring desirable morphology.Due to the well-matched lattice spacings between CaTiO3and TiO2, TiO2can perfectly inherit the CaTiO3morphology, guaranteeing a strong mechanical stability of TiO2structure.
In addition, the anatase/rutile-mixed phase TiO2is an effective photoanode material.The tailoring of the ratio of anataserutile is very important to enhance the performance of DSSCs.For the preparation of anatase/rutile-mixed phase TiO2, two kinds of preparation methods are popular.One of the preparation methods is a mechanical mixing method, which cannot guarantee that the two phases are in close contact and the electron-hole pair separates effectively.The annealing treatment is another preparation method, which easily leads to particle aggregation.Therefore, for the tailoring of TiO2hollow structures, it is crucial to adopt a suitable preparation method concentrating various functions.
In this work, the waxberry-like mixed-phase TiO2hollow microstructures (WMTHMs) were fabricated via a topotactic synthetic method.WMTHMs are composed of radial TiO2nanorods.The ratio of rutile-anatase can be changed by adding FeCl3.The optimized DSSCs of the assembled double-layer P25 + WMTHMs photoanode obtained an excellentηof 9.12%, which was superior to the DSSC of the pure P25 photoanode (8.12%).
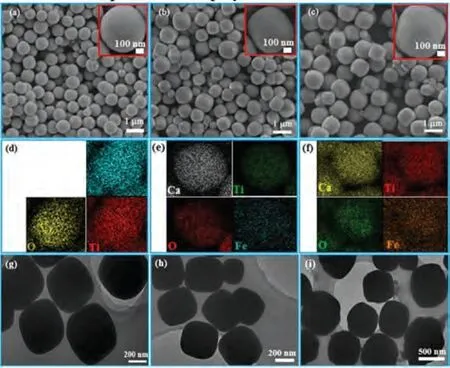
Fig.1 shows the FESEM, EDS mapping and TEM images of the as-prepared CaTiO3-Fenprecursors.As shown in Figs.1a-c,the as-prepared CaTiO3-Fenprecursors are nearly spherical structure in shape and their surfaces are rather smooth.The individual spheres are mutually separated without aggregation.As the amount of FeCl3increases, the shape of the CaTiO3-Fenspheres is not changed, but the diameter of CaTiO3-Fenvaries from 120 to 160 and 270 nm.The EDS mapping of CaTiO3-Fe0(Fig.1d) clearly reveals that the three elements (Ca, Ti, and O) are evenly distributed throughout the sample.The EDS mappings of CaTiO3-Fe1(Fig.1e) and CaTiO3-Fe2(Fig.1f) indicate that the four elements(Ca, Ti, O and Fe) are distributed over the entire samples.TEM results (Figs.1g-i) confirm that all CaTiO3-Fenprecursors display a solid structure.

Fig.1.FESEM, EDS mapping and TEM images of CaTiO3-Fen precursors: (a, d and g) CaTiO3-Fe0, (b, e and h) CaTiO3-Fe1 and (c, f and i) CaTiO3-Fe2.The inset is highresolution FESEM images.
XRD patterns of the as-prepared CaTiO3-Fenprecursors are shown in Fig.S1a (Supporting information).XRD patterns of CaTiO3-Fe1and CaTiO3-Fe2are similar to that of CaTiO3-Fe0.The diffraction peaks (2θ= 23.2°, 33.1°, 38.9°, 40.7°, 47.5°, 53.3°, 59.3°,69.5° and 79.1°) correspond to the (101), (121), (211), (220), (202),(301), (042), (242) and (323) planes of perovskite-type CaTiO3(JCPDS No.42-0423).Nevertheless, the Fe-containing species are not detected by XRD, which may be attributed to the low content in CaTiO3-Fe1and CaTiO3-Fe2.Fig.S1b (Supporting information) shows the enlarged XRD curves of CaTiO3-Fenin the range of 31-35°.With increasing Fe content, the (121) diffraction peak gradually shifts to a larger angle, verifying the distortion of CaTiO3crystal lattice by Fe dopant.It is well known that Ti4+(0.75) and Fe3+(0.79) have similar ionic radius, which may lead to the exchange of Ti4+and Fe3+in CaTiO3for the formation of new species[23].Fe may also exist in Fe2O3from the reaction of FeCl3during a solvothermal process.For CaTiO3-Fe1and CaTiO3-Fe2, Fe may exist in Fe2O3or the formation of new species.
The surface chemical states of CaTiO3-Fe1and CaTiO3-Fe2are characterized by XPS (Fig.S2 in Supporting information).Fig.S2a shows the survey spectra of CaTiO3-Fe1.For the XPS spectra of Ca 2p (Fig.S2b), the major peaks at 349.8 eV and 346.3 eV correspond to the binding energies of Ca 2p1/2and Ca 2p3/2, respectively.For the XPS spectra of Ti 2p (Fig.S2c), the two major peaks, centered at around 458.1 eV and 463.8 eV, are ascribed to Ti 2p3/2and Ti 2p1/2of the Ti4+states, respectively.For the XPS spectra of O 1s(Fig.S2d), the major peak centered at 529.5 eV can be attributed to the Ti-O band, which corresponds to the O2-state in the lattice of CaTiO3-Fe1.For the XPS spectra of Fe 2p (Fig.S2e), the Fe 2p3/2peak at 710.2 eV corresponds to Fe3+state [24].In XPS spectra,there is no significant difference between CaTiO3-Fe1(Figs.S2a-e)and CaTiO3-Fe2(Figs.S2f-j).The results demonstrate that the Fecontaining species exists in CaTiO3-Fe1and CaTiO3-Fe2.

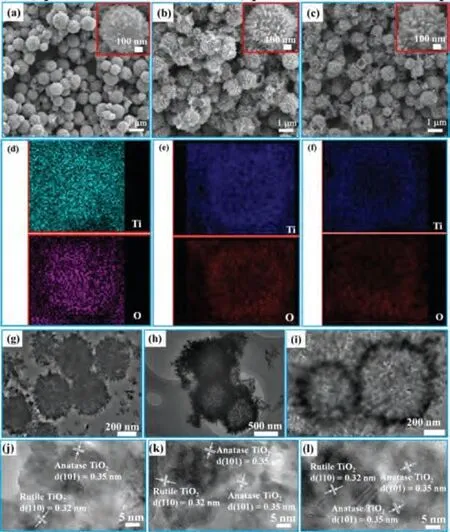
Fig.2.FESEM, EDS mapping, TEM and HRTEM images of WMTHMs: (a, d, g and j)WMTHMs-0, (b, e, h and k) WMTHMs-1 and (c, f, i and l) WMTHMs-2.
Fig.2 shows the FESEM, EDS mapping and TEM images of the as-prepared WMTHMs-n samples.As shown in Fig.2a, the WMTHMs-0 is composed of a large quantity of uniform, rough spheres with a diameter of around 0.95-1.10 μm.The highresolution FESEM (inset of Fig.2a) displays a waxberry-like TiO2hollow sphere.Observingly, WMTHMs-0 consists of tiny short rods with dense state.With increasing the Fe content in the precursor,the diameter of WMTHMs-1 (Fig.2b) increases to 1-1.30 μm, and the external structure of spheres has changed.The high-resolution FESEM (inset of Fig.2b) displays the WMTHMs-1 is composed of nanorods with a diameter of about 70-80 nm, and the growth direction of these nanorods is nearly radially on the external surface of sphere.Moreover, the hollow interior is clearly observed from some broken spheres, which is favorable for enhancing the light scattering ability.With further increasing the Fe content in the precursor, as shown in Fig.2c, WMTHMs-2 shows the same external structure as WMTHMs-1.WMTHMs-2 with a diameter of 1-1.20 μm is also composed of nanorods with a diameter of about 45-55 nm.The EDS mapping images (Figs.2d-f) indicate that Ti and O elements are distributed homogeneously in three kinds of WMTHMs.The as-prepared WMTHMs-n samples are further characterized by TEM.In Fig.2g, WMTHMs-0 consists of tiny nanorods and displays a hollow structure.In the case of little amount of FeCl3added,WMTHMs-1 (Fig.2h) and WMTHMs-2 (Fig.2i) samples are composed of radially arranged nanorods and display a hollow structure.Ca2+ions are exchanged with H+ions in the presence of Na2EDTA.The out-diffusion rate of Ca2+ions is much faster than the in-diffusion rate of H+ions, which results in the formation of hollow structure [25].TiO2evolves from CaTiO3by a dissolutionrecrystallization process.Meanwhile, Fe-containing species are removed with the assistance of Na2EDTA.For WMTHMs-n, Figs.2j-l demonstrate that the lattice spacings of 0.32 nm and 0.35 nm correspond to the (110) plane of rutile and the (101) plane of anatase TiO2, respectively.

Fig.3.(a) XRD patterns, (b) N2 adsorption-desorption isotherms and (c) pore size distribution curves of WMTHMs-0, WMTHMs-1 and WMTHMs-2.
The composition of WMTHMs-n is confirmed by XRD (Fig.3a).The diffraction peaks at 2θ= 37.9° and 48.2° are indexed to the(004), (200) crystal planes of anatase TiO2(JCPDS No.73-1764).Other peaks at 2θ= 36.1°, 41.2°, 54.3°, 56.6°, 62.8°, 69.8° and 72.4°, are indexed to the (101), (111), (211), (220), (002), (112) and(311) crystal planes of rutile TiO2(JCPDS No.78-2485).For all the as-prepared WMTHMs-n, the coexisting anatase and rutile phases are in agreement with TEM.As expected, the anatase/rutile mixed TiO2has excellent charge separation efficiency [26,27].The ratio of rutile-anatase can be calculated by the following Eqs.1 and 2 [28]:

here,Wr, Wa, AaandArrepresent the rutile content, the anatase content, the integrated intensity of anatase (101) peak, and the integrated intensity of rutile (110) peak, respectively.The ratio of anatase-rutile is listed in Table S1 (Supporting information).The result indicates that the ratio of anatase-rutile is affected by the Fe content of the precursor.With the increase of Fe content in the precursor, the rutile content increases.That is to say, the ratio of anatase-rutile in WMTHMs-n can be successfully controlled by simply adjusting the amount of FeCl3.XRD patterns of the WMTHMs-1 and WMTHMs-2 show no traces of other phases like Fe2O3or FexTiOy.It is believed that the ion-exchange reaction may occur between Fe-containing species and H+with the assistance of Na2EDTA.
As we know, both Ti4+ion (0.75) and Fe3+ion (0.79) have similar ion radius, which indicates that Fe3+ions may enter CaTiO3lattice to replace Ti4+sites [23].Based on simple charge compensation grounds, the formation of oxygen vacancies would generate due to the substitutional incorporation of Fe3+, which can offer space for the atomic arrangement [29].Besides, the oxygen vacancies increase with increasing Fe content, so the mass fraction of rutile phase increases with increasing Fe content [29].During transformation CaTiO3-Fe into TiO2through a Na2EDTA-assisted ionexchange process, Fe content can affect the ratio of anatase-rutile in WMTHMs.
The co-existence of anatase and rutile phases in the WMTHMs-1 and WMTHMs-2 is further characterized by Raman spectroscopy(Fig.S3 in Supporting information).The peaks appeared at 147 cm-1(Eg), 397 cm-1(B1g), 512 cm-1(A1g) and 639 cm-1(Eg) are well matched with the anatase TiO2modes.The three peaks of rutile centered at 239, 445 and 614 cm-1are attributed to multiproton process, Egand A1gof the rutile modes [30].It clearly indicates that both WMTHMs-1 and WMTHMs-2 are made of anatase and rutile phases, without other phases like Fe2O3or FexTiOy,which is also in agreement with XRD results.
The surface characterization of WMTHMs-1 and WMTHMs-2 are performed by XPS.As shown in Fig.S4a (Supporting information), the XPS survey spectra of WMTHMs-1 show the existence of Ti and O elements and the absence of Fe3+.In Fig.S4b (Supporting information), the two peaks, presented at around 463.8 eV and 458.1 eV, are attributed to Ti 2p1/2and Ti 2p3/2of the dominant Ti4+state, respectively [31].In Fig.S4c (Supporting information),the peak at 529.4 eV is ascribed to the lattice oxygen in TiO2, indicating the presence of an oxygen environment.In XPS spectra,there is no significant difference between WMTHMs-2 (Figs.S4df in Supporting information) and WMTHMs-1 (Figs.S4a-c in Supporting information).
The BET specific surface area and pore size distribution of WMTHMs-n samples are investigated by N2adsorption-desorption measurement.In Fig.3b, all N2adsorption-desorption isotherms show typical IV-type isotherms with an H2 hysteresis loop according to IUPAC classification, which are characteristic of mesoporous materials [32,33].The WMTHMs-0 and WMTHMs-1 samples exhibit ideal specific surface area of 64.76 m2/g and 68.05 m2/g, respectively, which are higher than WMTHMs-2 (43.41 m2/g)and the commercial P25 (~50 m2/g).Therefore, the WMTHMs-0 and WMTHMs-1 samples can facilitate the dye adsorption of DSSCs.Fig.3c reveals the corresponding pore size distribution of WMTHMs-n samples.With the increase of Fe content in the precursor, the pore diameter has a decrease.The pore size of the asprepared WMTHMs-0, WMTHMs-1 and WMTHMs-2 are 19.2, 15.2,and 12.6 nm, respectively.The relatively wide pore size distributions are beneficial to electrolyte diffusion.This result indicates the Fe content of the precursor exerts a great effect on the textural structure.

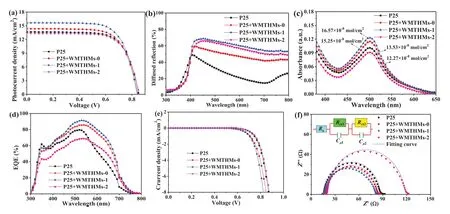
Fig.4.(a) J-V curves, (b) diffuse reflectance spectra, (c) UV-vis absorption spectra, (d) EQE spectra, (e) dark J-V and (f) EIS curves of DSSCs based on different photoanode films.

Table 1 Detailed photovoltaic parameters of DSSCs based on different photoanode films.
TheJ-Vcurves are displayed in Fig.4a and their corresponding photovoltaic characteristics (Jsc: short-circuit current density,Voc: open-circuit voltage,FF: fill factor, andη) are summarized in Table 1.From Table 1, the four cells have a similarFF, while bothJscandηexhibit an increase and then decrease with the increasing Fe content in the precursor.The cells based on WMTHMs-0 and WMTHMs-1 scattering layer photoanodes have achieved higherη(8.38% and 9.12%) than that of the Cell-P25 without scattering layer (8.12%).However, introducing an additional scattering layer of WMTHMs-2, theηof Cell-P25 + WMTHMs-2 decrease to 7.96%.Theηinitially increases from 8.38% to 9.12% with the increasing Fe content in the precursor, which is attributed to the synergistic effects of the appropriate ratio of anatase-rutile, the convenient onedimensional electron transport channel, the superior light scattering ability and the higher dye loading amounts.The mixedphase TiO2can form a synergistic effect between anatase and rutile crystals.The photo-generated electrons coming from N719 inject into the rutile phase TiO2and then migrate to the anatase phase TiO2.Such staggered bandgap can suppress charge recombination, thereby improving the efficiency of DSSCs.However, when the Fe content of the precursor is further increased, theηdecreases from 9.12% to 7.96%, which may be due to the unsuited ratio of anatase-rutile, the inferior light scattering capacity and the lower dye loading amounts.Compared with CaTiO3-Fenlight scattering layer, the DSSCs based on the WMTHMs-n show higher effi-ciency, as shown in Fig.S5 and Table S2 (Supporting information).
It is well known that theJscis closely related to the light scattering capacity and the amounts of dye loading.To study the effect of light scattering capacity on theJsc, the diffuse reflection property of the as-prepared photoanode films without N719 dye loading is investigated.In Fig.4b, the diffuse reflection property of P25 + WMTHMs-0, P25 + WMTHMs-1 and P25 + WMTHMs-2 films is obviously higher than that of the pure P25 film, which is expected to exhibit a better light scattering capability of the WMTHMs-n layer.For the WMTHMs-n, besides that the comparable sphere size to the wavelength of visible light plays an important role in enhancing light scattering, their hollow structure can confine the incident light within the photoanode by light refraction between the wall and the air-filled pore, as shown in Fig.S6(Supporting information).
The amounts of N719 dye anchored on the four films are investigated using 0.1 mol/L NaOH solution.UV-vis absorption spectra of dye molecules are shown in Fig.4c.The order of dye loading capability is: Cell-P25 + WMTHMs-1 (16.57 × 10⁻⁸mol/cm2)>Cell-P25 + WMTHMs-0 (15.25 × 10⁻⁸mol/cm2)>Cell-P25(13.53 × 10-8mol/cm2)>Cell-P25 + WMTHMs-2 (12.27 × 10⁻⁸mol/cm2), which are closely related to their BET specific surface areas and ratio of anatase-rutile.Due to the higher light scattering capacity and bigger dye loading capability, Cell-P25 + WMTHMs-1 demonstrates an optimumJsc.
The differences inJscof the four cells are further investigated by measuring EQE spectra.Fig.4d shows the EQE spectra as a function of wavelength for the four cells.The high EQE values in the short wavelength range are mainly attributed to the higher dye loading capability, and the somewhat higher EQE values in the long wavelength range of 600-750 nm are ascribed to the more efficient light scattering of the WMTHMs-n layer.Considering that dye loading capability and the diffuse reflection, Cell-P25 + WMTHMs-1 possesses higher EQE values over a wide range than Cell-P25.However, Cell-P25 + WMTHMs-1 shows lower EQE values than Cell-P25 in the short wavelength range, whereas it is just the opposite in the long wavelength range.
The darkJ-Vcharacteristics reflects the recombination of injected electrons with I3-.In Fig.4e, the dark current densities of the Cell-P25 + WMTHMs-n are 4.09, 5.51 and 2.35 mA/cm2at 0.80 V, respectively.On the contrary, the P25 + WMTHMs-2 electrode displays a low current density, indicating the low recombination loss.The relatively high dark current density of P25 + WMTHMs-1 electrode means a high interface recombination loss, which could be explained by the enlarged recombination.The high recombination loss leads to a decrease inVoc, which is agreement with theVocvalue.
To further make out the electron transport and interface recombination process in the four cells, EIS of Cell-P25 + WMTHMsn are measured (Fig.4f).In Fig.4f, the smaller semicircle is assigned to the charge transfer resistance (Rct1) at the electrolyte/Pt counter electrode, while the larger semicircle is assigned to the charge recombination resistance (Rct2) at the TiO2/dye/electrolyte interfaces.TheCμrepresents the chemical capacitance.The data are analyzed using Z-view software with an equivalent circuit (inset of Fig.4f).The EIS parameters are listed in Table 1.TheRsandRct1values are almost identical because of the similar substrate, counter electrode, and I-/I3-electrolyte.From Table 1, theRct2of the four cells are distinguishing, and the order ofRct2value is: Cell-P25 + WMTHMs-2 (95.38Ω)>Cell-P25 (69.19Ω)>Cell-P25 + WMTHMs-0 (63.12Ω)>Cell-P25 + WMTHMs-1(61.36Ω).Based on the fittedRct2andCμ2, the electron lifetime(τe=Rct2×Cμ2) values are calculated to be 58.23, 55.16, 89.45 and 65.13 ms for Cell-P25 + WMTHMs-0, Cell-P25 + WMTHMs-1, Cell-P25 + WMTHMs-2 and Cell-P25, respectively.Obviously,the Cell-P25 + WMTHMs-1 shows the shortestτe, manifesting that Cell-P25 + WMTHMs-1 has the quickest electron recombination process.This may be attributed to the large surface area of WMTHMs-1 introduced many defects.This leads to rapid recombination of electrons at the photoanode/dye/electrolyte interface,which in turn reflects a shorteningτefor Cell-P25 + WMTHMs-1 [34].The shorterτefor the Cell-P25 + WMTHMs-1 also further supports its lowerVoc.The undesiredVocfor P25 + WMTHMs-1 electrode can be compensated by the highJscdue to the efficient light scattering and superior dye loading capability, making Cell-P25 + WMTHMs-1 endow a marked efficiency.
In this study, the anatase/rutile mixed TiO2hollow spheres were fabricated via a topotactic synthetic method using monodispersed CaTiO3precursor templates.The ratio of anatase-rutile was controlled through adding FeCl3content.WMTHMs-1 sample exhibited the best light scattering property and highest specific surface area.A double-layer photoanode consisting of WMTHMs-n used as light scattering layer and P25 as underlayer was designed.The DSSCs of the assembled double-layer P25 + WMTHMs-n photoanodes obtained aηof 8.38%, 9.12% and 7.96%, respectively.A maximumηof 9.12% was achieved by using the P25 + WMTHMs-1 bilayer photoanode, showing a marked improvement compared with the pure P25 photoanode (8.12%).The improvement of the efficiency was mainly attributed to the structure of WMTHMs-1,which can provide multiple scattering centers to enhance the light harvesting ability, the direct pathways for fast electron transfer, the appropriate ratio of anatase-rutile for quick charge separation, the staggered bandgap structure, and the high specific surface area for adsorbing dye.
Declaration of competing interest
The authors declare that they have no known competing financial interests or personal relationships that could have appeared to influence the work reported in this paper.
Acknowledgements
This work is financially supported by the National Natural Science Foundation of China (No.21965013), the Natural Science Foundation of Hainan Province (No.220RC590), and the Graduate Student Research and Innovation Program of Hainan Province (No.hsyx2019-17).
Supplementary materials
Supplementary material associated with this article can be found, in the online version, at doi:10.1016/j.cclet.2021.07.032.
杂志排行
Chinese Chemical Letters的其它文章
- Comment on “Acid-induced tunable white light emission based on triphenylamine derivatives”
- Strategies for efficient photothermal therapy at mild temperatures:Progresses and challenges
- Liposome-based delivery of biological drugs
- Macrophage-targeted nanomedicine for chronic diseases immunotherapy
- Advances, opportunities, and challenge for full-color emissive carbon dots
- Fluorine-containing agrochemicals in the last decade and approaches for fluorine incorporation
