Analysis on Interaction Effects Between Variety and Site of Silage Maize Regional Test in Guizhou Province
2022-06-18SHUZhongbingGOUXiaosongCHENLangWANGChunmeiRENHong
SHU Zhong-bing , GOU Xiao-song *, CHEN Lang , WANG Chun-mei , REN Hong
1. Zunyi Agricultural Sciences and Technology Research Institute, Zunyi 563100, PRC;
2. Guizhou Institute of Upland Crops, Guiyang 550006, PRC
Abstract Taking the yield in the second group of Guizhou silage maize regional test in 2019 as data information, 8 experimental sites and 12 silage maize varieties as experimental objects, the interaction effect between gene and environment was analyzed by using AMMI model. The results showed that the average fresh weight yield of each variety was 3 199.5~3 976.6 kg/667m2, among them, 5 varieties had an increase in the yield. Variety variation accounted for 10.51% of the total variation; experimental site variation accounted for 63.22% of the total variation;interaction effect variation between gene and environment accounted for 26.28% of the total variation; IPCA1 and IPCA2 variation accounted for 50.7% and 31.2% of the interaction variation, respectively; IPCA3 variation accounted for 7.25% of the interaction variation. g_4, g_8, g_9, g_10, g_11 and g_12 had better adaptability to e_1, e_2, e_6 and e_7; while g_1, g_2, g_3, g_5, g_6 and g_7 had better adaptability to e_3, e_4, e_5 and e_8. In consideration of yield, g_1 (Huinongqing 2) and g_9(Xinyu 666) were silage maize varieties with high and stable yield; g_3 (Hemuyu 905), g_8 (Wuhuayu 3) and g_11 (Liangdu 191) had general stability, and their yield was higher than that of the control; g_12 (Jinduyu 999) had the worst stability and low yield.
Key words Silage maize; AMMI model; Gene; Environment; Interaction effect
1. Introduction
Silage corn is a "complete feed", which can preserve nutrients to a great extent, compared with the seed corn, it has higher economic value[1]. Attributing to its high nutritional value and high biological yield, silage corn is widely used in feeding animals as an important part of roughage for ruminants[2-3]. Guizhou Province is a large province developing animal husbandry. Nevertheless, the shortage of feed grain has been the key issue inhibiting its development[4-5]. Due to the unique geographical location and ecological environment in mountainous areas of Guizhou Province, the yield of local silage corn is low and unstable,and the market is in short supply. Therefore, screening out new silage corn varieties with high yield, high quality and wide adaptability is an important way to solve the shortage of feed grain and develop animal husbandry in Guizhou Province[6].
Silage maize regional test is an important link in breeding and popularizing silage maize variety,a link between agricultural scientific research and agricultural production practice, and a key measure to objectively evaluate and identify the characteristics and application value of new silage maize varieties[7].Through regional test, select multiple sites representing the local soil, climate, farming system and production level in the same ecological type area, determine key agronomic traits such as high yield, adaptability and stability, of different varieties according to standard trial protocols and technical methods, and then screen out good varieties that can promote local production development[8-9]. Considering the characters such as remarkable three dimensional climatic environment,big terrain differences, widely distributed karst topography,etc. in Guizhou Province, based on the data of the yield of 12 varieties at 8 experimental sites in the second group of Guizhou silage maize regional test in 2019, AMMI model was used to analyse the interaction effect between gene and environment, and screen out a new silage maize variety adaptable to this area, so as to provide reference for the promotion of new silage maize varieties in Guizhou Province.
2. Materials and Methods
2.1. Test varieties and experimental sites
12 silage maize varieties in the second group of Guizhou silage maize regional test in 2019 were taken as test varieties (Table 1). The experiment was conducted in 8 prefectures and cities in the Guizhou Province. There were 8 trial units, one experimental site in each unit, with an average altitude of 1 046 m.
2.2. Experimental design and cultivation measures

Table 1 Test varieties and experimental sites
Random block design was used in the experiment,with three replicates. The plot area was 20 m2with a row length of 5 m and a row spacing of 0.8 m.Each plot had 5 rows, 27 plants per row, the plant spacing was 0.19 m and the planting density was 4 500 plant/667 m2, with protective row around the plot.All tested varieties were applied with fertilization according to local production level and managed with a little higer than local level. The experiment field was insect prevention but not disease prevention.
2.3. Statistical analysis
After corn grain filling for half, three rows in the middle of plot were harvested for yield measurement according to Technical Regulations for Crop Varieties Test —Zea maysL.. DPS 7.05 software was used for AMMI model analysis[10]and Excel software were used for data analysis.
(1) AMMI model analysis:
In recent years, a more effective Additive Maineffects and Multiplicative Interaction (AMMI)model has been applied for the multi-year multi-site regional experimental data analysis. Compared with variance analysis and linear regression model, AMMI model has wider application and better effect. It is an organic combination of variance analysis and principal component analysis. The formula was as follows:

Where,ygeis the yield of genotypegin environmente;μis total average value;αgis the mean deviation of genotype (The average of each genotype minus total average);βeis the mean deviation of environment (The average of each environment minus the total average);λnis the eigenvalue of the nthprincipal component analysis;δgnis the genotypic principal component score of the nthprincipal component;γgnis the environmental principal component score of the nthprincipal component;nis the total number of principal component factor axes in model principal component analysis;θgeis residual error.
(2) Linear regression model:
(3) Variety stability analysis:
Dg(e)=SQRT(PCA12+PCA22+PCA32)
Where, PCA is the characteristic vect value.
3. Results and Analysis
3.1. The average fresh weight per mu yield of each variety in 8 experimental sites
As shown in Fig. 1, the yield of Zhuqing 1 was 3 643.1 kg. 5 varieties achieved an increase in the yield,they were Xinyu 666, Huinongqing 2, Hemuyu 905,Liangduyu 191, Wuhuayu 3, respectively, their yield were 3 976.6, 3 960.9, 3 802.3, 3 792.1 and 3 747.1 kg/667m2, respectively, increased by 9.15%, 8.72%,4.37%, 4.09% and 2.85%, respectively, compared with the CK; and 6 varieties got a decrease in the yield, they were Qianqing 1802, Youqingyu 382,Shengnongyu 12, Qianqing 9208, GD7183 and Jinduyu 999, respectively, their yields were 3 642.3,3 557.8, 3 556.1, 3 504.0, 3 334.2 and 3 199.5 kg/667m2,respectively, decreased by 0.02%, 2.34%, 2.39%, 3.82%,8.48% and 12.18% kg, respectively, compared with the CK. In terms of yield, the same variety had different performances in different sites, some increased in the yield and others decreased in the yield, compared with the CK. This was caused by the interaction effect between gene and environment.
3.2. Linear regression analysis
Linear regression analysis results (Ta ble 2)showed that the sum of squares of different varieties(genes) accounted for 10.51% of the total sum of squares, reaching a very significant level; the sum of squares of different sites (environments) accounted for 63.22% of the total sum of squares, reaching an extremely significant level; the sum of squares of interaction effect (gene×environment) accounted for 26.28% of the total sum of squares, which did not reach a significant level. From the above results, it can be seen that the variation of sites (environment)was dominant, and the variation of interaction effect was greater than that of variety (gene). Therefore,regression analysis could not give a detailed explanation for the interaction effect between variety and site, it should be further analyzed.
3.3. AMMI model analysis
In order to further explore the interaction effect between variety and site, AMMI model analysis was conducted in this study. As shown in Table 3,IPCA1 and IPCA2 two principal component axes reached an extremely significant level, accounting for 50.7% and 31.2% of interaction effect variation,respectively. IPCA3 (the 3rdprincipal component axis) did not reach a significant level, accounting for 7.25% of interaction effect variation. It indicated that the principal component analysis could thoroughly analyze the interaction effect between variety and site.
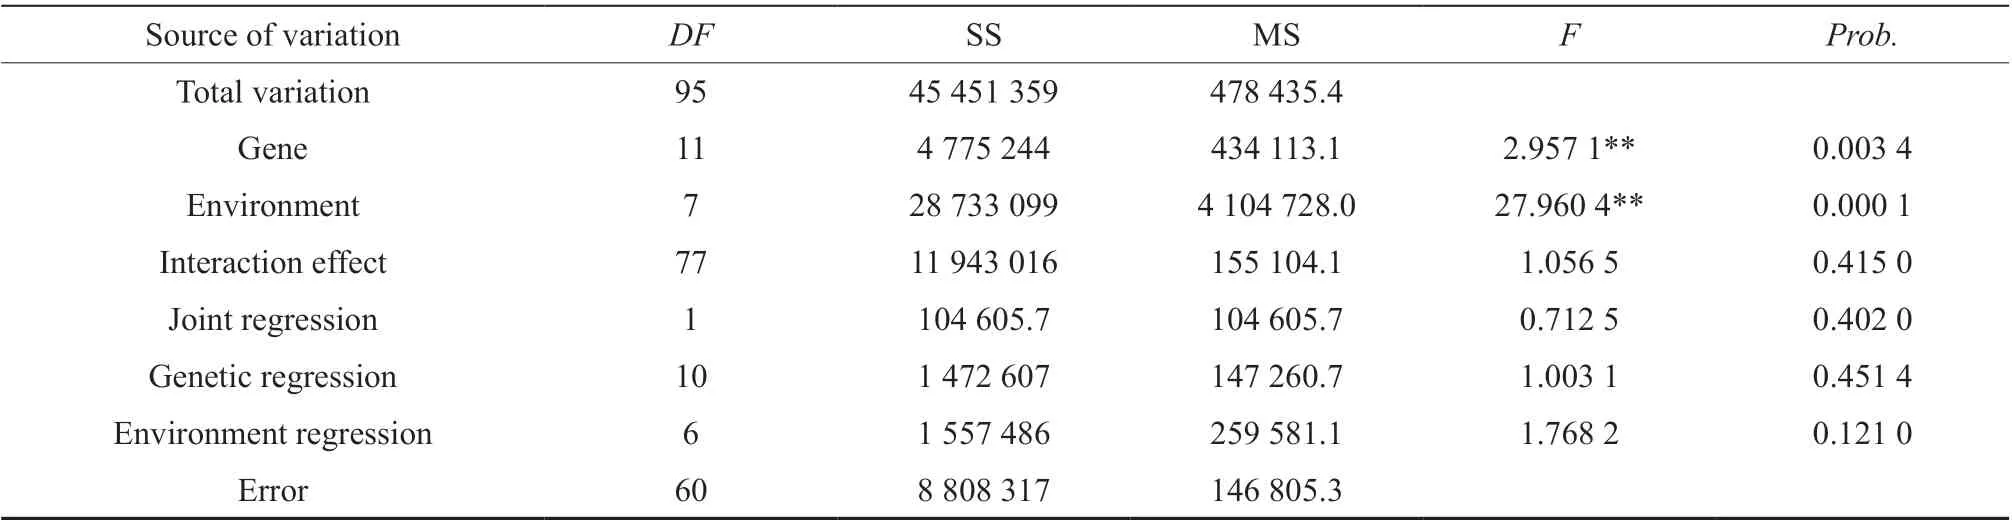
Table 2 Linear regression analysis of average fresh weight yield per mu
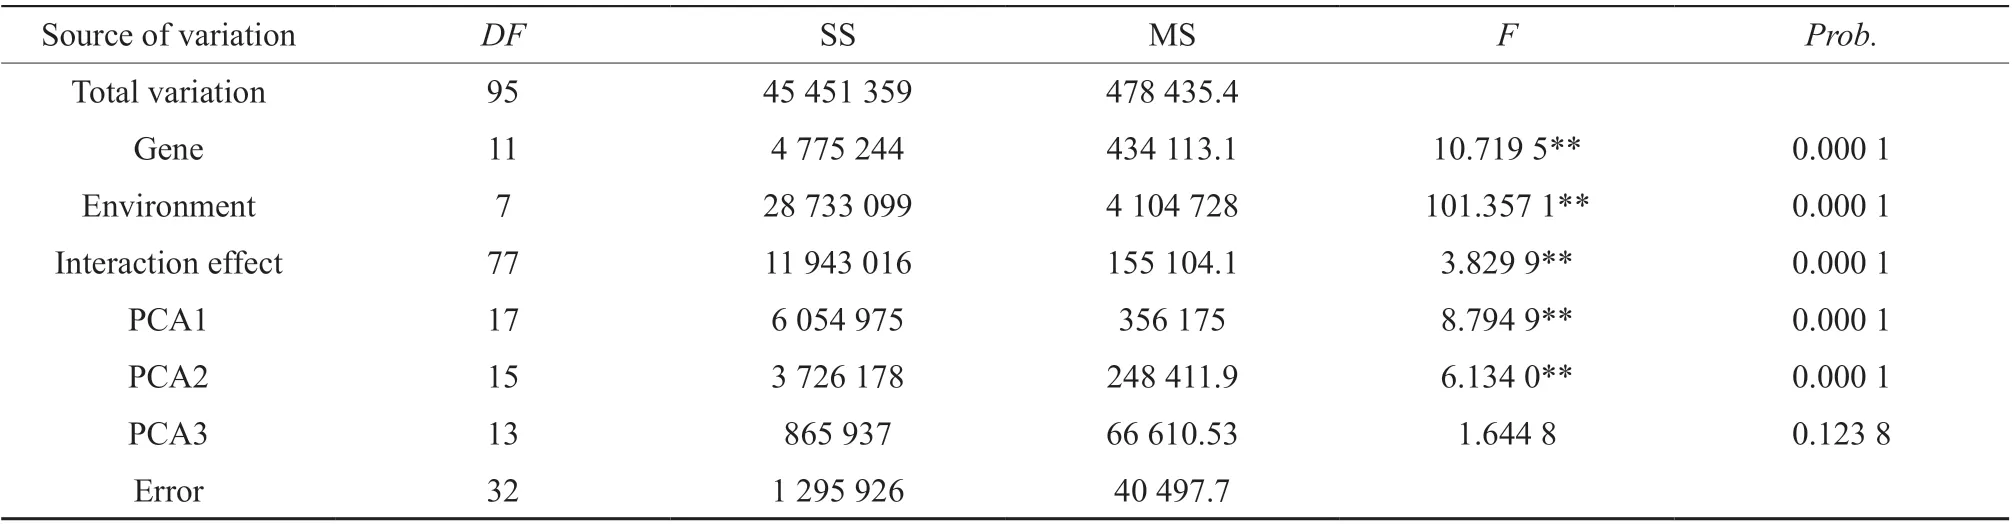
Table 3 AMMI model analysis
3.4. Variety adaptability analysis
AMMI1 biplot was a model figure made by taking average fresh weight yield per mu as X-axis and IPCA1 value as Y-axis. As can be seen from Fig. 2,in the horizontal direction reflecting yield, the distribution of the sites were more dispersive than that of the varieties, indicating that the site variation was greater than the variety variation, that was, the yield of the same variety in different sites had great difference,while the yield of different varieties in the same site had relatively small difference. This is consistent with the previous analysis results of AMMI model. In addition, variety and site on the same side of IPCA1 showed positive interaction effect, on the contrary, it showed negative interaction effect, namely, g_4, g_8,g_9, g_10, g_11 and g_12 had better adaptability to e_1,e_2, e_6 and e_7, while g_1, g_2, g_3, g_5, g_6 and g_7 had better adaptability to e_3, e_4, e_5 and e_8.
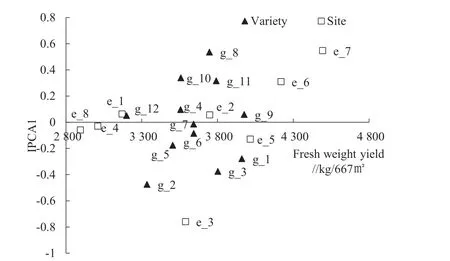
Fig. 2 AMMI1 biplot for variety and site distribution
3.5. Analysis of the stability of silage maize variety
AMMI2 biplot was a model figure made by taking IPCA1 value (variety) as X-axis and IPCA2 (site)value as Y-axis (Fig. 3). In the AMMI2 interaction effect biplot, the closer the distance to the origin, the better the stability of the variety, on the contrary, the worse its stability. Therefore, g_4 and g_7 had good stability, followed by g_1, g_2 , g_3, g_5, g_6, g_10 and g_11; g_8 and g_12 had poor stability.
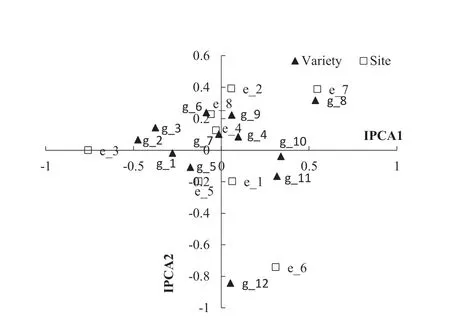
Fig. 3 AMMI2 biplot for variety and site
Combined with the variation of IPCA3 axis, the stability of variety should be further quantitatively evaluated. As shown in Table 4, theDgvalue was in the order: g_12>g_8>g_10>g_2>g_3>g_11>g_5>g_1>g_6>g_9>g_4>g_7, in other words, the stability of variety was in the order: g_7 (Qianqing 1802) >g_4(Shengnongyu 12) >g_9 (Xinyu 666) >g_6 (Zhuqing 1(CK) ) >g_1 (Huinongqing 2) >g_5 (Qianqing 9208) >g_11 (Liangdu 191) >g_3 (Hemuyu 905) >g_2(GD7183) >g_10 (Youqingyu 382) >g_8 (Wuhuayu 3) >g_12 (Jinduyu 999) . In consideration of yield,g_1 (Huinongqing 2) and g_9 (Xinyu 666) were silage maize varieties with high and stable yield; g_3(Hemuyu 905), g_8 (Wuhuayu 3) and g_11 (Liangdu 191) had general stability, and their yield was higherthan that of the control; g_12 (Jinduyu 999) had the worst stability and low yield.
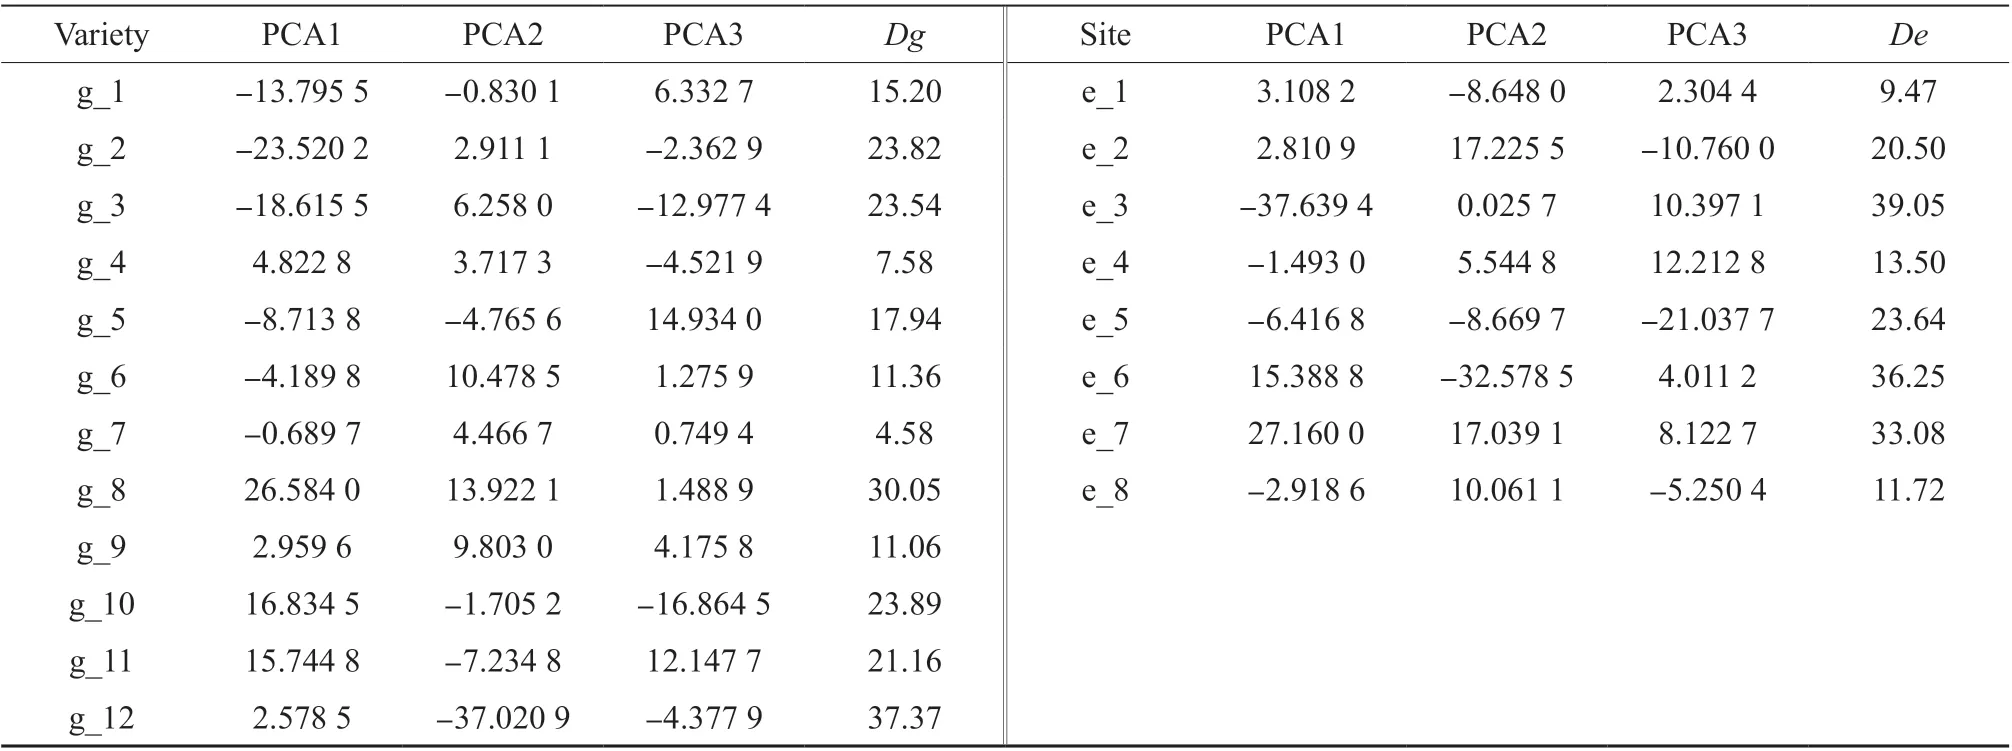
Table 4 Parameters for the stability of silage maize variety and the discriminating ability of site
3.6. Analysis on the discriminating ability of site
The farther the distance to the origin, the higher the discriminating ability of the site, on the contrary,the lower its discriminating ability. As shown in Fig. 3,e_3, e_6 and e_7 had high discriminating ability,followed by e_1, e_2, e_5 and e_8, e_4 had the lowest discriminating ability. Combined with the variation of IPCA3 axis, the discriminating ability of site should be further quantitatively evaluated. It can be seen from Table 4, theDevalue was in the order: e_3>e_6>e_7>e_5>e_2>e_4>e_8>e_1, indicating that e_3 (Guizhou Zhuohao Agricultural Science and Technology Co.,LTD) had a high discriminating ability to variety, e_1(Guizhou Institute of Upland Crops), e_4 (Guizhou Institute of Prataculture ) and e_8 (Guizhou New Zhongyi Seed Industry Co., LTD) showed a low discriminating ability to variety.
4. Discussion
Linear regression analysis showed that variety variation accounted for 10.51% of the total variation;experimental site variation accounted for 63.22%of the total variation; interaction effect variation between gene and environment accounted for 26.28%of the total variation. It indicated that environmental variation played a major role in total yield variation of silage maize, followed by gene-environment interaction variation and genotype variation. At present,AMMI model has been used to analyze the yield data of maize regional test by many researchers[8-9],which has confirmed that AMMI model could thoroughly analyze the regional test. However, there are few reports on the analysis of the interaction effects between silage maize variety and the site. In this study, we analyzed the variation degree of silage maize variety, experiment and their interaction was analyzed by AMMI model biplot, and the stability and adaptability of each variety were obtained. The results showed that g_4, g_8, g_9, g_10, g_11 and g_12 gave better adaptability to e_1, e_2, e_6 and e_7; while g_1,g_2, g_3, g_5, g_6 and g_7 gave better adaptability to e_3, e_4, e_5 and e_8. In consideration of yield,g_1 (Huinongqing 2) and g_9 (Xinyu 666) were silage maize varieties with high and stable yield; g_3(Hemuyu 905), g_8 (Wuhuayu 3) and g_11 (Liangdu 191) showed general stability, and their yield was higher than that of the control; g_12 (Jinduyu 999)had the worst stability and low yield. This conclusions can provide reference for the breeding and promotion of new silage maize varieties in Guizhou Province.
杂志排行

Agricultural Science & Technology的其它文章
- Effects of Different Bagging Treatments on Fruit Quality of Jinlan Pomelo
- Effects of Different Intercropping Patterns on Population Yield and Benefit of Fresh Maize and Mung Bean
- Mechanism of Solid State Fermentation in Reducing Free Gossypol in Cottonseed Meal and the Effects on the Growth of Broiler Chickens
- Control Effects of Mixture of Metamifop and Cyhalofopbutyl on Annual Weeds Barnyard Grass in Directseeding Paddy Field
- Study on Weed Control and Safety of Tembotrione-Atrazine Tank Mixture in Spring Maize Fields
- TIB for Micropropagation and the Relationship between Anthocyanins and Chlorophyll of Strawberry Seedlings