Crustal deformation measurements by global positioning system(GPS) along NSL, western India
2022-05-18RkeshDumkSuriBuKotliGirishChKothyriSndipPrjpti
Rkesh K.Dumk ,D.SuriBu ,B.S.Kotli ,Girish Ch.Kothyri ,Sndip Prjpti
a Institute of Seismological Research, Raisan, Gandhinagar, Gujarat, 382009, India
b Center of Advanced Study in Geology, Kumaun University, Nainital, 263002, India
c Adikavi Nannaya University, Rajahmundary, A.P., India
ABSTRACT The Narmada Son Lineament(NSL)is a major palaeo-rift system and seismically active intra-plate region.In this paper, we processed and analyzed the GPS data from 2009 to 2016 to study the geodynamic characteristics of NSL.The velocities derived from GPS were used to calculate the associated deformation and crustal strain, while the slip deficit was estimated using the horizontal motion of GPS sites. The investigation reveals that the maximum deformation of western NSL is 1.6 mm per year, and the upper bound of the seismic moment (M0) is 2.0 × 1024 dyn/cm, corresponding to an earthquake of about 6.0 magnitude. The study highlights the significance of Aravalli and Satpura mobile belts. The estimated strain of 0.03 μstrain/yr is low but comparable to the stable continental region,and a close association of factors (the fragility, crustal conductors, and compressive tectonics) is considered responsible for seismogenic activities in western NSL.© 2022 Editorial office of Geodesy and Geodynamics. Publishing services by Elsevier B.V. on behalf of KeAi Communications Co. Ltd. This is an open access article under the CC BY-NC-ND license (http://creativecommons.org/licenses/by-nc-nd/4.0/).
Keywords:GPS Intra-plate deformation Strain accumulation Seismic moment Seismic activity
1. Introduction
During the Late Triassic to Early Jurassic, the Indian continent was restructured through the northward rifting, and three rift systems (Kachchh, Cambay, and Narmada) were formed after the separation of eastern and western Gondwanaland [1]. The late Cretaceous Indo-Eurasian plate collision halted rifting[2].After the collision, the Kachchh and Narmada rifts became compression zones and got strained, followed by the reactivation of primordial faults and the generation of earthquakes in this part of the Indian plate[3-15].The ENE-WSW trending Narmada rift,termed as NSL(Narmada Son Lineament), was evolved during the Archean and Proterozoic periods. It comprises Son, Narmada, and Tapti fault systems, e.g., Narmada North Fault (NNF), Narmada South Fault(NSF),Son-Narmada Fault(SNF),Tapti North Fault(TNF),and Tapti South Fault(TSF)[16-19].In the western part of NSL,there are two major faults (SNF and TNF) along with a transverse Barwani Sukta Fault(BSF) (Fig.1).
The tectonic activity has been observed by various geological investigations, and two phases during the Holocene have been identified along the NSL[19,20].Late Quaternary tectonic events are mainly responsible for the development of the current landscape[21-23]. Landsat image analysis, combined with field observations and geomorphic features, inferred the neotectonic activity and reactivation of pre-existing lineaments along the NSL [19,24,25],with persistent seismic and thermal activity indicating tectonic instability[26-28].In the last century,six moderate seismic events have occurred in the study area(Fig.2),including 1972 M6.5 Rewa,1938 M6.3 Khandwa,1957 M5.7 Navagam,1970 M5.4 Bharuch,and 1997 M6.1 Jabalpur earthquakes[19,29-40].The focal mechanisms of the 1997 M6.1 Jabalpur and 1970 M5.4 Bharuch earthquakes indicate the thrust-type motion [41]. The Jabalpur earthquake occurred in the deeper part of the crust [35,36], whereas the Bharuch earthquake occurred at a depth of 11 km [42]. Thus the geneses of earthquakes in the east and west are different (Fig. 2).Recent magnetotelluric studies showed several crustal conductors at different depths [43] and conductive zones at a depth of about 10 km near the faults [44]. Large-scale tectonothermal activity has also been recorded in the region[19,45],and the high heat flow zone coincides with the tectonic features in the Indian shield region[27].The seismic reflection study revealed the existence of vertical NSF in the subsurface and its inversion near the surface[46].

Fig.1. The study area(blue rectangle)on the western margin of India.During the northward migration of the Indian plate,Narmada,Cambay,and Kachchh rifts were formed on the western margin [2,3].
GPS-derived studies suggested that the maximum deformation of the Indian plate is associated with the collision zone in the Himalayas, while its internal deformation is less than 2 mm/yr[47-59]. Geodetic studies indicated that about 2-3 mm/yr of convergence was associated with the NSL [60,61], which divided the Indian plate into northern and southern blocks[62].It is worth noting that all these observations are based on the GPS sites distributed all over the Indian plate.
Considering the small amount of internal deformation in the Indian plate[53],it is vital to quantify the deformation based on the continuous mode of GPS stations in the NSL.With this objective,the Institute of Seismological Research (ISR) in western India has established a GPS network composed of 24 stations[5-8],of which four GNSS stations are located along the NSL. Therefore, we try to use GPS data (2009-2016) to study the deformation and strain pattern of the NSL. This study is the first geodetic study along the NSL, focusing on the western part, where the 1970 M5.4 Bharuch earthquake occurred.This part consists of two major fault systems:the Son Narmada fault(SNF)and the Tapti North fault(TNF)with a transverse Barwani-Sukta fault(BSF).The displacements from GPS sites were analyzed to study the geodynamic characteristics of the faults, and the information obtained was used to estimate the seismic potentiality in the study area.
2. GPS data and analysis

Fig. 2. (a) Locations of six moderate earthquakes along NSL in the last century,including 1972 M6.5 Rewa, 1938 M6.3 Khandwa, 1957 M5.7 Navagam, 1970 M5.4 Bharuch, and 1997 M6.1 Jabalpur earthquakes [62]. The focal mechanisms of two earthquakes (1970 Bharuch and 1997 Jabalpur) indicate the thrust type motion[30,41.42]. (b) Depth distribution of earthquakes on the western segment of NSL,modified after Gahalaut et al. [37]. Most of the earthquakes occurred in the depth of 5-18 km. Jabalpur earthquake occurred in the deeper part of the crust, and the Bharuch earthquake occurred at the depth of 11 km.
To achieve the results with millimeter accuracy, we deployed GAMIT/GLOBK 10.7 software for data processing. It consists of two steps, namely pre-processing and post-processing of raw data generated in the field. In the first step, the pre-processing was carried out to convert the raw data of different receivers into a common format called Receiver Independent Exchange(RINEX).In the second step, the converted RINEX dataset was used as an input to get solutions(H-files)of estimated parameters for GAMIT-GLOBK software[63,64]. Further, the International GNSS Service (IGS) site data with required navigation and orbital files were taken from the Scripps Orbit and Permanent Array Centre (SOPAC). A list of IGS sites for processing is presented in Table 1. The International Terrestrial Reference Frame (ITRF) [65] and models were applied during the steps of data processing, such as Global Mapping Function (GMF),Global Pressure Temperature model(GPT2),Finite Element Solution(FES2004 for ocean tide corrections), and International Earth Rotation and Reference Systems Service(IERS)2003[66-68].The GAMIT adopted a linear model of tropospheric signal delay[69].The random walk noise was applied in time-series generation to minimize the instability due to the geodetic monument [70] (Fig. 3). To precisely comprehend the deformation pattern of sites, the Indian Reference Frame [50] with Euler pole (W= 0.335613 ± 0.0030 deg/Myr,W=0.070437±0.0114 deg/Myr,and W=0.434185±0.0036 deg/Myr)was applied[50].
3. Results and discussion
3.1. Deformation analysis
After analyzing the longer GPS time-series, the results provide a considerable resolution and reveal an average velocity of 50±1 mm/yr in the northeast direction with respect to(wrt)ITRF14(Table 2). The motion wrt the Indian plate suggests a maximum deformation of about 1.6±0.1 mm/yr at SAGB(Fig.4,Table 1),which is significant in the intra-plate part[71].The minimum deformation of 0.47±0.1 mm/yr is recorded at KEVA.The ARAJ and BARW sites show the deformation of about 1.0 ± 0.1 mm/yr, which is lower compared to the southwestern part of the study area.The SAGB site indicates the movement in the NEE direction,which may be caused by the effect of loading/unloading in the nearby reservoir[6].Except for SAGB,almost all the other three sites show the movement in SE direction. Thus the deformation pattern in the eastern part differs from that in the western part.
We deduce that the difference in the rate/trend of motion is due to the dynamic nature of the faults. The maximum deformation towards the southern part of the NSL may be responsible for the enhanced seismic activity in this particular area(Fig.4).Compared with the north,the seismic activity is concentrated in the south of Narmada [36]. Soft sediment deformation studies in the Dadra-Nagar Haveli area also revealed the occurrence of an earthquake of M5.5 or greater in the past [39,40]. Similarly, a large amount of strain was found to be associated with the Panvel Flexure zone in the Western Ghat [50].

Table 1 List of International GNSS Service (IGS) sites with their positions.
The baseline variation was calculated to study the deformational pattern.The baseline shortening of 1.5 mm/yr and 1.1 mm/yr reveals the compression between KEVA-SAGB and SAGB-BARW, respectively. However, the slight expansion (0.38 mm/yr) of the baseline between KEVA and BARW indicates the strike-slip motion along the SNF(Fig.5).Based on the baseline correlation,we conclude that the western part of the NSL is predominantly in compression with a component of strike-slip fault activity.
3.2. Slip assessment
To understand the seismic behavior of western NSL, an estimation of the fault slip was carried out. Therefore, the inverse modeling of horizontal GPS displacement was performed using Coulomb 3.3 [72]. Based on the isotropic elastic property, the insitu static displacement caused by sliding along the fault can be calculated [73-76]. In the western Narmada rift, we considered three fault systems:SNF,TNF,and the transverse BSF.The locations of KEVA and SAGB provide the opportunity to model the SNF and TNF(Fig.1).The depth distribution of earthquakes between 1967 to 1999 by the International Seismological Centre(ISC)[36,37]and the seismic monitoring by the ISR [77] reveal that the maximum number of earthquakes occurred in the depth range of 5-15 km in western NSL. The selection of the depth was chosen based on the seismicity of the area (Fig. 3). The M4.6 earthquake near Valsad in the south of the study area was triggered at a depth of 7 km[78,79].For the NSF, we considered the strike and dip as given by [19,42].For the TNF,the strike and dip were fixed based on the tectonic map[80]and deep seismic sounding(DSS)profile[16].Considering the regression line based on the 1970 M5.4 Baruch earthquake[81],the width of the fault was kept as a maximum of 5 km. We evaluated the north-dipping plane of SNF and south-dipping plane of TNF as the most appropriate.
The slip assessment determines that the SNF and TNF were reversed with a strike-slip component,which is larger on the TNF,and the BSF also shows reversed motion with strike-slip(Fig.5).An annual slip deficit is about 3.0 mm and 1.8 mm for the TNF and SNF,respectively.The BSF indicates a slip deficit of about 1.6 mm/year at the specified depth. The calculation reveals seismic moments of 1.4×10dyn/cm,2.0×10dyn/cm,and 1.1×10dyn/cm for the SNF, TNF, and BSF, respectively, corresponding to approximately M6.0. The value is relatively accurate for the region as a similar seismic moment was observed along the Island Belt Fault (IBF) in western India [5].
3.3. Strain analysis
The strain was calculated using the program SSPX [82]. Fig. 5 reveals a slight variation in the trend of strain tensors and indicates an almost N-S directed compression in the study area(Fig.5).Several global geodetic studies indicate that the strain rate in the range of 0.01 μstrain/yr is common for stable regions[83-85].The maximum strain rate in the study area is 0.03 μstrain/yr, which is slightly higher than that in stable continental regions.For the Indian plate,low strain rates less than 0.1 μstrain/yr in the NSL[61]and 0.07-0.05 μstrain/yr in the Kachchh[5,7,8,86,87]were observed while the significant strain rate of 0.3 μstrain/yr was measured along the Godavari rift [53].
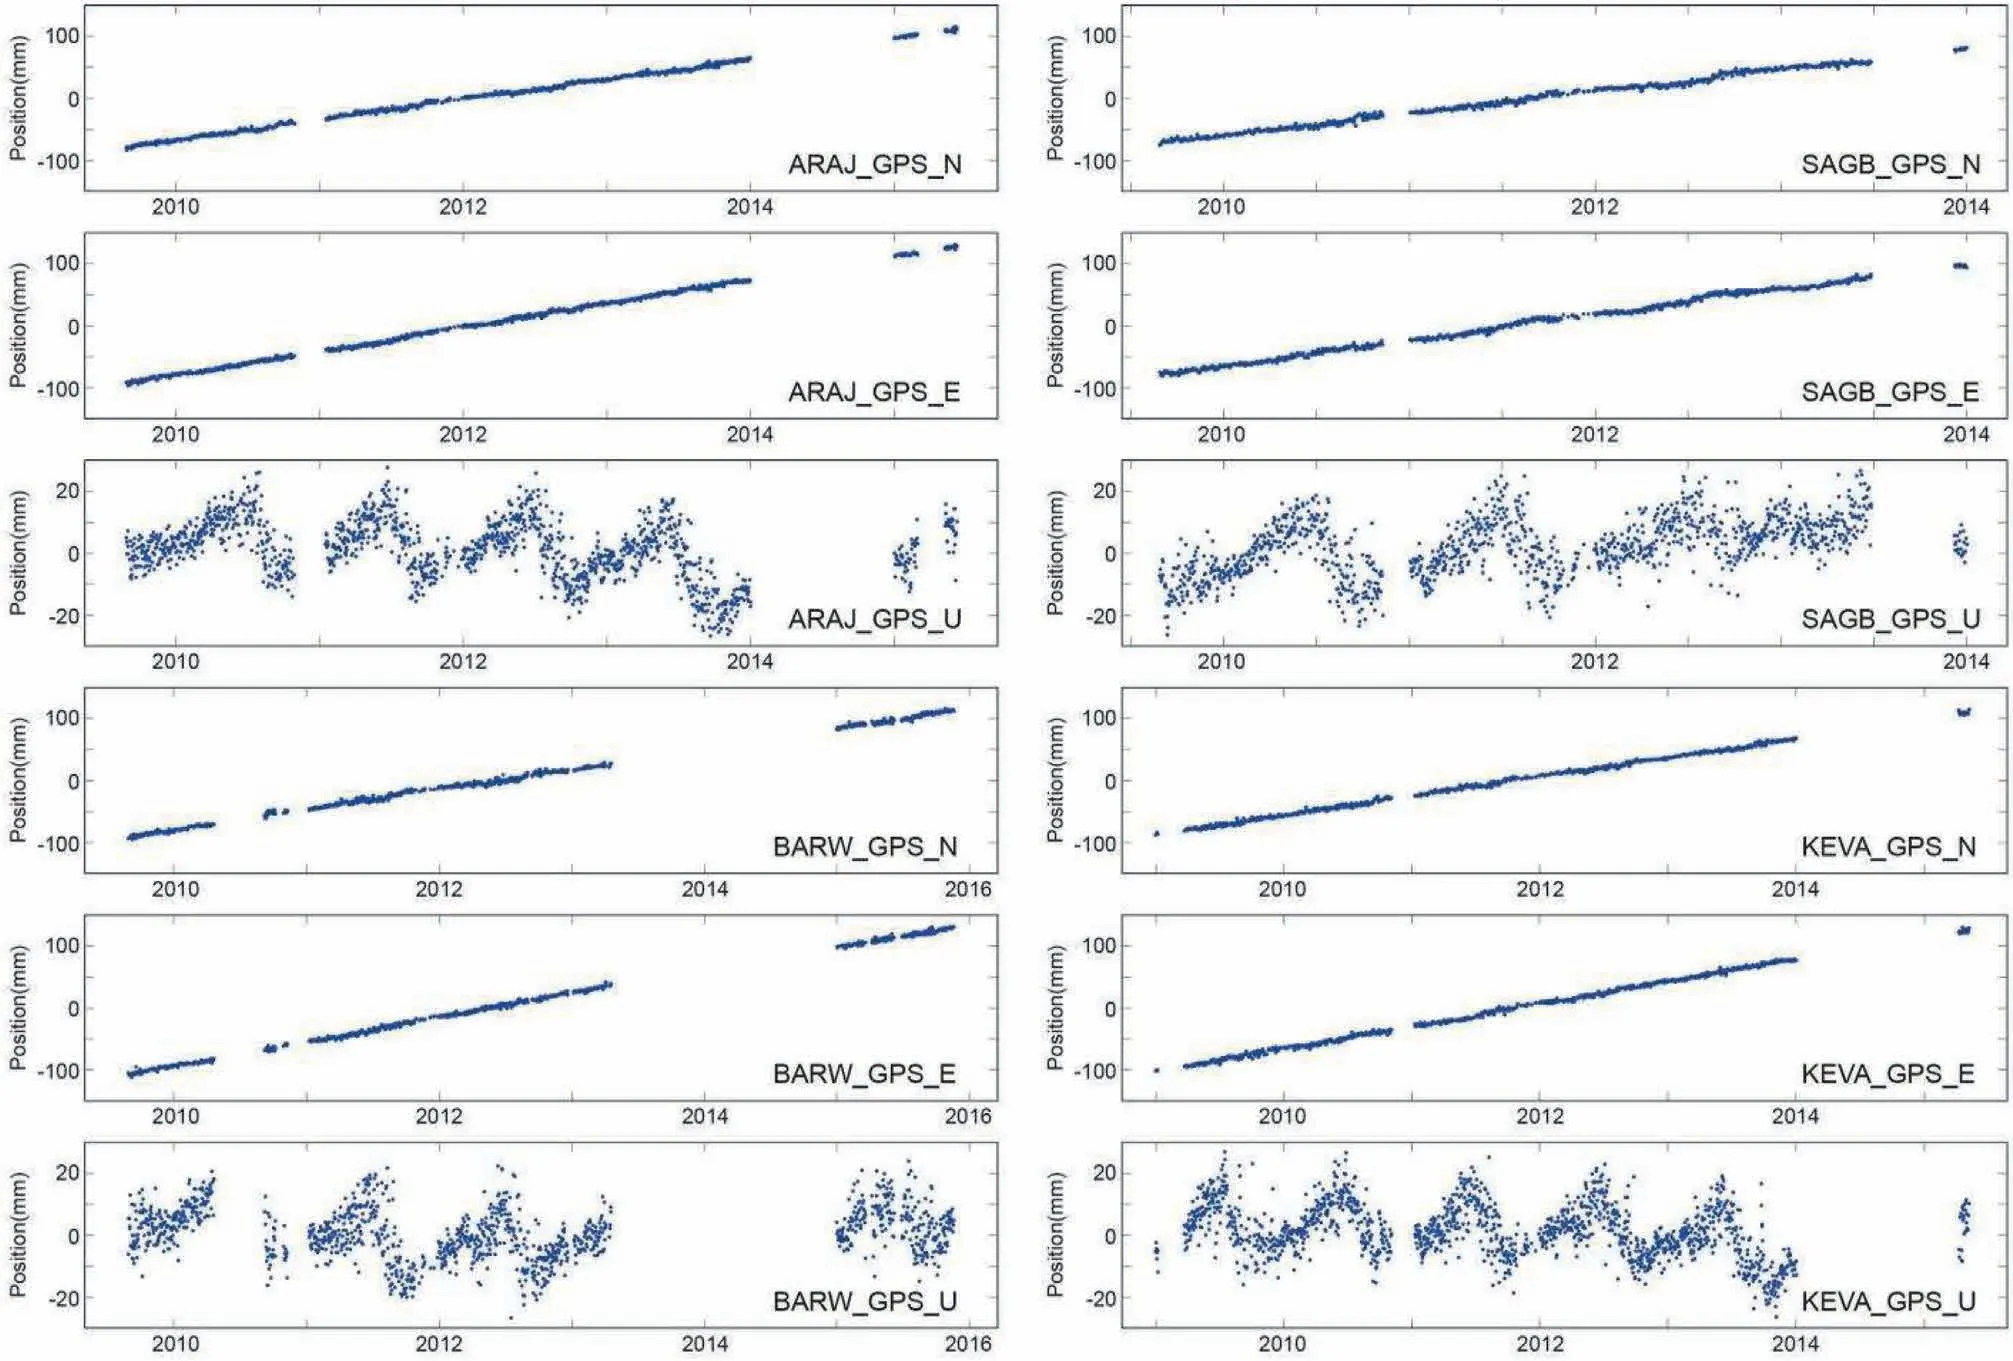
Fig. 3. Time-series measurements of GPS sites along NSL from 2009 to 2016.
Based on GPS observations, the maximum deformation of 1.5 mm/yr was observed due to the compression between the SNF and TNF. A significant amount of motion at the SAGB may suggest the dynamic nature of the TNF.The active nature of Tapti Fault is reflected in the displacement of the alluvial fan, indicating the occurrence of one or more large earthquakes [78]. The calculated deformation and strain in the study area are due to the accumulation of slip deficits in the vicinity. The Narmada rift originates from extensional tectonics with E-W oriented structural features. It is currently in N-S compression and prone to reverse faulting. However, the existing high dip faults (almost higher than 60) are not conducive to reverse faulting [88-91].Therefore, a certain amount of slip may occur along the strike,providing oblique motion for the faults. In the study area,deformation along the NSL is mainly associated with the compressive tectonics of the Indian plate. Additionally, the motion towards the north NSF is southeastward, which is similar to the trend of the Aravalli. However, the motion towards the south TNF is almost northeastward, which is similar to the trend of Satpura (Fig. 5). We believe that under the influence of regional compressive stress, the trends of Aravalli and Satpura play an essential role in the seismotectonics of the NSL. It is worth mentioning that our supposition is based on the analysis of limited regional data. Therefore, a detailed study of these mobile belts with additional GPS stations is recommended.
Furthermore, the proximity of crustal conductors to existing faults might be responsible for the accretive deformation and the occurrence of upper crustal earthquakes in the study area. The slip assessment of faults further indicates that more strain is accumulating in this zone, resulting in moderate earthquakes.The area is assumed to be fragile. Therefore, the accumulated strain can not be sustained for a longer period, resulting in moderate seismicity in the area. The oblique motion along the faults is responsible for strain accumulation towards the eastern terminus.

Table 2 GPS-derived velocities along NSL based on datasets(2009-2016)with respect to ITRF14 and Indian plate.For the calculation of velocities wrt Indian plate,the pole of Jade et al.[50] has been used.

Fig.4. GPS-derived velocities along NSL based on datasets from 2009 to 2016 with respect to ITRF(black arrows)and Indian plate(blue arrows).The red star indicates the location of the 1970 M5.4 earthquake. The earthquake location source is from ISC (http://www.isc.ac.uk).

Fig. 5. GPS-derived results reveal SE and NE directed motion towards north NSF and south TNF, respectively. As shown in the red (compression) and blue (extension) bars, the maximum strain in the study area is 0.03 μstrain/yr. The baseline shortening is observed between KEVA-SAGB (1.5 mm/yr) and SAGB-BARW (1.1 mm/yr). A small baseline expansion (0.38 mm/yr) is observed between KEVA-BARW.
4. Conclusions
The following conclusions can be drawn after analyzing continuous GPS datasets of western NSL from 2009 to 2016.It reveals that the deformation is 1.6 mm/yr and the strain is 0.03 μstrain/yr in western NSL. The computation indicates the seismic moment of 1.4×10dyn/cm,2.0×10dyn/cm,and 1.1×10dyn/cm along the SNF, TNF, and BSF, respectively. A maximum slip deficit of 3.0 mm/yr is quantified, and it is possible to generate a M6.0 earthquake along the Narmada Son Lineament. Compressive tectonics, crustal conductors, and fragility are the main factors that accelerate seismogenic activities in the study area.
Conflicts of interest
The authors declare that there is no conflicts of interest.
Acknowledgments
The authors are thankful to DG,ISR,DST(GoG),and MoES(GoI)for the required support.The software(GAMIT-GLOBK)used in the processing is available at http://www-gpsg.mit.edu [63,64].Earthquake locations were taken from the monitoring program of ISC (www.isc.ac.uk) and [37,38,77,80]. Coulomb 3.0, IGS, brdc and sp3 data were downloaded from the USGS(http://earthquake.usgs.gov),SOPAC(http://sopac.ucsd.edu)and NOAA(ftp://geodesy.noaa.gov/cors), respectively.
杂志排行

Geodesy and Geodynamics的其它文章
- Quaternary tectonic history of seismically active intraplate Kachchh Rift Basin, western India: A review
- Response of drainage to tectonics and PS-InSAR derived deformation study in Bilaspur, northwestern Himalaya, India
- Relative active tectonics evaluation using geomorphic and drainage indices, in Dadra and Nagar Haveli, western India
- Manifestation of earthquake preparation zone in the ionosphere before 2021 Sonitpur, Assam earthquake revealed by GPS-TEC data
- Integrated water vapor during active and break spells of monsoon and its relationship with temperature, precipitation and precipitation efficiency over a tropical site
- Geodetic characterization of active Katrol Hill Fault (KHF) of Central Mainland Kachchh, western India