Integrated water vapor during active and break spells of monsoon and its relationship with temperature, precipitation and precipitation efficiency over a tropical site
2022-05-18NirmlBiJdlMiriylSridhrGopDuttMohmmedYousufReddy
Nirml Bi Jdl , Miriyl Sridhr , Gop Dutt , Mohmmed Yousuf ,,Y.K. Reddy
a Department of ECE, Koneru Lakshmaiah Education Foundation, Vaddeswaram, Guntur Dt, 522502, A.P, India
b Vignana Bharathi Institute of Technology, Ghatkesar, Medchal Dt, Telangana, 501301, India
c India Meteorological Department, Hyderabad, Telangana, 500016, India
ABSTRACT Global Positioning System(GPS)measurements of integrated water vapor(IWV)for two years(2014 and 2015) are presented in this paper. Variation of IWV during active and break spells of Indian summer monsoon has been studied for a tropical station Hyderabad(17.4° N,78.46° E).The data is validated with ECMWF Re-Analysis (ERA) 91 level data. Relationships of IWV with other atmospheric variables like surface temperature, rain, and precipitation efficiency have been established through cross-correlation studies. A positive correlation coefficient is observed between IWV and surface temperature over two years.But the coefficient becomes negative when only summer monsoon months(June,July,August,and September)are considered.Rainfall during these months cools down the surface and could be the reason for this change in the correlation coefficient. Correlation studies between IWV- precipitation, IWVprecipitation efficiency(P.E),and precipitation-P.E show that coefficients are-0.05,-0.10 and 0.983 with 95% confidence level respectively, which proves that the efficacy of rain does not depend only on the level of water vapor.A proper dynamic mechanism is necessary to convert water vapor into the rain.The diurnal variations of IWV during active and break spells have been analyzed. The amplitudes of diurnal oscillation and its harmonics of individual spell do not show clear trends but the mean amplitudes of the break spells are approximately double than those of the active spells. The amplitudes of diurnal, semidiurnal and ter-diurnal components during break spells are 1.08 kg/m2, 0.52 kg/m2 and 0.34 kg/m2 respectively. The corresponding amplitudes during active spells are 0.68 kg/m2, 0.41 kg/m2 and 0.23 kg/m2.© 2021 Editorial office of Geodesy and Geodynamics. Publishing services by Elsevier B.V. on behalf of KeAi Communications Co. Ltd. This is an open access article under the CC BY-NC-ND license (http://creativecommons.org/licenses/by-nc-nd/4.0/).
Keywords:Precipitation efficiency Diurnal oscillation Integrated water vapor Tropical site Break spells of monsoon Active spells of monsoon
1. Introduction
Water vapor in the atmosphere plays an important role in various atmospheric processes. The greenhouse effect due to the presence of this atmospheric constituent in the lower atmosphere sustains life on Earth and its hydroxyl radical helps remove atmospheric pollutants.Water vapor is observed to be highly variable in space and time, and its distribution is closely related to cloud formation and precipitation. It plays a dominant role in various atmospheric processes and contributes to climate change. Water vapor is generally measured by water vapor radiometer(WVR)and balloon-borne radiosondes. Bevis et al. [1] devised a novel approach to measure this important atmospheric parameter by remote sensing using Global Positioning System (GPS). The microwave signal transmitted from the satellite gets delayed to reach the receiver in the earth station due to the presence of water vapor in the lower atmosphere.This delay can be parameterized to obtain zenith total delay(ZTD)which is nearly proportional to precipitable water vapor(PWV)/integrated water vapor(IWV).The method has become very popular since when a good network of GPS receivers exists all over the world [2-6].
Water vapor is closely related to temperature in the troposphere. An increasing trend in PWV and surface temperature for several coastal stations have been reported by Kothwale et al. [7].But certain geographical locations do not follow this trend [8,9].The low latitude regions receive strong solar radiation and their surface temperatures vary between 20C to 35C,excluding desert regions.These regions can hold more water vapor which ultimately culminates into the rain.Thus,it is expected that more precipitation will take place in warmer climates. But a combination of three factors decides the quantity of precipitation received by any location[10-12].These are available water vapor,degree of saturation,and a conducive dynamic mechanism to provide required cooling to increase the saturation level necessary for precipitation. This is the reason for the poor correlation observed between atmospheric water vapor and precipitation [13,14]. Precipitation efficiency (P.E)is a variable that measures the efficiency of dynamic mechanisms to convert atmospheric water vapor into the rain. It is defined as the ratio of total precipitation during some period to the total PWV during the same period and is generally expressed in percentage[10,11,14,15]. Precipitation/P.E is highly variable in space and time and is worth getting investigated even for close-by locations. The average value of annual P.E is considered to be 12%over the entire world [16]. Franseschini [17] reported it was 11% for the United States.Ye et al.[11]has worked for high latitude stations.As for the northern low latitude Indian region, this work has not been reported so far as this study is very important at a global scale.Recently Meunram and Satirapod [18] reported that the distance between GPS stations for PWV measurements should be within~74.5 km to avoid spatial variation.Variation of atmospheric water vapor over different time scales has been reported by various workers [3,6,19,20]. Continuous monitoring of low latitude water vapor is thus very essential for improving our knowledge about tropical atmospheric processes and short-term weather forecasting[21]. This paper attempts to study the variation of PWV during active and break spells of the Indian summer monsoon (ISM) and its relationship with various atmospheric variables. Precipitation mainly depends on precipitation efficiency. This is the novelty of this paper.
The paper is structured as follows:section 2 describes data and the method.Validation of the GPS IWV with ERA 91 level data has been carried out in section 3. Section 4.1 details the criteria to identify active and break spells of monsoon. The relationships of IWV with different atmospheric variables and P.E are analyzed in section 4.2. The diurnal variation of IWV has been discussed in section 4.3. Section 5 describes the summary of the study.
2. Data and method
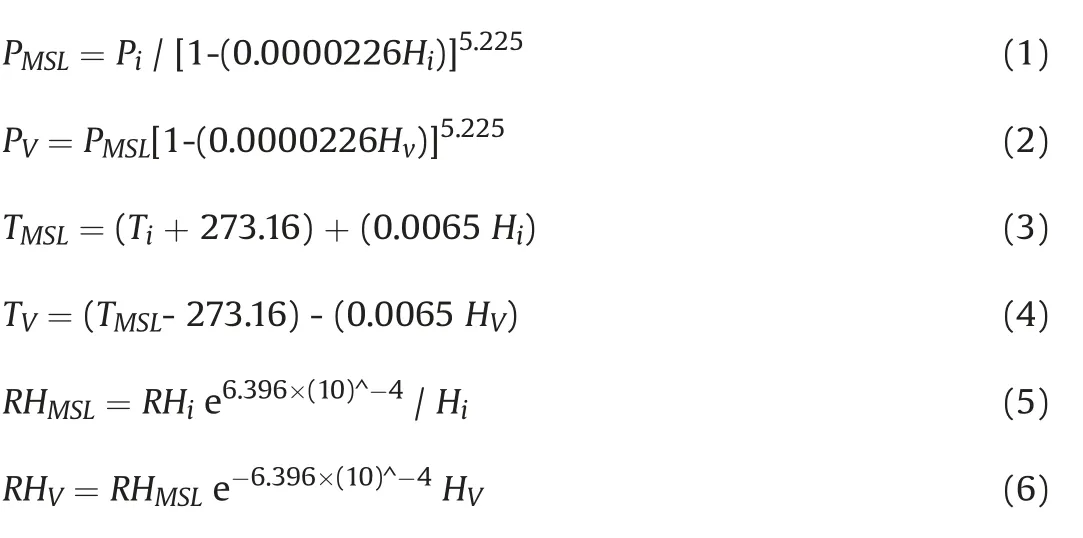
Microwave signals sent from GPS satellites are received by a dual-frequency receiver installed at Vignana Bharathi Institute of Technology (VBIT), Hyderabad. The present study uses available GPS data between December 2013 and December 2015.GPS signal gets delayed reaching the station due to the presence of water vapor in the troposphere. The delay along with meteorological variables(pressure,temperature,relative humidity)is processed by GAMIT software 10.61 version developed by Massachusetts Institute of Technology(MIT)to obtain PWV over the site:http://wwwgpsg.mit.edu/~simon/gtgk/GAMIT_Ref.pdf.The meteorological data between December 2013 and November 2014 were obtained from Mini Boundary Layer Mast (MBLM) available in the same campus.MBLM was not in operation after this period, and hence MET data between December 2014 to December 2015 was procured from Indian Meteorological Department (IMD), Hyderabad, which is~27 km away from VBIT.The MET data of IMD have been converted to MET data of VBIT following the relationships given by Musa et al.and Bai and Feng [21,22]. Let the height of the IMD station from mean sea level(MSL)be H(531 m),and that of VBIT be H(480 m).
IWV values estimated from IMD's height corrected met data and IWV values estimated with MBLM's met data for the available period December 2013 to November 2014 compares well and are within±5%deviation.These MET files are fed to GAMIT software to derive zenith delay and PWV.The details of PWV computations are described in Jadala et al.[6].The rain data used in the present study has been taken from Tropical Rainfall Measuring Mission (TRMM)3B42 version 7 with 0.25 × 0.25 grid for 17.375latitude and 78.625longitude, which is closest to the location of Hyderabad.Three hourly rainfall data (8 points per day) are averaged to get mean daily rainfall. The rainfall data during the summer monsoon months(June,July,August,and September)are further averaged for each year to get the mean yearly background rainfall. These mean data are subtracted from daily rainfall data of the corresponding year. They are used to identify the active and break spells of monsoon following Rao et al. [23] and Singh and Nakamura[24].
3. Data validation
Computation of PWV/IWV has been carried out for the period December 2013 to November 2014 by using simultaneous MET data of MBLM and for the period December 2014-December 2015,IMD's MET data are used after interpolating them using equations(1)-(6) described in section 2. The recent ECMWF Re-Analysis(ERA) 91 level data of IWV and 850 hPa winds have been downloaded for comparison and validation purposes of our data. ERAInterim data is a model data that uses Integrated Forecasting System (IFS) data. This system contains 4-dimensional variational analysis (4D-Var) algorithms to model the data. We utilized this model data for our analysis,and we found good matching for all the months except for the summer months, where it deviates quite a bit from the observation for this latitude.The Clouds and the Earth's Radiant Energy System (CERES) provides satellite-based observations of Earth Radiation Budget and Clouds, which use measurements from different instruments available on different satellites flying over the Earth.Detailed information about CERES is available at https://ceres.larc.nasa.gov/. The IWVs calculated by these different MET datasets are shown in Fig. 1a with standard deviations plotted by vertical bars on IWVs obtained with MBLM MET data. It can be seen that the four sets of IWVs compare quite well and are within the standard deviation limits. Validation of wind data for the period between December 2013 and October 2014 is depicted in Fig.1b.The wind data for the month of November,2014 was not available.Winds measured with MBLM,automatic weather station(IMD),and downloaded from ERA-91 level data for the same period show reasonable agreements, except for the summer months.

Fig.1. a) Mean IWV values of each month for different MET data sets with standard deviations on MBLM mean; b) Mean wind speeds of each month for different data sets.
4. Results and discussion
4.1. Active and break spells of monsoon
Various methodologies have been described in references to identify active and break spells of monsoon using different atmospheric variables like wind circulation pattern and temperature etc.[23-29].But rainfall is the most important parameter to define active and break spells.In spite of this criterion,there exist different definitions of dry and wet spells of monsoon. IMD follows a method to identify active and break spells developed by Rajeevan et al. [29]for operational purposes.This study has been carried out following Rao et al. [23] which has adopted similar criteria given by Rajeevan et al. [29] but with small deviations.Rajeevan et al.[29]identified active/break spells of monsoon if the average standardized rainfall anomaly was more or less than±1.0.They considered (1× 1) gridded daily rainfall dataset for the Indian region. Rao et al. [23] reduced the threshold value of rainfall anomaly to±0.5 for(0.5×0.5)gridded dataset.We have adopted the threshold as ±0.5 following Rao et al. [23]. If the rainfall anomaly exceeds+0.5 for three or more days,the event is designated as active,and if it is less than-0.5,it is taken as a break spell.Computational procedure of normalized rainfall anomaly in this study, has been mentioned in section 2. Time series of active and break spells of 2014 and 2015 are illustrated in Fig. 2a and b.There were 2 active spells and 9 break spells in 2014,whereas the number of wet and dry spells in 2015 were 2 and 6, respectively.The duration of dry spells is longer and varies between 3 and 18 days and those of wet spells are shorter,varying between 3 and 9 days. These results conform with other reports [23,29]. Rao et al.[23] has also discussed the spatial variation of active and break spells for various regions in India.The details of dry,wet spells and corresponding average temperatures obtained in this study are shown in Table 1. It can be observed that the mean temperatures of the dry spells with longer durations and wet spells with shorter durations are generally higher compared to other spells.A longer data series is needed for further confirmation.A similar result has been reported by Ye [30] using 45 years of data from 517 Russian stations. Mohan and Rao [31] reported variation of wind magnitude during a dry and wet spell of monsoon over land,particularly over peninsular India,where the wind speed during a dry spell is stronger than during the wet spell.We investigated the same over Hyderabad but could not find any clear pattern over the two years of study.The average wind speeds during the break spells of 2014 and 2015 are 1.4 m/s and 1.94 m/s, respectively. Average wind speeds corresponding to the active spells are 0.9 m/s and 1.98 m/s.A much longer data series is required to confirm the relationship.
4.2. Correlation study
A cross-correlation study has been undertaken between various atmospheric variables to establish their relationships and dependency on each other. Higher temperatures are expected to cause larger evaporation leading to a positive correlation between the two variables. A correlation study between surface temperature and IWV of two complete years' data produced a correlation coefficient (ρ) 0.446 with a 95% confidence level. It is worth mentioning that Wang et al. [32] reported a better correlation between PWV and surface temperature at night than during the daytime,indicating a diurnal asymmetry trend.If the data is split into two individual years(2014 and 2015)respectively,values of ρ are 0.449 and 0.368.The effect of summer was tested by removing the summer months(June,July,August,and September)from the data, and the ρ values got increased to 0.454 and 0.534 respectively. Correlation coefficients for only the summer months of 2014 and 2015 are-0.235 and-0.462.Value of ρ corresponding to the combined summer months of both the years yielded ρ = -0.08. It appears that higher values of IWV in summer increase the possibility of higher precipitation efficiency depending on other dynamic conditions like vertical and horizontal advections [33]. The precipitation, in turn, lowers the surface temperature giving rise to this observed anti-correlation.Majumder et al.[34] also reported a negative correlation between surface temperature and rainfall during summer and gave a similar explanation.Variation of IWV with surface temperature for 2014 and 2015 are shown in Fig. 3a and b. Moderate level of the correlation coefficient value obtained in this study(ρ=~0.44)is depicted in the scatter plot of Fig. 4.

Fig.2. a)IWV(blue,left-hand ordinate)and time series of standardized rainfall anomaly(red,right-hand ordinate)during the monsoon of 2014 to identify dry and wet spells.The horizontal lines represent±0.5 standardized rainfall anomalies;b)IWV(blue,left-hand ordinate)and time series of standardized rainfall anomaly(red,right-hand ordinate)during the monsoon of 2015 to identify dry and wet spells. The horizontal lines represent ±0.5 standardized rainfall anomalies.

Table 1 Duration of dry and wet spells.

Fig. 3. a) Daily mean IWV (blue, left-hand ordinate) and surface temperatures (red, right-hand ordinate) of 2014; b) Daily mean IWV (blue, left-hand ordinate) and surface temperatures (red, right-hand ordinate) of 2015.

Fig. 4. Scatter plot between IWVs and surface temperatures for the years 2014 and 2015.
We have also attempted to investigate the relationship between IWV and rain by analyzing the data of summer monsoon months.The variation of IWV with rain,P.E,and the variation of rain with P.E are illustrated in Fig.5a and b for the summer monsoon months of 2014 and 2015 (combined). An extremely good correlation is evident between rain and P.E(Fig.5c),whereas Fig.5a and b show quite irregular variations. The cross-correlation coefficients are -0.054 (IWV-Rain), -0.104 (IWV-P.E), and 0.983 (Rain -P.E),respectively. All these correlation coefficients are with 95% confidence level. The scatter plots are displayed in Fig. 6a, b and c. A poor/negative correlation between water vapor and rain has been reported by many researchers[3,35-37]. But Majumder et al. [34]observed a positive correlation (~0.5) between daily IWV and rainfall for three years(2012-2014).Ortiz de Galisteo et al.[13]did not observe any proper correlation between IWV and precipitation.Ye et al.[11]studied the relationship between precipitation,relative humidity (RH), P.E and PWV using the data of 505 stations in Northern Eurasia for winter and summer (2003-2010). They observed that higher temperature leads to higher PWV in winter and gives rise to rain without much impact on P.E. But during summer higher temperatures decrease RH,P.E and precipitation in spite of having high PWV.
4.3. Diurnal variation of IWV during active and break spell
The diurnal variation of IWV depends on several atmospheric processes like convection, rain, evaporation, winds, and temperature. It is also dependent on incoming solar radiation and local topography. Numerical weather prediction models improve shortrange forecasting by incorporating GPS IWV [38-40]. The study of diurnal variation of atmospheric IWV at different scales is thus very important.It should be noted that the amplitudes of GPS IWV estimates of the diurnal cycle depend on the mean temp (T) and surface temp (T) regression accuracy [41]. The diurnal oscillation over Hyderabad using IWV has been studied in detail by Jadala et al.[6]. In this section, we attempt to investigate the diurnal variation of IWV,specifically during active and break spells of monsoon.The numbers of dry and wet spells identified in the 2014 summer monsoon are nine and two, respectively, with complete diurnal cycle data of IWV(48 points)with a gap of half an hour.The data are available for 2015 show three dry spells (DS) and one wet spell(WS). The 48 averaged half-hourly values of IWV of each spell are detrended (mean values removed) to obtain half-hourly fluctuations and are depicted in Fig. 7 with standard deviations, which show quite large day-to-day variabilities.Two maxima(peaks) are visible at 15.30 and 23.30(IST),which are clearer during dry spells compared to wet spells. Harmonic analysis technique has been applied to compute the amplitudes of diurnal (24 h),semi-diurnal(12 h), and ter-diurnal (8 h) components.
The results are displayed in Table 2. Amplitudes of diurnal oscillation during dry spells of both the years range between 0.21 kg/mand 1.87 kg/mand those of wet spells between 0.41 kg/mand 1.44 kg/m. Amplitudes of semi-diurnal and ter-diurnal oscillations are almost half and one third of diurnal oscillation.The variations in the amplitudes are quite large, and no specific conclusion can be drawn. But the mean amplitudes of the oscillations are given by 1.084 kg/m(24 h), 0.526 kg/m(12 h) and 0.34 kg/m(8 h)during dry spell and 0.688 kg/m(24 h),0.419 kg/m(12 h) and 0.239 kg/m(8 h) during wet spell. The results indicate that the amplitudes of the oscillations are approximately double during dry spell compared to those during wet spell.

Fig.5. a)IWV(blue,left-hand ordinate)and rain(red,right-hand ordinate)for the years 2014 and 2015;b)IWV(blue,left-hand ordinate)and P.E(red,right-hand ordinate)for the years 2014 and 2015; c) rain (red, left-hand ordinate) and P.E (blue, right-hand ordinate) for the years 2014 and 2015.

Fig.6. a)Scatter plot between rain and IWV for the years 2014 and 2015;b)Scatter plot between P.E and IWV for the years 2014 and 2015;c)Scatter plot between P.E and rain for the years 2014 and 2015.

Fig. 7. Mean diurnal fluctuations of IWV during dry and wet spells for 2014 and 2015. Standard deviations are depicted by vertical bars.

Table 2 Amplitudes of diurnal, semi-diurnal and ter-diurnal oscillations of IWV during dry and wet spells.
5. Summary
GPS measured zenith delays of two years (2014 and 2015) are converted to IWVs using MET data of collocated MBLM and interpolated MET data of IMD and have been validated with the recent ECMWF Re-Analysis (ERA) 91 level data with a satisfactory agreement. But the measured winds do not show such close agreement with the model data,particularly during the summer months.IWV data are then split into active and break spells of Indian summer monsoon for the two years under study. The rain data are downloaded from TRMM version 7 for 0.25×0.25grid,which is closest to the latitude-longitude of Hyderabad. Cross-correlation studies have been carried out to establish relationships of IWV with other atmospheric variables like surface temperature, precipitation, and P.E. The correlation coefficient between IWV and surface temperatures for two years yields a positive value(0.446).The correlation coefficients are with a 95% confidence level. When the summer months (June, July, August, and September) are deleted from the data, the coefficient increases slightly. When correlation is conducted with only summer months’ data of two years, the value reduces to -0.08. The precipitation during the summer months possibly brings down the surface temperature and causes the correlation coefficient to become negative.
Correlations of IWV with precipitation and P.E reveal some interesting results.Correlation coefficients between IWV-rain,and IWV-P.E are -0.054 and -0.104, respectively, whereas the coefficient is 0.983 between rain and P.E. This proves that precipitation does not take place only with high values of IWV; it needs the required degree of saturation and appropriate dynamics to convert water vapor into measurable precipitation. Appropriate dynamics has mentioned in section 4.2. Low rainfall with low P.E shows the absence of required dynamic mechanism;high rainfall with high P.E means that the dynamic mechanism is capable of releasing abundant water vapor in the atmosphere,and high rainfall with low P.E signify a lot of available moisture, which could not be converted into precipitation due to inefficient local dynamics[10].
Diurnal variations of IWV during active and break spells have been studied by applying harmonic analyses. The diurnal, semidiurnal, and ter-diurnal components do not show a clear trend with respect to the spells,but their mean amplitudes during break spells show approximately double amplitudes compared to those during active spells. Future work is planned to analyze a longer dataset to confirm these findings and investigate the diurnal asymmetry of IWV as pointed out by Wang et al. [32].
Author statement
This paper is not published elsewhere or under review or submitted to another journal.
Conflicts of interest
The authors declare that there are no conflicts of interest.
Acknowledgement
Two of the authors Ms. Nirmala Bai Jadala and Dr. Gopa Dutta are thankful to National Atmospheric Research Laboratory(NARL),Dept of Space,India for installing a GPS/GNSS receiver at VBIT.One of the authors, Ms. Nirmala Bai Jadala, is thankful for the research fellowship offered by ISRO under RESPOND program[No.ISRO/RES/2/406/16-17]. The computational work for the research has been carried out in the computational laboratory developed by DST's FIST grant.
杂志排行

Geodesy and Geodynamics的其它文章
- Quaternary tectonic history of seismically active intraplate Kachchh Rift Basin, western India: A review
- Response of drainage to tectonics and PS-InSAR derived deformation study in Bilaspur, northwestern Himalaya, India
- Relative active tectonics evaluation using geomorphic and drainage indices, in Dadra and Nagar Haveli, western India
- Manifestation of earthquake preparation zone in the ionosphere before 2021 Sonitpur, Assam earthquake revealed by GPS-TEC data
- Geodetic characterization of active Katrol Hill Fault (KHF) of Central Mainland Kachchh, western India
- Crustal deformation measurements by global positioning system(GPS) along NSL, western India