Manifestation of earthquake preparation zone in the ionosphere before 2021 Sonitpur, Assam earthquake revealed by GPS-TEC data
2022-05-18GopalSharma
Gopal Sharma
North Eastern Space Applications Centre, Umiam, 793103, Meghalaya, India
ABSTRACT Global Positioning System (GPS) Continuously Operating Reference Station (CORS) data analysis shows that the ionosphere's electron density variability is linked to the deformation and stress accumulation in the Earth's crust. Anomalies in ionosphere total electron content (TEC) variability before 2021 M6.4 Sonitpur, Assam earthquake were detected using L1 and L2 GPS frequencies that showed three distinct abnormalities on April 3, 9,10, 2021. Pearson's correlation coefficient (r) of TEC decreases in the CORS that lies away from the earthquake epicenter, indicating the possibilities of a positive relationship between TEC variability and earthquake epicenter.TEC concentration also decreases towards the epicenter within the earthquake preparation zone (EPZ). It is also observed that the Pearson's correlation coefficient (r) of TEC decreases linearly near the EPZ. The study demonstrates the possibilities of determining the TEC anomalous zone in the ionosphere that coincides with the EPZ in the crustal rocks.The research indicated the possibilities of magnitude estimation of an impending earthquake based on the TEC anomalous zone in the ionosphere using closely spaced dense CORS network data.© 2022 Editorial office of Geodesy and Geodynamics. Publishing services by Elsevier B.V. on behalf of KeAi Communications Co. Ltd. This is an open access article under the CC BY-NC-ND license (http://creativecommons.org/licenses/by-nc-nd/4.0/).
Keywords:GPS TEC Sonitpur earthquake Ionosphere perturbation TEC anomaly Magnitude estimation
1. Introduction
The surface manifestations of stress development before an earthquake have been studied through techniques such as crustal deformation analysis using Global Positioning System (GPS), Morphotectonic analysis using Digital Elevation Models (DEM) data,radar interferometry analysis,and seismicity analysis in most of the seismically active regions [1-8]. The manifestations at the ionosphere can be studied by monitoring electron density or total electron content (TEC). Many researchers reported, GPS derived TEC fluctuates from normal behaviors before the occurrence of earthquakes [9-25]. These variations in ionosphere TEC indicate the manifestations of crustal stress development before the occurrence of an earthquake.Anomaly in TEC could be due to deformation and stress development processes. Such processes are the emission of Radon[20,22,23,26,27]and the release of p-holes from the Earth's surface. The p-hole theory, supported by laboratory experiments,suggests a decrease in electrons concentration at the initial phase of ionisation,followed by an increase in its concentration[28,29].GPS TEC analysis also showed decreased TEC concentration before the earthquakes,apart from an abnormal increase[30-34],and appears to be a prominent tool in earthquake precursor detection. Few studies also suggest an increase in TEC concentrations during a significant solar flare and geomagnetic storm[14,35,36].
A M6.4 earthquake rocked the Sonitpur region of Assam on April 28,2021,07:51:25 Indian Standard Time.The epicenter of the quake was at 26.69N and 92.36E, according to the National Centre for Seismology (NCS). The focus of the epicenter was at a depth of 17 km, and the tremor lasted for nearly 30 s. GPS TEC analysis is performed to detect anomalies in TEC variations before the 2021 Sonitpur, Assam earthquake using data from 19 GPS Continuously Operating Reference Station (CORS) installed by University NAVSTAR Consortium (UNAVCO). Fig. 1 shows the locations of each CORS used in the present analysis together with the tectonic framework of the region adopted from the Geological Survey of India, Seismotectonic atlas [37]. The study is undertaken to understand the TEC anomaly and TEC Spatial anomalous zone in the ionosphere towards the observation stations near the epicenter and its relation with the EPZ in the crustal rocks.

Fig.1. 2021 Sonitpurearthquake epicenterfromUSGS,GPSdatausedinpresent analysis and tectonicframework inand aroundepicenterregion adoptedfrom GSI,Seismotectonicmap[37].
2. Data and methodology
2.1. Data used in the analysis
GPS receiver independent exchange(RINEX)data from UNAVCO Continuously Operating Reference Station(CORS)were used in the present analysis. Observation stations having continuous data of forty-five days prior to the earthquake were utilized.The data used in the present study is accessible to the public through the server hosted at ftp://data-out.unavco.org/pub. GPS RINEX data from nineteen(19) stations were used, the details of which are given in Table 1.
2.2. Methodology
The radius of the EPZ for the M6.4 Sonitpur, Assam earthquake was estimated as per Dobrovolsky equation [38]. The publicly available GPS CORS having continuous RINEX data for 45 days priorto the occurrence of the earthquake was selected for TEC estimation. Electron concentration along the line of sight in the ionosphere (between the observation station and satellite) known as slant TEC(sTEC),was computed using phase and code from L1 and L2 GPS frequencies [39-42]. sTEC was converted into equivalent vertical total electron content or vTEC assuming a single shell ionosphere at an altitude of 350 km[43].For estimating the vertical TEC, the elevation and azimuth angles of the satellite were calculated using a navigation file.However,this conversion often leads to errors, and differential code bias (DCB) files obtained from the University of Bern were used to eliminate the errors due to conversion from slant to vertical TEC [44]. The anomaly in the TEC observations was detected using the statistical approach as below

Table 1 GPS data from UNAVCO used in the present analysis and their aerial distances from the Sonitpur epicenter.

Where X is the 15-day running mean, and σ is 15 days running standard deviation for a particular time of observation.TEC values crossing below the limit defined by equation(1)are considered an anomaly, and vTEC must lie above the boundary limit in normal ionospheric conditions. Since high TEC variability may be associated with other factors such as geomagnetic storm,solar flare,and air temperature, only low TEC anomalies are considered in the present analysis.To identify the variability in TEC from one station to another and to derive a general trend in TEC variations concerning earthquake epicenter, Pearson correlation coefficient (r)was adopted, which is a statistical measurement of linear correlation between two variables [45].
3. Result and discussion
The Sonitpur earthquake's epicenter is located near Kopili and Dighalpani- Kakijan faults, which are the active faults as per GSI,as shown in Fig. 1. The area falls in seismic zone V and is associated with collisional tectonics between the Indian and Eurasian Plate. Six aftershocks of M3.2 to M4.7 were located within 2 h 30 min from the time of mainshock.These aftershocks signify the release of stress in the vicinity of the source zone in the Sonitpur region (NCS). The radius of the EPZ was estimated and found to be 565 km. Nineteen GPS CORS lies within and outside the EPZ was found to have continuous data and was utilized for TEC estimation. The nearest data available from the earthquake epicenter was from CORS Juri, located at Fultola road in Bangladesh. The station lies at an aerial distance of 256 km from the earthquake epicenter.
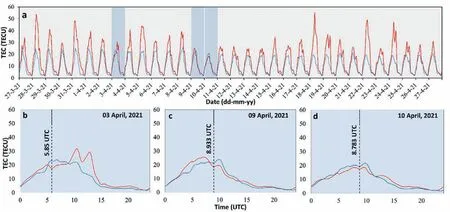
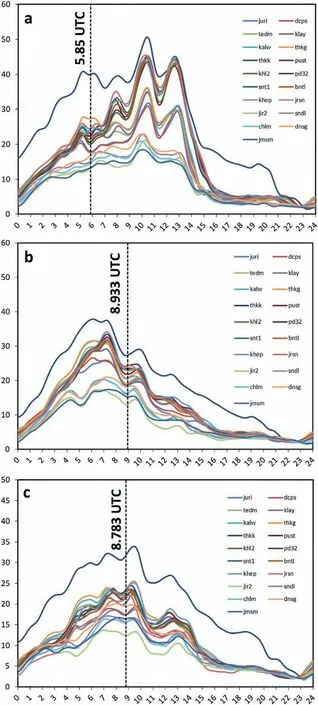
Statistical analysis of the TEC data of 45 days before the earthquake from the nearest observation station(Juri)shows TEC below the boundary limit on April 3, 9, and 10, 2021 (Fig. 2a). TEC time series analysis of the rest of the data from CORS also showed consistent anomaly on April 3,9,and 10,2021.Several studies have suggested eliminating high TEC days in precursor analysis that may have occurred due to the influence of the geomagnetic storm,solar flare,air temperatures,and other related atmospheric phenomena apart from an earthquake. Therefore, only the low TEC anomaly(TEC crossing below the limit defined by equation (1)) was considered in the present study. Laboratory experiments also support low TEC anomaly in precursor detection as conducted by Freund [29]. To better understand the precursory signal related to the earthquake,the time at which the TEC deviation was minimum,as shown in Fig. 2b-d, was analyzed. The time of minimum TEC deviation from nearest CORS (Juri) was identified and named as“TEC anomaly time (TAT)", which was taken as reference for anomaly identification in the rest of the observations stations(CORS). TEC observation during the anomalous days from all the CORS is as shown in Fig. 3.
To confirm the nature of the anomaly,a study on the epicentral distance between different CORS and variations in TEC magnitude is essential. In the present study, the relationship between TEC magnitude and CORS at different distances from epicenter was established by computing the TEC values from all CORS at detected anomaly time from the nearest station.The TEC anomaly time on 3,9, and 10 April 2021 was seen as 5.85 UTC, 8.933 UTC, and 8.783 UTC,respectively,as shown in Fig.2 and Table 2.Fig.4 represent the TEC variations at all CORS observed on the anomalous days and the detected TEC anomaly times. The TEC concentration decreases towards the epicenter within the window of 579 km from the earthquake epicenter. A sharp change in TEC concentration was seen after a distance of 579 km from the earthquake epicenter.The observation suggests two anomalous zones, one with a radius of 579 km,another after 579 km,and indicates that TEC concentration decreases towards the epicenter within the first zone, which may be the EPZ (estimated as 565 km as per Dobrovolsky equation).However,it is recommended to carry out the analysis with a denser network of data that may give detailed observation.

Fig.2. GPS total electron content observations and anomalies before Sonitpur earthquake.a:Total electron content time series during March 27-April 27,2021.Redline is daily TEC variations,and the blue line is the lower boundary limit.Anomalous observation days are marked with light blue rectangles on April 03,09,and 10,2021.The Y-axis represents TEC in TECU,whereas X-axis represents the date.b:TEC observation on April 03,2021,where minimum deviation was observed at 5.85 UTC.c:TEC observation on April 09,2021,where minimum deviation was observed at 8.933 UTC.d:TEC observation on April 10,2021,where minimum deviation was observed at 8.783 UTC.In b to d,the X-axis represent time in UTC, whereas the Y-axis is the TEC observed in TECU.

Fig. 3. GPS TEC variations during the anomaly days.a:April 03,2021;b:April 09,2021;c:April 10,2021.The X-axis represents time in UTC,whereas the Y-axis is the TEC observed.
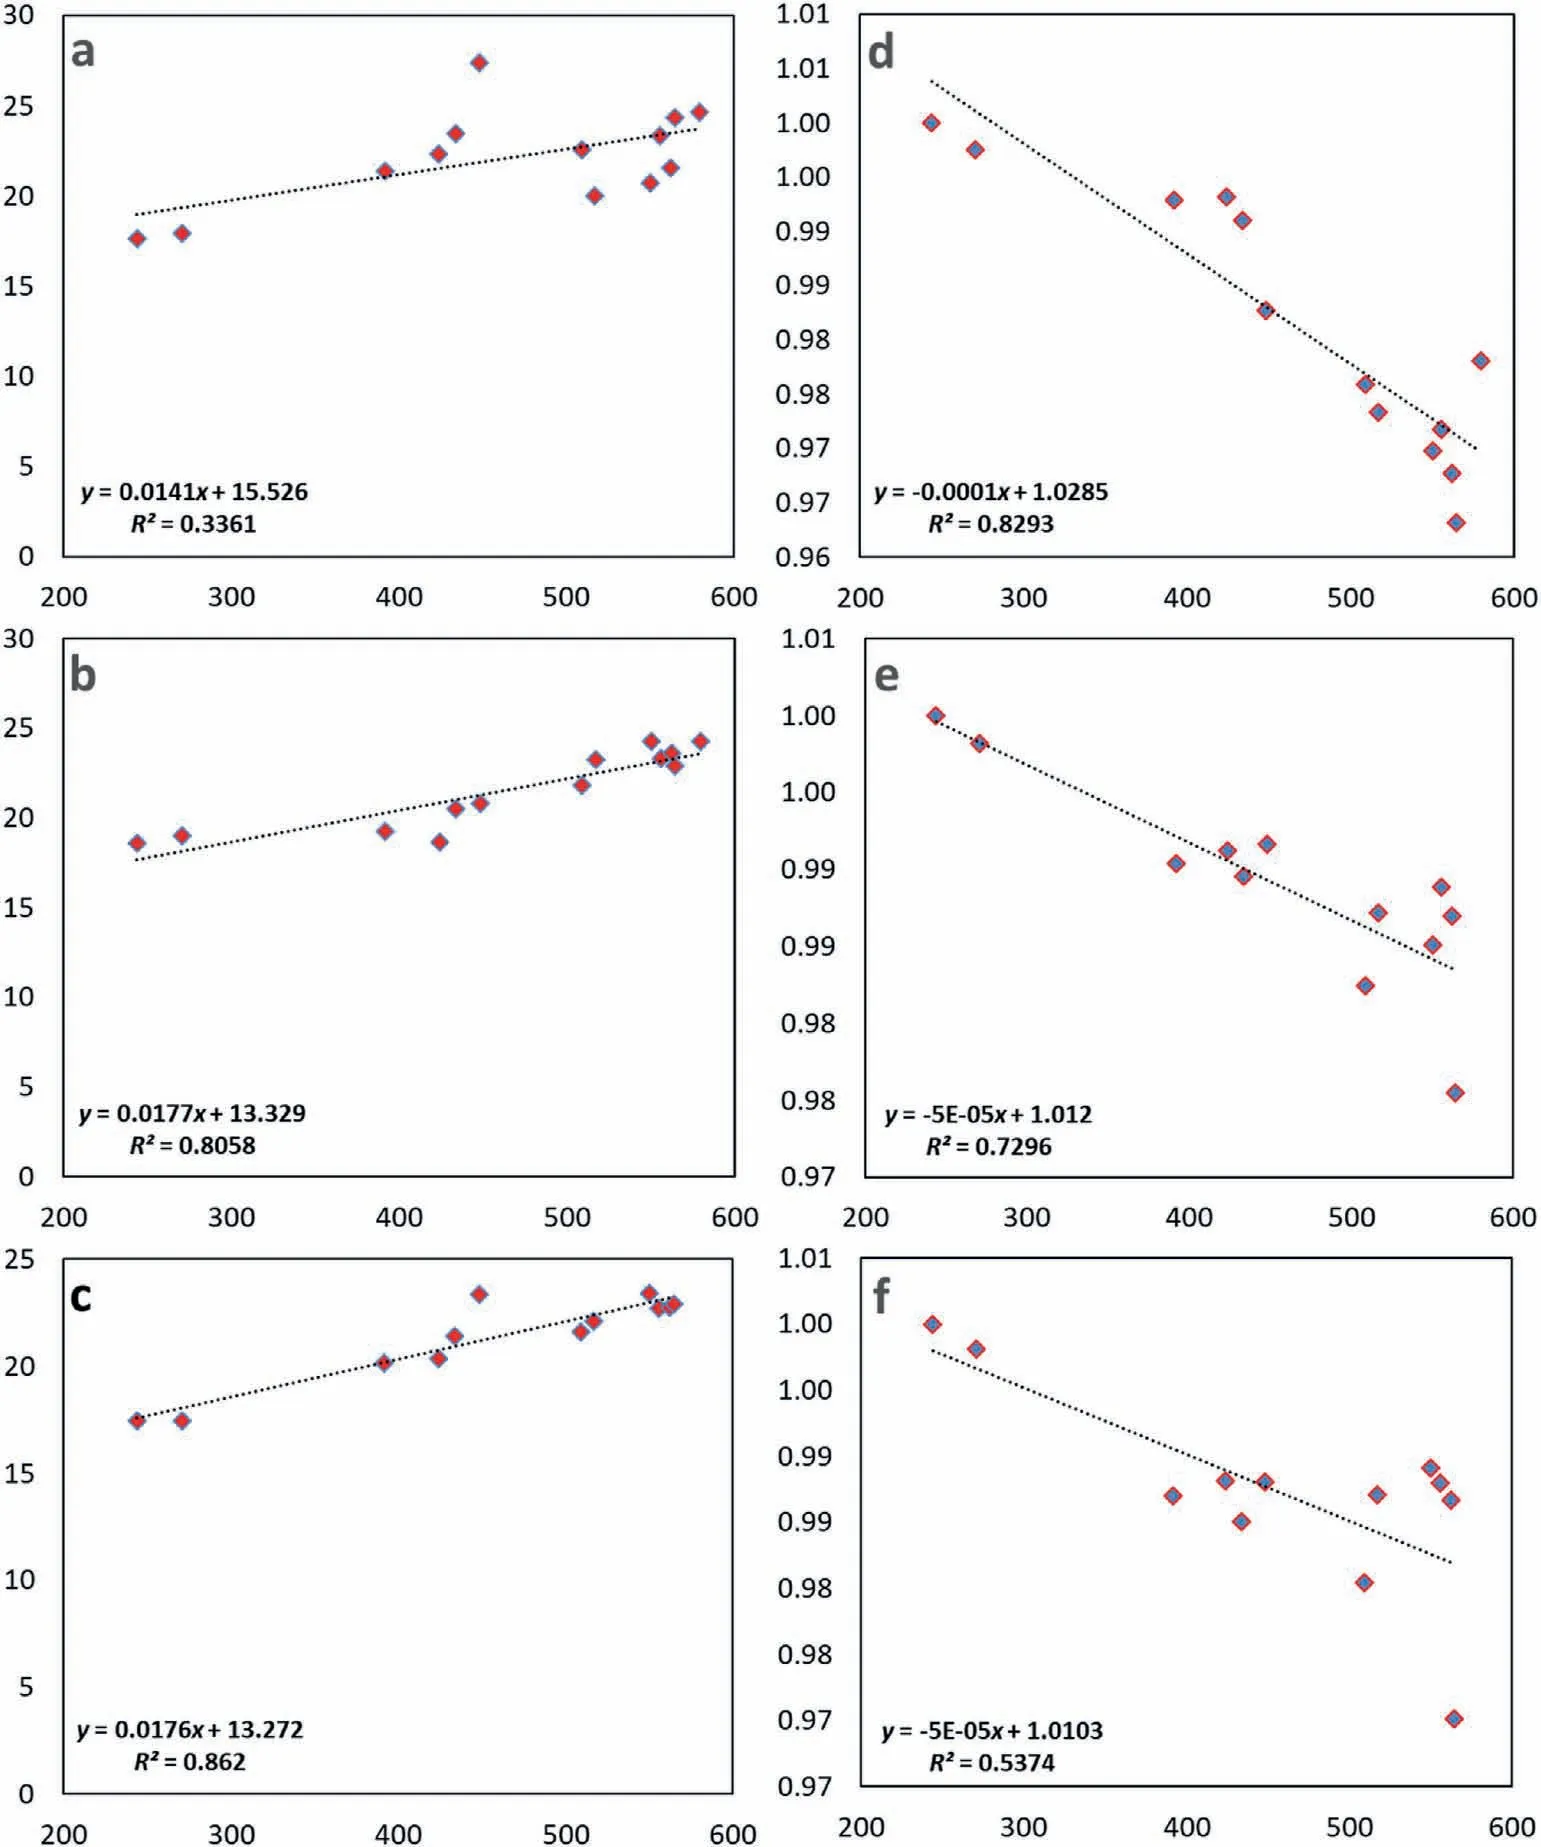
Pearson's correlation coefficient (r), a statistical analysis of the collinear relationship between two variables, was performed for each CORS datasets to determine the nature and segregate the subtle change in TEC variations magnitude. It involves covariance ratio and the standard deviation of the data values between two given variables and ranges between-1 and+1.Values close to+1 show a strong positive correlation,those close to-1 show a strong negative correlation, and those closest to 0 show no relation.Pearson's correlation coefficient (r) of each CORS was calculated concerning nearest CORS (juri) and observed that correlationcoefficient (r) decreases away from the earthquake epicenter(Fig. 5). CORS situated in order of increase in their distances from the epicenter showed a distinct nature in correlation coefficient(r)variations. The correlation coefficient (r) initially decreases and then increases (Fig.5a) or remains unchanged (Fig.5b and c) after crossing a distance of 565 km that coincides with the radius of the EPZ.The analysis was carried out for all the anomalous days(April 3, 9, and 10, 2021) and was similar in all the cases. TEC and Pearson's correlation coefficient (r) trend with respect to distances of the CORS within EPZ is shown in Fig.6.These observations open an avenue for determining the magnitude of an impending earthquake,considering the anomalous zone as the radius of the EPZ as per equations given by Dobrovolsky et al. [38], The average of the distances of anomalous zone from TEC variations and Pearsons correlation coefficient variations, i.e., 570 km (Table 2), can be considered the EPZ for magnitude estimation of an impending earthquake. For example, the magnitude of the Sonitpur earthquake will be M6.409, considering the radius of the EPZ to be 570 km, the average anomalous zone. However, these estimates may vary depending upon the number of data(CORS)available for analysis. Therefore, the study demonstrated the possibilities of epicenter tracing and magnitude estimation with large data analysis and recommended a denser network of observations stations(CORS)for detailed studies.

Table 2 TEC anomaly, TEC anomaly time, and radius of the anomalous zone before the occurrence of Assam, Sonitpur earthquake.

Fig.4. TEC variability with respect to distance from earthquake epicenter at detected anomaly time.a:TEC at 5.85 UTC,on April 3,2021;b:TEC at 8.933 UTC,on April 9,2021;c:TEC at 8.783 UTC, on April 10, 2021. The X-axis represents the CORS at different distances from the earthquake epicenter, and Y-axis is the TEC observed at TEC anomaly time.

Fig.5. Pearson correlation(r)of available CORS with respect to nearest CORS.a:April 3,2021;b:April 9,2021;c:April 10,2021.The X-axis represents the aerial distances from the epicenter at which each CORS is located, whereas the Y-axis is the Pearson correlation (r) of each CORS with the nearest CORS.

Fig.6. Trend in TEC and Pearson correlation(r)of available CORS within the EPZ.a-c:TEC trend on April 3,2021;April 9,2021;and April 10,2021.d-f:Pearson correlation(r)trend on April 3, 2021; April 9, 2021; and April 10, 2021. The X-axis represents the aerial distances from the epicenter at which each CORS is located.
4. Conclusions
The study suggests that the deviation in ionosphere TEC,significantly the decrease in TEC concentration before the Sonitpur earthquake, may have resulted from the manifestation of stress development in the crustal rocks. TEC values are found to be minimum at CORS near the epicenter and it increases away from the epicenter at anomaly time. The trend in TEC variations was observed within the window of 579 km from the earthquake epicenter, i.e., very close to the earthquake preparation zone of 565 km. Pearson's correlation coefficient (r) also suggested initial decreases in TEC concentration at CORS that lie within a distance of 565 km, which coincides with the radius of the earthquake preparation zone. The study observed a positive relationship between Dobrovolsky et al.[38],EPZ on the crust and spatial TEC variation in the ionosphere before the 2021 Sonitpur, Assam earthquake. This relation may prove effective for the estimation of the magnitude of impending earthquakes. However, a number of test studies with a large network of closely spaced CORS data are highly recommended to study the present relationship in detail that may/maynot vary from case to case. The study demonstrated the possibilities of manifestation of the radius of EPZ of the crust in the ionosphere with the aid of limited datasets available in the public domain.
Conflicts of interest
The author declare that there is no conflicts of interest.
Acknowledgements
The author expresses deep gratitude to Dr. P K Champatiray, IIRS-ISRO, for his guidance throughout, who left for heavenly abode on 30 May 2021 and dedicates the present work in his memory. The author thanks UNAVCO for providing GPS data and IIG Mumbai for providing TEC computing program used in the present study. The author thanks anonymous reviewers and editor for their fruitful comments, which improved the current study manifold.
杂志排行
Geodesy and Geodynamics的其它文章
- Quaternary tectonic history of seismically active intraplate Kachchh Rift Basin, western India: A review
- Response of drainage to tectonics and PS-InSAR derived deformation study in Bilaspur, northwestern Himalaya, India
- Relative active tectonics evaluation using geomorphic and drainage indices, in Dadra and Nagar Haveli, western India
- Integrated water vapor during active and break spells of monsoon and its relationship with temperature, precipitation and precipitation efficiency over a tropical site
- Geodetic characterization of active Katrol Hill Fault (KHF) of Central Mainland Kachchh, western India
- Crustal deformation measurements by global positioning system(GPS) along NSL, western India
