Metrics analysis of tactile perceptual space based on improved NMDS for leather textures
2022-04-19HuangGewenHeCongWuJuanWangFei
Huang Gewen He Cong Wu Juan Wang Fei
(School of Instrument Science and Engineering, Southeast University, Nanjing 210096, China)
Abstract:To solve the fuzzy and unstable tactile similarity relationship between some sample points in the perception experiment, an improved non-metric multidimensional scaling(INMDS)is proposed in this paper.In view of the inconsistency of each sample’s contribution, the maximum marginal decision when constructing the perception space to describe the tactile perception characteristics is also proposed.The corresponding constraints are set according to the degree of similarity, and controlling the relaxation variable factor is proposed to optimize the perception dimension and coordinate measurement.The effectiveness of the INMDS algorithm is verified by two perception experiments.The results show that compared with the metric multidimensional scaling(MDS)and non-metric multidimensional scaling(NMDS)algorithms, the perceptual space constructed by INMDS can more accurately reflect the difference relationship between different leather sample points perceived by people.Moreover, the relative position of sample points in the perceptual space is more consistent with subjective perception results.
Key words:haptic; tactile perception; perceptual space; non-metric multidimensional scaling
Tactile perception is the human response to objective mechanical stimuli.Tactile perception is of great significance for identifying the physical attributes of the external world and improving the control accuracy[1-3].The research on the characteristics of tactile perception and the mechanism[4-6]of tactile generation is lagging behind compared with vision hearing.Consequently, it is not only difficult to accurately measure the relationship between the feature dimensions and attributes of touch but also difficult to establish a clear response mechanism model of receptors, such as vision.Therefore, a large number of researchers have examined the subjective perception of objective force tactile using psychophysical methods.For instance, tactile perception can be described through clustering experiments and adjective scoring experiments[7-11].The essence of these methods is to quantify and construct the tactile perceptual space using limited perceptual sample points in psychophysical experiments.
Considerable research has been performed to quantify and construct the tactile perceptual space.Some researchers have used subjective perception experiments, such as scoring based on psychophysics.Here, a given adjective for a certain stimulus is scored and evaluated using a psychological scale to obtain specific perceptual difference values.However, the subjective scoring method is quite different in experimental data because of the differences in psychological scales and personal understanding.Moreover, this method needs a host of training before the experiment.Meanwhile, the size of the perception difference obtained from subjective perception experiments can be further used to calculate the perception space.Multidimensional scaling(MDS)is a statistical research method that simplifies a research object in a multidimensional space into a low-dimensional space and classifies them according to the similarity between samples or variables[12-19].MDS includes metric and non-metric algorithms[17].Metric MDS takes the paired distance between stimuli as an input and calculates the embedding of all samples in a multidimensional space that respects their relative positions[18].Neumann et al.[20]studied the correlation between tactile perception roughness and surface geometric parameters(e.g., contour arithmetic mean deviation, Ra)using MDS, which was used to predict the tactile perception of different groups on rough surfaces.This classification method allows participants to classify multiple materials presented simultaneously according to similarity, which is user-friendly and has advantageous data consistency.However, this method cannot obtain accurate similarity data between research objects, assuming that the texture discrimination of the same source is very small.Moreover, it may lead to the loss of differential information.Therefore, the metric MDS is no longer applicable, and the non-metric MDS(NMDS)method based on the ranking method is needed.Piovari et al.[21]analyzed a sample’s tactile perception by sorting the subjective perception compliance.The sorting method is relatively simple and has advantageous consistency between subjects.Therefore, the sorting method is proven to be of advantageous stability and effectiveness[21-22].By using NMDS, distance values can be calculated according to the sorting order without the need for manual inputs[23-26].The constraint of the traditional generalized NMDS algorithm is to assume that the similarity relationship between samples is significant and stable.In the perception experiment, the tactile similarity relationship between some sample points is fuzzy and unstable.Therefore, it is necessary to identify the similar or significant differences in perceptual similarity.
To solve this problem, an improved NMDS(INMDS)algorithm is proposed to quantify and construct the tactile perceptual space.In view of the inconsistency of each sample’s contribution, the maximum marginal decision when constructing the perception space to describe the tactile perception characteristics is proposed.The corresponding constraints are set according to the degree of similarity, and controlling the relaxation variable factor is proposed to optimize the perception dimension and coordinate measurement.This method can enlarge the perceptual space distance of sample points with low similarity and reduce the distance of sample points with high similarity.The results verify that the INMDS algorithm can effectively describe the tactile perception, and the sample’s perceived difference is clear.
1 Methods
In this section, the proposed method will be described in detail.First, a brief description of the NMDS algorithm is presented to lay the context for describing our INMDS algorithm for indistinguishable small-scale sample tactile perceptual spaces.Then, the improvement of the INMDS algorithm is introduced, and the boundary conditions are defined to constrain triplets with high and low repetition.
1.1 NMDS algorithm
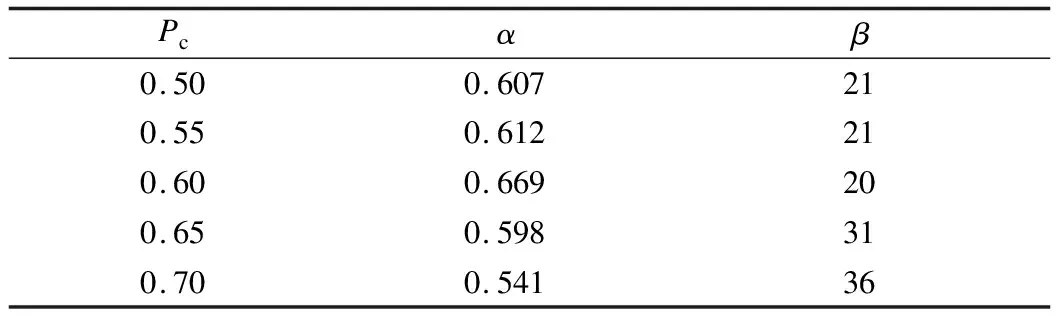
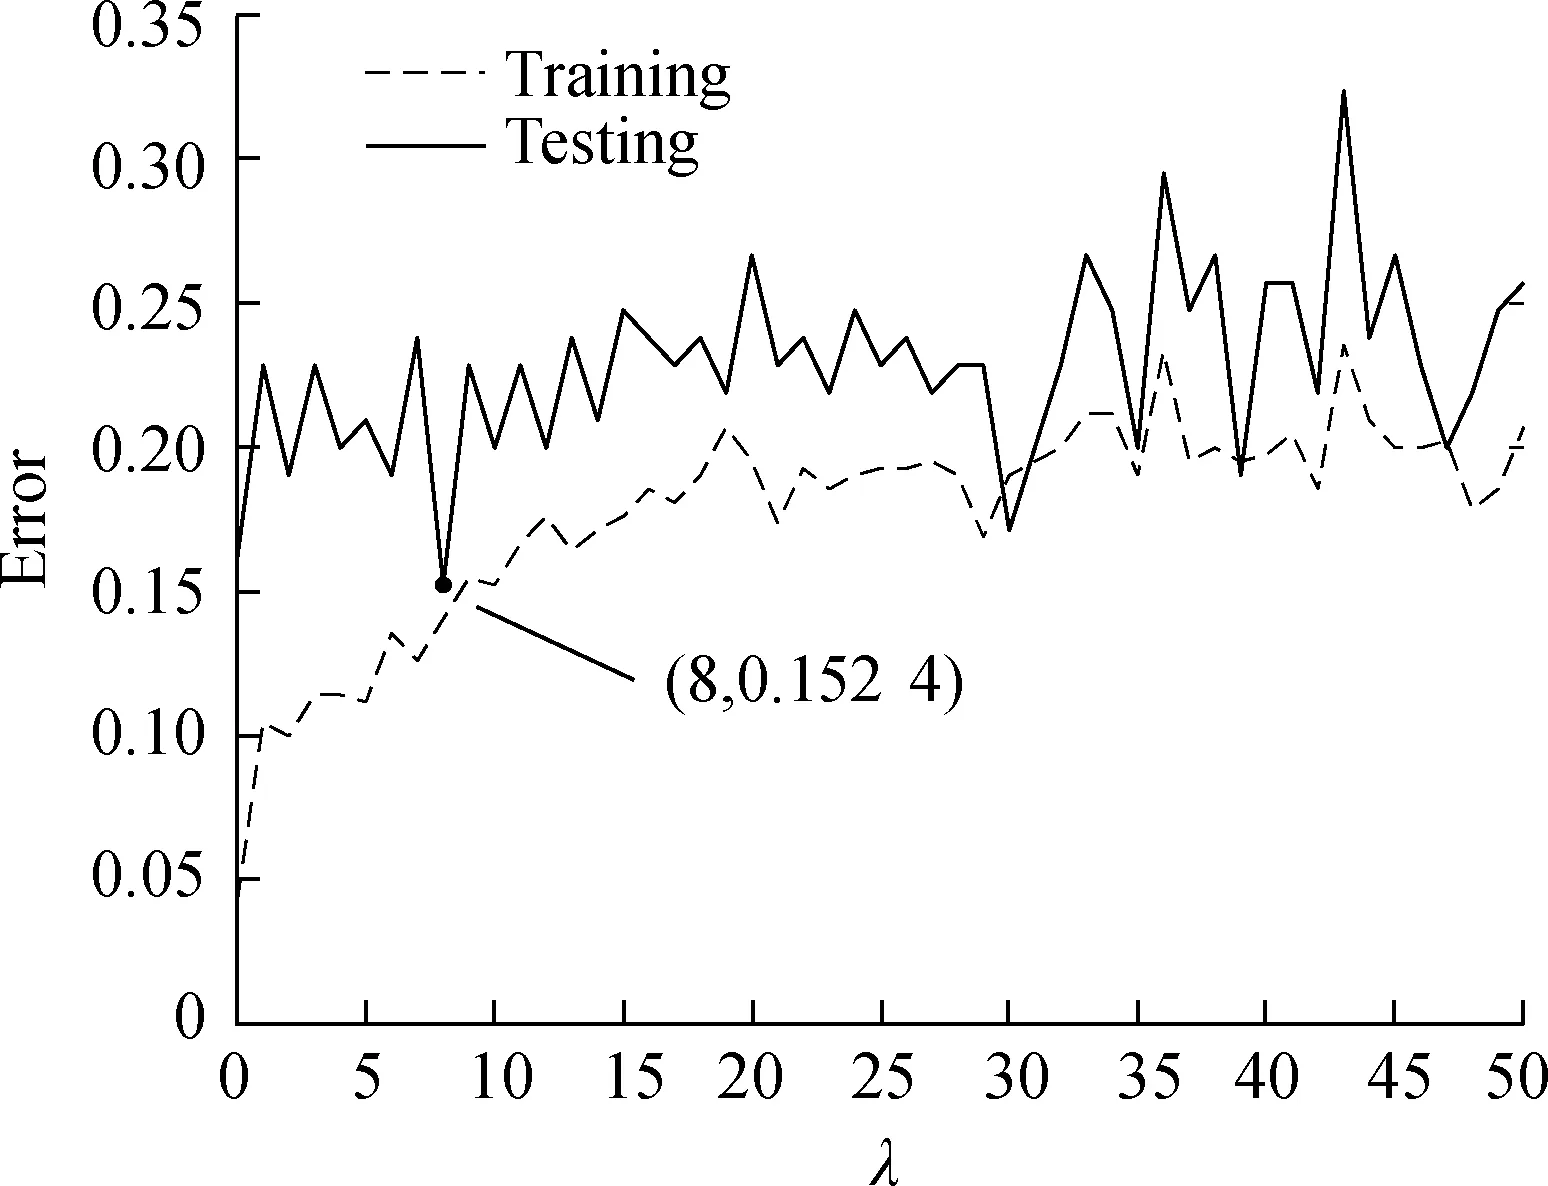
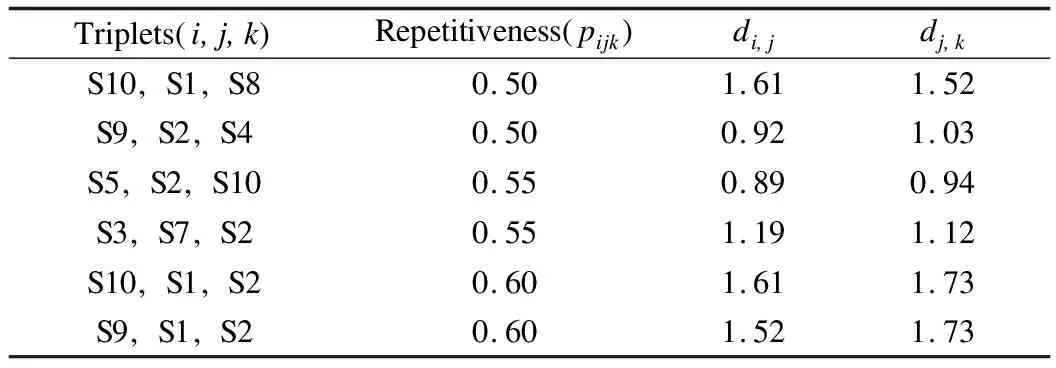
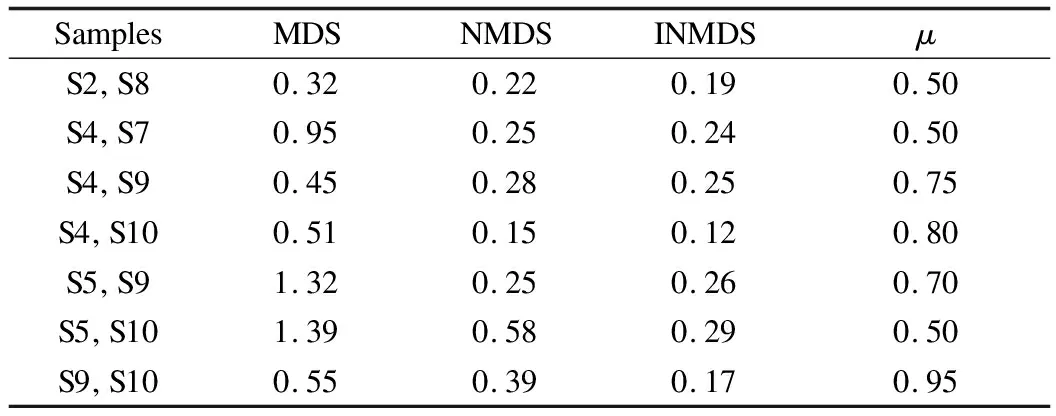
Unlike metric MDS, where the input data consist of distances between samples, our data contain triplets(i,j,k), which indicate that the distance between samplesiandjis smaller than that betweenjandk.This condition is denoted asDij NMDS takes the following multiple inequality constraints as the inputs of the algorithm: S={(i,j,k)|Dij (1) In NMDS,Dijcan be converted to matrixK.Wills et al.[22,26]summarized the NMDS solving process as the following optimization problem of solving matrixK: (2) ∀(i,j,k)∈SKkk-Kii+2Kik-2Kjk≥1-ξijk (3) ξijk≥0, ∑Kbc=0,K≥0 (4) whereKijis the element of thei-th row andj-th column ofK; tr(K)is the trace ofK; andξis a relaxation variable, which means that inequality constraints are allowed to be violated within a range.The value ofξdetermines the strictness of the constraint.The constraint strength is negatively related to the value ofξ.λis an adjustable regularized parameter, which represents the complexity of optimization problems.It balances the relationship between the inequality violation and the dimension of embedded coordinates. Eq.(2)is the objective function of NMDS, whose function is to find the coordinates of the perceptual space of samples with the minimum violation rate.Due to the uncertainty of translation and scaling, the inequality constraint(3)is not enough to determine the unique positive semi-definite matrixK.To solve this problem, Eq.(4)is added, where the embedded coordinate should be centered on the origin. In previous studies,λappears unstable with the variation of error.Later, this phenomenon was discovered to be due to the redundancy and overfitting of data.Data redundancy is caused by perceived personalized differences among different subjects.For example, for three samples, S1, S2, and S3, 10 students chose S1 and S2 to have a closer touch, whereas the other 10 students chose S3 and S2 to get closer.Such situations can result in under-constraints in solving optimal problems and unstable results.Therefore, in this study, the repetitiveness of experimental data is examined.Triplets are divided into two categories, low repetitiveness and high repetitiveness, with different constraints. This study calculates the repetitiveness(Pijk)of each triplet.The calculation process divides the number of times the subjects make this judgment by the total number of subjects: (5) whereNijis the number of times that the subjects think thatiandjare more similar in the triplet(i,j,k), andNis the number of times all subjects make judgments on the triplet. The NMDS algorithm ignores the difference of repetitiveness and assumes that all triplets have the same contribution.In fact, triplets with different repetitiveness represent different meanings.Triplets with high repetitiveness show that the data are reliable and easy to judge, and the distanceDjk-Dijof this type of triplets is large.Triplets with low repetitiveness show that the difference between samples is difficult to distinguish and the distance is close. In view of the inconsistency of each sample’s contribution, the maximum marginal decision when constructing the perception space to describe the tactile perception characteristics is proposed.The corresponding constraints are set according to the degree of similarity, and controlling the relaxation variable factor is proposed to optimize the perception dimension and coordinate measurement.The improved constraints are as follows: (6) (7) ξijk≥0, ∑Kbc=0,K≥0 (8) wherePcis a low-repetition and high-repetition boundary value, andγis the constraint coefficient, which is determined by subsequent experimental results.The repetitiveness coefficient is used as the weight(penalty coefficient)Pijkto scale the size of the slack variableλto control the strictness of the constraint.γas a constraint coefficient is used to give a restrictive constraint to the triplets with low repetitiveness.This method aims to prevent the scaled slack variable from being too small to reflect the difference in similarity.For triplets with low repetitiveness, the distanceDjk-Dijis less than a certain range.Moreover, for triplets with high repetitiveness, the distanceDjk-Dijis greater than or equal to a certain range.The higher the repetitiveness of the triplets, the greater the proportion of error penalty caused by the violation of the triplets in the objective function, that is, the stricter the constraint. To obtain the input of the INMDS algorithm, in this study, a triplet sorting experiment was designed.Twenty university students(14 males and 6 females, 22 to 27 years old)participated in the experiment.Based on a self-report, all the participants were right-handed with normal upper-limb motion and hand function.They were ignorant of the purpose of the experiments and signed informed consent forms before the experiments.Because the experiment took a certain amount of time and required a certain number of subjects, they were paid for their participation. The experiment consisted of 10 leather samples with slightly different material textures.The samples with a small degree of discrimination were produced and provided by the manufacturer to the maximum extent.The manufacturer hopes to have different actual feelings on leather samples with different textures.However, some tactile perceptual feelings are very similar and difficult to distinguish subjectively.Therefore, it needs to be quantified.The details of all the textured surfaces are presented in Fig.1, where all samples are cut into the same size. (a) The triplet sorting experiment aims to determine the difference order among samples as the input of the INMDS analysis, so as to determine the distribution relationship of the samples in the subjective perception space.In each experiment, the participants were provided with two test samples and one reference sample.They were asked to determine the test sample that was closer to the reference sample in terms of tactile perception.Then, the selected test samples, reference samples, and non-chosen test samples were recorded in order.There is no limit to the number of interactions in each experiment. Triplets(i,j,k)were obtained from the triplet sorting experiment, in whichi,j, and k of the triplets are the selected sample, reference sample, and non-chosen sample, respectively(e.g., the triplet(S2, S1, S3)).A total of 360 comparative experiments were performed.Then, the triplet inputs to INMDS were statistically analyzed, and the repetitiveness of samples was standardized.Therefore, for triplets with repetitiveness less than 0.5, we conducted a “reverse” process.Afterwards, all triplets were distributed in the interval 0.5 to 1.0.The repetitiveness of some triplets is shown in Tab.1. Tab.1 Repetitiveness of triplets obtained from the triplet sorting experiment 2.2.1 Parameters in key constraints In the INMDS algorithm, two key parameters, i.e.,Pcandγ, in inequality constraints need to be determined according to the actual test results.First, we setγ= 1 in the inequality constraint Eq.(7), where 0.50, 0.55, 0.60, 0.65, and 0.70 were selected as the boundary values of low repetitiveness and high repetitiveness.The pairwise distance between samples was calculated according to the output sample coordinates, so as to calculate the distance of each triplet.Ideally, the distanceDjk-Dijis not only positive but also proportional to repetitiveness, which means that the samples are easy to distinguish.We counted the correlation coefficientαbetween the distance and repetitiveness when selecting different boundary values and the number of groupsβthat do not meet the positive distance. As shown in Tab.2, when the boundary value is 0.6, there is an advantageous correlation and a minimum number of violation groups.Accordingly, we recorded statistics on the values ofαandβfor different values ofγ. Tab.2 Values of correlation coefficient α and violation group number β under different Pc As shown in Tab.3, whenγis 0.8, the highest correlation and least number of violation groups can be obtained.The constraints of the INMDS algorithm are as follows: Tab.3 Values of correlation coefficient α and violation group number β under different γ (9) 2.2.2 Perceptual space dimension According to the INMDS principle, the regularization parameter can affect the quality of the embedded coordinates.An advantageous embedding space should have the generalization ability, which can explain not only observed data but also unobserved data.Accordingly, in this study, the cross-validation method was performed five times to determine the best regularization parameters.The triplet dataset was divided into 80% for the training set and 20% for the test set each time.Training and test errors were measured by calculating the number of violations of paired comparisons of the training and test sets.The purpose of cross-validation is to determine the minimum test error.Fig.2 shows the training error and test error of the cross-validation and rank.As shown in Fig.2(a), when the regularization parameterλis 8, the test error reaches a minimum of 0.152 4, and the training error is relatively small.The results show that the embedding space has the best generalization ability. (a) According to the INMDS principle, the complexity of the model is determined by the regularization parameterλ.The larger the parameterλ, the simpler the model; that is, the fewer the dimensions of the perception space constructed.As shown in Fig.2(b), the dimension of the embedding space decreases with the increase in the regularization parameterλ.Whenλis 8, the value of matrixK, that is, the dimension of the embedded space, is 3.The corresponding value of stress, which can measure the deviation between the analytical results and the observation differences of the original samples, is only 0.11.To explain the dataset well, the best embedding space only needs three dimensions. To examine the accuracy of the perception spatial sample distribution and the consistency of subjective perception under the three algorithms, a validation experiment was designed.The INMDS algorithm was verified by the collected data, which includes verification experiments and comparisons against other algorithms. The sample clustering experiment aims to verify the perceived differences between samples.The basis of clustering is explained based on the adjective label description of the subjects’ perceived attributes in the sample category. 1)The subjects perceived each texture sample in turn and described the texture’s tactile perception using as many adjective tags as possible. 2)The subjects were asked to classify texture samples, with a minimum of three classes and a maximum of seven classes.In the specific experiment, the subjects perceived each texture sample in turn and classified the samples, which are considered to have the same subjective perception into the same category.During the course of the experiment, the subjects could reconfirm or modify the previous clustering results. 3)After completing the clustering experiment, the subjects were asked to describe the subjective perception or clustering basis of each type of sample. As shown in Tab.4, Mean_dist illustrates the discrimination of samples in the spatial distribution, which is the average distance between all samples calculated by the Euclidean distance;βrepresents the accuracy of the spatial distribution, which is counted by the number of groups that do not meet the positive difference.The larger Mean_dist and the smallerβ, the more accurate the sample distribution in the perceptual space.The Mean_dist of INMD is 0.954 andβof INMD is 14, which shows that the accuracy of the spatial distribution is accurate and has excellent discrimination. Tab.4 Calculation results of the three algorithms Fig.3 shows the distribution of samples in the tactile perceptual space obtained by the metric MDS, NMDS, and INMDS algorithms proposed in this paper.The dot represents the coordinate of the samples in the tactile perceptual space.Through the subjective perception clustering experiment, the samples were divided into seven categories based on similarity.The connection represents the absolute distance between similar samples from the same category.The ideal spatial distribution not only needs to distinguish samples well but also show the similarity between samples.For S2 and S8 from the same category, the absolute distance between them in INMDS is 0.19 smaller than that in the other two algorithms.The perceptual space obtained by the INMDS algorithm has small and large inter-class spacing.In addition, the method can accurately reflect the difference relationship between different leather sample points perceived by people in the perceptual space. (a) As shown in Tab.5,di,jrepresents the perceptual difference between samples i and j, which is calculated by the Euclidean distance.The triplet with low repetitiveness illustrates that it is difficult to distinguish which of the two test samples is more similar or less similar to the reference sample.Therefore,di,jis similar todj,kfor indistinguishable triplets under the INMDS algorithm, which indicates that the INMDS algorithm is consistent with subjective perception. Tab.5 Absolute distance of paired samples under low repetitiveness of triplets in the INMDS algorithm In Tab.6,μrepresents the probability of sample similarity under subjective perception, which is calculated by (10) wherePa,bis the number of participants who classified samplesaandbinto the same category in the sample clustering experiment, andPis the total number of participants in the experiment.Tab.6 shows the absolute distance between two similar samples under a highμin the three algorithms.Ideally, the higher the similarity between samples, the smaller the absolute distance.Therefore, the absolute distance in the INMDS algorithm between two similar samples is smaller than that in the metric MDS and NMDS algorithms.This finding shows that the relative position of samples in the perceptual space obtained from the INMDS algorithm is more accurate than those obtained from the other algorithms. Tab.6 Absolute distance between two similar samples under high μ in the three algorithms 1)An INMDS algorithm is proposed to quantify and construct the tactile perceptual space under small-scale samples that are difficult to distinguish subjectively.Because the probability of the similarity of actual samples is different, contributions to coordinate space settlement become difficult.Triplets were divided into low repetitiveness and high repetitiveness, and different constraints were given to these types of triplets.Meanwhile, repetitiveness was added to the constraint as the weight of the relaxation variable to increase the consistency between the fitting results and real perception results. 2)Ten leather samples that were difficult for subjective perception were quantified, and the perception space was obtained.The results show that the INMDS algorithm has high spatial distribution accuracy in the tactile perceptual space.Moreover, the sample distribution in the perceptual space of the INMDS algorithm is more consistent with the subjective clustering experimental results as compared with the metric MDS and NMDS algorithms. 3)The results show that the INMDS algorithm is not only suitable for groups that are difficult to quantify but also suitable for quantifying a perceptual space with small-scale samples.Thus, the INMDS algorithm has good application values for the perceptual quantitative evaluation and identification of samples.1.2 INMDS algorithm
2 INMDS Algorithm Implementation
2.1 Data preparation

2.2 Parameter determination


3 Experimental Verification and Analysis
3.1 Validation experiment design
3.2 Result comparison of the three algorithms

3.3 Result comparison of the algorithms and subjective clustering experiments

4 Conclusions
杂志排行

Journal of Southeast University(English Edition)的其它文章
- Statistical analysis of nondestructive testing results of cast steel joints in civil engineering structures
- Novel sensitivity analysis method and dynamics optimization for multiple launch rocket systems
- Detection of solar radio burst intensity based on a modified multifactor SVM algorithm
- Short-term traffic flow prediction with PSR-XGBoost considering chaotic characteristics
- Contract stability and default risk control of pig farming in the company and farmer mode
- Finite rate of innovation sparse sampling for a binary frequency-coded ultrasonic signal