Detection of solar radio burst intensity based on a modified multifactor SVM algorithm
2022-04-19LuoYimeiZhuXuefenLinMengyingYangFanTuGangyi
Luo Yimei Zhu Xuefen Lin Mengying Yang Fan Tu Gangyi
(1School of Instrument Science and Engineering, Southeast University, Nanjing 210096, China)(2School of Electronic and Information Engineering, Nanjing University of Information Science and Technology, Nanjing 210044, China)
Abstract:To realize the automatic detection of solar radio burst(SRB)intensity, detection based on a modified multifactor support vector machine(SVM)algorithm is proposed.First, the influence of SRB on global navigation satellite system(GNSS)signals is analyzed.Feature vectors, which can reflect the SRB intensity of stations, are also extracted.SRB intensity is classified according to the solar radio flux, and different class labels correspond to different SRB intensity types.The training samples are composed of feature vectors and their corresponding class labels.Second, training samples are input into SVM classifiers to one-against-one training to obtain the optimal classification models.Finally, the optimal classification model is synthesized into a modified multifactor SVM classifier, which is used to automatically detect the SRB intensity of new data.Experimental results indicate that for historical SRB events, the average accuracy of SRB intensity detection is greater than 90% when the solar incident angle is higher than 20°.Compared with other methods, the proposed method considers many factors with higher accuracy and does not rely on radio telescopes, thereby saving cost.
Key words:global navigation satellite system; solar radio burst; modified multifactor SVM algorithm; detection accuracy
With the wide application of global navigation satellite systems(GNSS)in modern society, the influence of solar radio burst(SRB)on GNSS signals has attracted the extensive attention of scholars.SRBs are intense radio wave emissions, usually related to solar flares[1].Previous studies revealed that the satellite carrier-to-noise ratio(C/N0)decreases, the positioning error and the geometry dilution of precision(GDOP)increase, and the navigation signals are lost to varying degrees during severe SRBs[2].Chen et al.[3]presented that the flux density threshold of SRBs affecting GPS signals is between 4 000 and 12 000 solar flux units(SFU).Huang et al.[4]analyzed the SRB event on December 13, 2006, and found that in this event, the number of satellites locked of multiple stations was less than 4.Berdermann et al.[5], Linty et al.[6], and Sato et al.[7]analyzed the impact of the SRB event on September 6, 2017, following its effects on the ionosphere and the resulting serious problems for precise positioning and GNSS signals.
For mainly relying on manual, the traditional detection and classification of SRBs have a huge workload and low efficiency.In recent years, many methods for automatic detection and classification of SRBs have been proposed.Ma et al.[8]proposed a new SRB classification method on the basis of multimodal deep learning.Chen et al.[9]used the convolution neural network to classify the solar radio spectrum.Singh et al.[10]utilized a novel statistical method to automatically distinguish the dynamic spectrum with or without SRBs.However, this method does not classify the types of SRBs.
At present,certain methods for the automatic detection and classification of SRBs are available; most of them must be realized by radio telescope data.Given that radio telescopes are expensive and sparsely distributed, a real-time and efficient method is urgently needed to detect SRBs without utilizing radio telescopes.Yang et al.[11]proposed an intense L-band SRB detection method without the aid of a radio telescope.This method detects the valley period of theC/N0of multiple satellites and combines it with multiple stations to realize SRB detection.However, the detection feature is single and can only detect SRBs when they are severe.Huang et al.[12]gave the threshold range to define SRB intensity, providing a basis for its classification.However, they did not conduct detection.
In the present study, a method to detect SRB intensity on the basis of a modified multifactor SVM algorithm is proposed.This method detects the multiple effects of SRBs on GNSS signals, includingC/N0, GDOP, horizontal dilution of precision(HDOP), vertical dilution of precision(VDOP), and the number of satellites locked, to detect SRB intensity.To solve the multiple classification problems, a one-against-one method[13]is adopted.Every two types are combined into a binary classifier, and the classification results are obtained by voting statistics.When new data enter the classifier, it will be classified automatically.
The main advantage of this method is that it can classify SRB intensity automatically in real-time, with high efficiency.Compared with the methods proposed in previous research, the current one only uses the previous radio flux data provided by radio telescopes as the classification standard to establish the model.The subsequent classification needs the data provided by GNSS receivers, which do not rely on radio telescopes, thereby saving cost and having strong practicability.In addition, it considers many factors and has high accuracy.
1 Effects of SRBs on GNSS
Taking the SRB event on December 13, 2006, as an example, the effects of SRBs on GNSS signals are analyzed.At 02:14:00, an X3.4 solar X-ray flare erupted.The peak time and end time of the flare were 02:40:00 and 02:57:00 , respectively, lasting for 43 min.The ground-based radio monitoring telescope recorded the whole process of the burst.Fig.1 shows the monitoring results of L-band radio flux(represented by 1 415 MHz)provided by the Radio Solar Telescope Network(RSTN).The sampling frequency was 1 Hz.The maximum peak flux was greater than 1.1×10⁵SFU, which is nearly a thousand times higher than that during the quiet period[4].
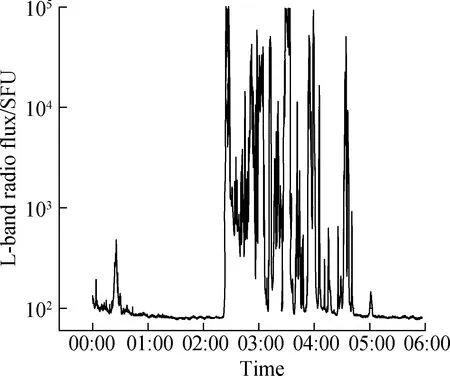
Fig.1 Solar radio flux at 1 415 MHz provided by RSTN on December 13, 2006
To investigate the effects of SRBs on GNSS, the NNOR station is selected as an example for analysis.Fig.2 illustrates the variation ofC/N0at GPS L1 frequency for different satellites at the NNOR station.During the SRBs, theC/N0of GPS satellites locked by the receivers of the NNOR decreased significantly, their change trend was almost identical, and the corresponding relationship with solar radio flux was obvious.The analysis reveals that theC/N0variation trend of other satellites locked at different stations is similar during SRBs.
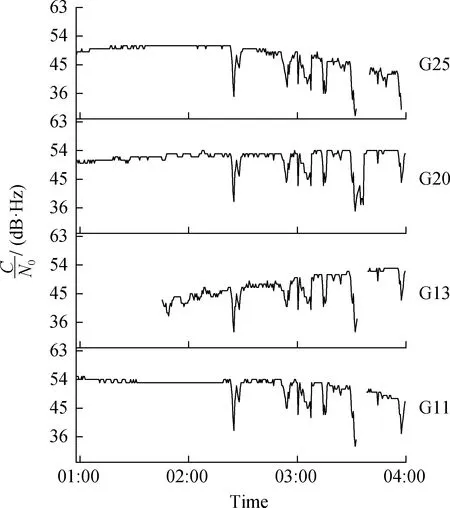
Fig.2 C/N0 at the GPS L1 frequency for the NNOR station during the SRBs that occurred on December 13, 2006
GDOP, HDOP, and VDOP respectively represent the amplification factor of the total positioning timing error, horizontal position error, and vertical position error to the ranging error.The NNOR station is located in a plain area with flat terrain.Considering the obstructions in the signal propagation path, the elevation mask angle is set to 15° to avoid selecting invisible satellites as far as possible[14].
Fig.3 demonstrates that during the SRB event, the GDOP, HDOP, and VDOP of NNOR increased significantly, and the maximum GDOP reached over 30.

Fig.3 GDOP, HDOP, and VDOP variations for the NNOR station during the SRBs that occurred on December 13, 2006
Fig.4 shows that the number of satellites locked at NNOR decreased during SRBs, which mainly occurred at 03:31:00—03:37:00.

Fig.4 Number of satellites locked for the NNOR station during the SRBs that occurred on December 13, 2006
The analysis of several other stations shows that GDOP, HDOP, VDOP, and satellite lock numbers are also affected by SRBs.The above changes provide a basis for the selection of feature vector composition.
2 Methodology
2.1 System schema of SRB intensity detection
The system schema of the proposed method is displayed in Fig.5, which includes training sample acquisition, model training, and SRB intensity detection.

Fig.5 System schema of the SRB intensity detection based on a modified multifactor SVM algorithm
First,C/N0, GDOP, HDOP, VDOP, and the number of satellites locked are extracted.SRB intensity is labeled according to the solar radio flux.The feature vectors and labels are combined to obtain training samples.
On the basis of the fact that SVM is a binary classifier, a one-against-one method is adopted.Samples with different labels are combined in pairs.Then, the SVM binary classification model is trained for each combination to obtain the corresponding optimal classification model.Classification models form the final modified multifactor SVM classifier.
Once the modified multifactor SVM classifier is confirmed, new feature vectors are preprocessed and input into the trained modified multifactor SVM classifier.The classifier automatically inputs the feature vectors into the trained optimal classification models.Each model outputs labels corresponding to the feature vectors.For each feature vector, the most frequent label is its corresponding intensity type by voting.
2.2 Training sample acquisition
Take the average of the currentC/N0of each satellite captured as theC/N0of the station at the current time, recorded asx1, measured in unit dB·Hz.
(1)
wheresiis theC/N0of each satellite captured,i=1,2,…,N.Nis the number of satellites captured.
The GDOP, VDOP, HDOP, and the number of satellites locked at the observation station do not have to be dealt with.Only the original data released by the International GNSS Service(IGS)are used.
The feature vectors are formed as
(2)
wherex1,x2,…,x5represent theC/N0, GDOP, HDOP, VDOP, and the number of satellites locked, respectively.
Tab.1 lists the SRB intensity types, radio flux thresholds, and corresponding labels[12].
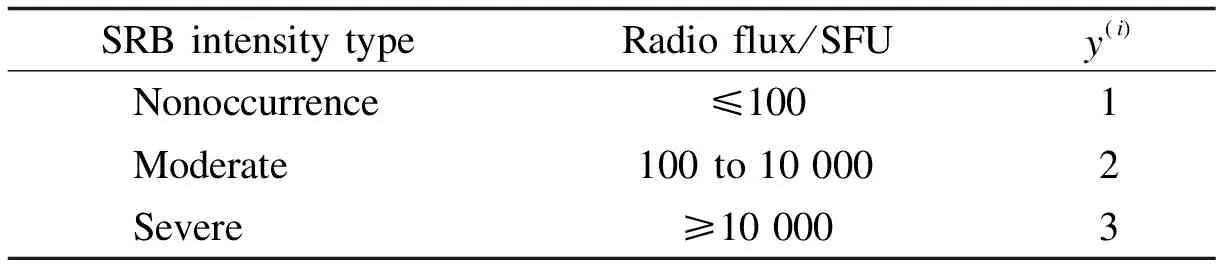
Tab.1 Classification of SRB intensity types
x(i)represents the feature vector of the sample, andy(i)represents the label of the sample,i=1,2,…,n.x(i)and
2.3 Model training
One-against-many and one-against-one methods are the commonly used SVM multiple classification methods.SVM optimization problems in the one-against-many method have high computational complexity and its gaining speed slower than the one-against-one method[13].In this study, SRBs are divided into three types, and no classification overlap occurs.Therefore, the one-against-one method for multiple classification is selected.
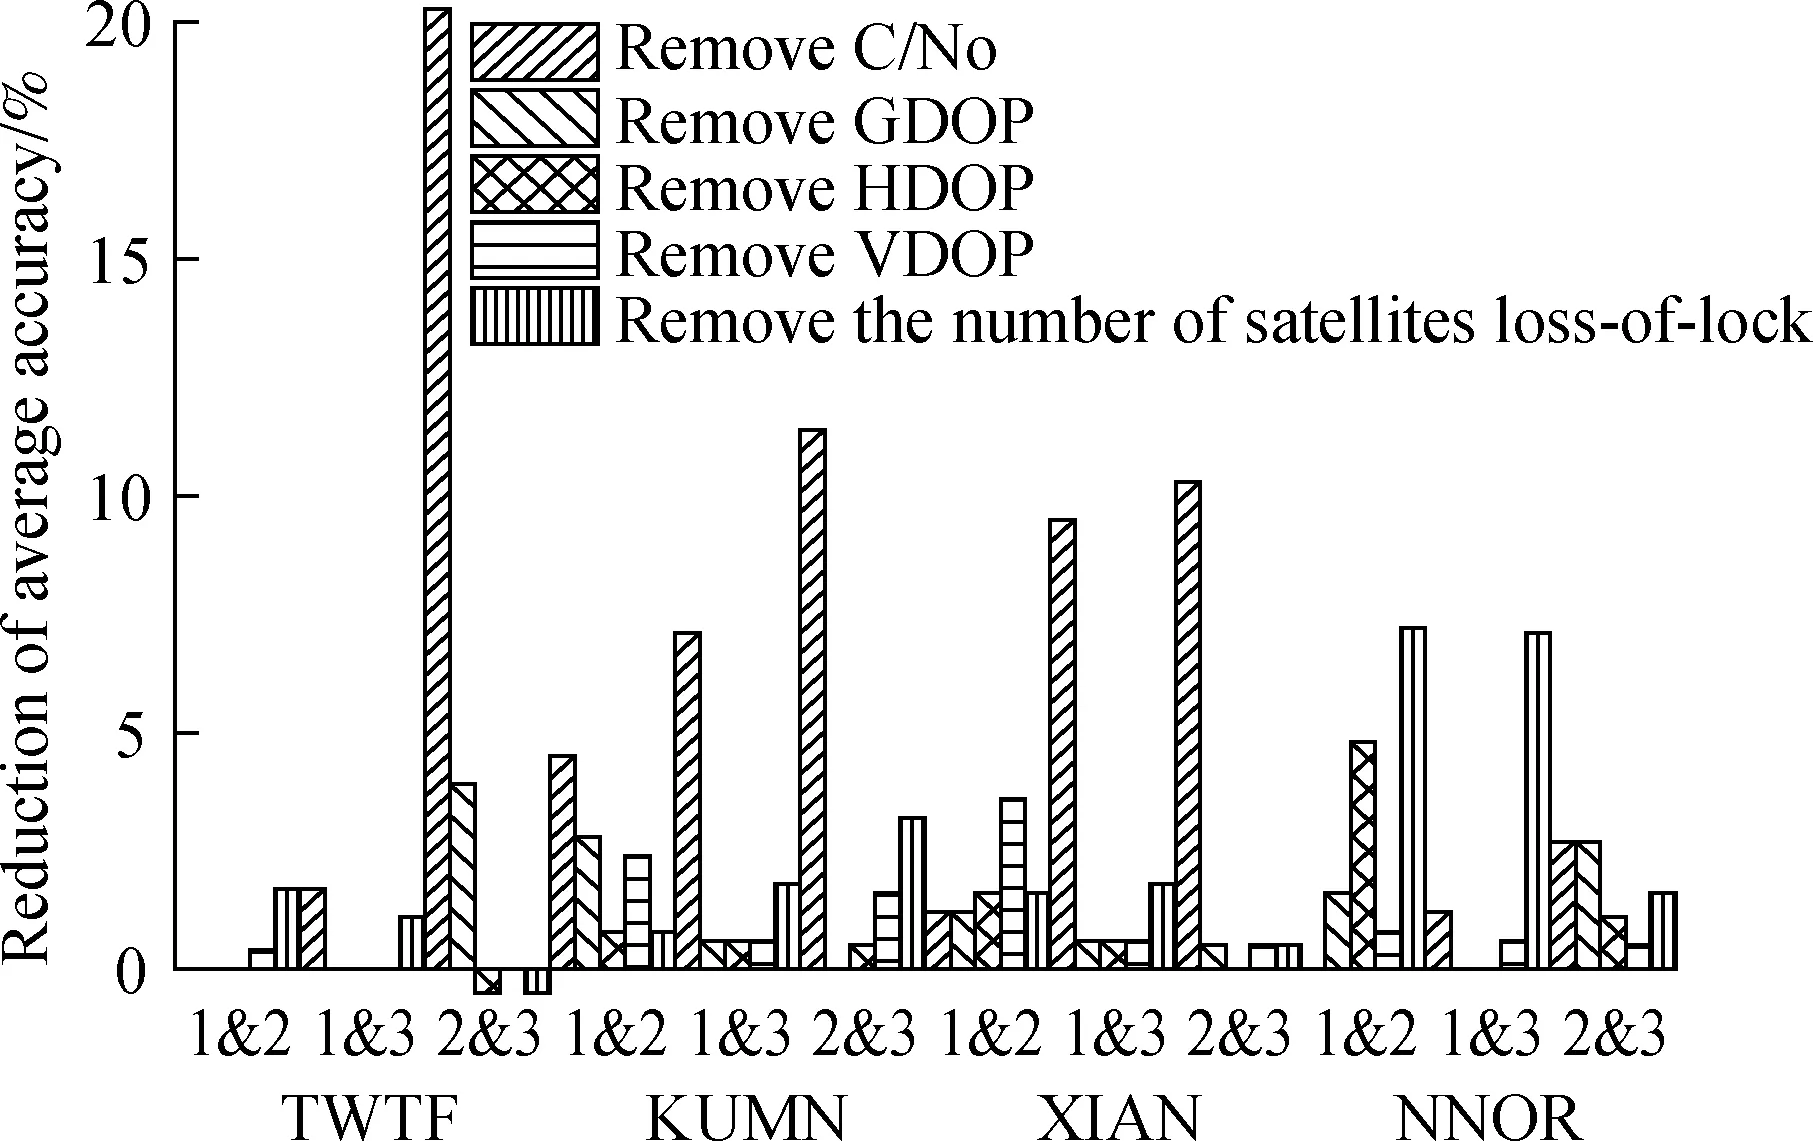
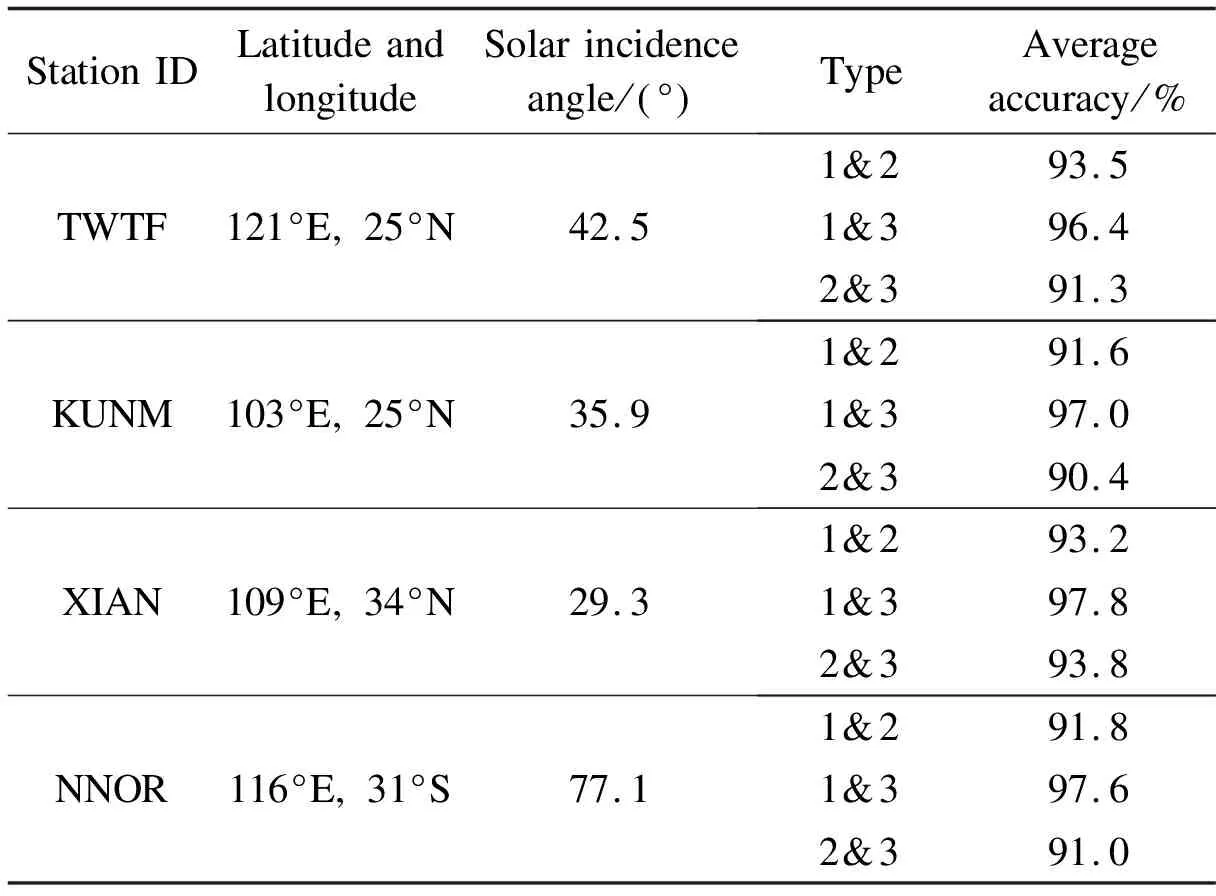
First, suppose that a nonlinear SVM binary classifier is constructed for the training samples with labelsuandv(u,v=1, 2, 3, andu f(x)=wTφ(x)+b (3) wherewTis defined as the normal vector, andbis defined as the intercept of the classification hyperplane.φ(x)is a high-dimensional linear mapping. Second, solve the following optimization problems: (4) s.t.y(i)(wTφ(x(i))+b)≥1-ξi,ξi≥0i=1,2,…,n (5) whereξiis the slack variable of each sample, andCis a hyperparameter. Third, solve the Lagrangian multipliers, (6) (7) whereαi,y(i)are the Lagrangian multipliers and data classification label, respectively,i=1,2,…,n. Furthermore, (8) (9) wherex(s)is the support vector, andy(s)is the corresponding label. Fourth, the calculatedwandbare substituted into the nonlinear SVM classifier model expression. (10) where the kernel function can be expressed ask(x(i),x)=φT(x(i))φ(x).The radial basis function(RBF)is selected as the kernel function.In the absence of prior knowledge of the training samples, as long as the parameters are selected appropriately, SVM with RBF can achieve strong learning ability.RBF is defined as (11) whereσis the kernel parameter. Selectk-fold cross validation, which enables the model to encounter various data through multiple division and training to improve its generalization ability. Select the Gaussian nonlinear SVM classifier model and set parametersC, 1/(2σ2).After training, the average accuracy of these parameter settings is obtained. Change the value of parameters: C=2mm=-5,-4,…,10 By comparing the average accuracy of all parameter settings, parametersCandσwith the maximum accuracy are found as the optimal parameters.The trained model under the optimal parameter setting is the optimal classification model.Three optimal classification models form the final modified multifactor SVM classifier. The feature vectors of the newly observed data are expressed asX={x(1),x(2),…,x(N)}.Nis the total number of samples to be detected. InputXinto the modified multifactor SVM classifier, and the voting strategy is adopted.For each feature vectorx(i), if labelP(P=1,2,3)outputs after an optimal classification model of the modified multifactor SVM classifier completes the work, the number of labelPis added by one.The label that appears the most is the detected type of SRB intensity at that time at the station. Take KUNM as an example.To train the modified multifactor SVM classifier, the data of KUNM at 01:30:00—03:59:30 on December 13, 2006, are selected, includingC/N0, GDOP, HDOP, VDOP, and locked satellites.After data preprocessing and label allocation, the training samples of KUNM are obtained from the IGS Data Center of Wuhan University.The sampling interval is 30 s, and each station has 300 times in total.Tab.2 lists five relatively representative sample points. Tab.2 Sample points corresponding to different times of the KUNM station The training samples are input into the SVM classification learner, cross validation is conducted, and thek-fold number is set tok=5.Through training, three classification models under the optimal parameter setting are obtained.WhenC=8, 1/(2σ2)=1, the classifiers of Types 1 and 2 have the highest average accuracy of 96.8%.WhenC=2, 1/(2σ2)=0.5, the average accuracy of the optimal classifiers of Types 1 and 3 is 98.8%.WhenC=8, 1/(2σ2)=1, the average accuracy of the optimal classifiers of Types 2 and 3 is 94.0%. The confusion matrix and ROC curve of optimal classification models are shown in Fig.6.Each column of the confusion matrix represents the prediction type, whereas each row represents the actual type.As displayed on the left in Figs.6(a)to(c), 94% with Type 1 and 99% of the sample points with Type 2 SRB intensity are detected correctly. (a) The ROC curve reflects the relationship between sensitivity and specificity.The area under the curve(AUC)is used to indicate the detection accuracy.The higher the AUC value(the maximum value is 1)and the closer the curve is to the upper left corner, the higher the prediction accuracy.According to Figs.6(d)to(f), each model has high detection accuracy. To expand data coverage, two additional typical SRBs are analyzed, that is, SRBs on September 24, 2011, and September 6, 2017. For each event, four stations are selected.Tabs.3 to 5 list the station detail and the average accuracy corresponding to the optimal model. As can be seen from Tabs.3 to 5, for three different SRB events, the average accuracy of any classifier at different stations is between 91% and 100%. To simplify the data preprocessing, this study tests whether a higher average accuracy can still be obtained when there were fewer combined feature vectors during the SRBs on December 13, 2006.TheC/N0, GDOP, HDOP, VDOP, and the number of satellites locked of the station are removed. As illustrated in Fig.7, the height of each column is the difference between the average accuracy of the original vectors and that of the vectors with a feature removed.If it is a positive number, then the average accuracy decreases.On the contrary, the average accuracy increases. Fig.7 Difference in average accuracy between original vectors and vectors with any feature removed Tab.3 Average accuracy of different stations during the SRBs on December 13, 2006(detection period 00:00—10:00) Tab.4 Average accuracy of different stations during the SRBs on September 24, 2011(detection period 10:26—21:50) Tab.5 Average accuracy of different stations during the SRBs on September 6, 2017(detection period 05:00—15:21) When the influence ofC/N0or the number of satellites locked is removed, the average accuracy decreases mostly, with a maximum decrease of 20.3%.The average accuracy loss is less than any classifier with one of GDOP, HDOP, and VDOP removed at different stations and can still reach 85%.In sum, when the average accuracy requirement is not strict, one of the GDOP, HDOP, and VDOP can be removed from the feature vectors. Fig.8 demonstrates that the average accuracy of any model is reduced if two of the three less influential feature vectors are removed at the same time. Fig.8 Difference in average accuracy between the original vectors and vectors with two features removed 1)SRB intensity detection based on a modified multifactor SVM algorithm can process a large amount of data simultaneously and detect SRB intensity in multiple stations at the same time. 2)The proposed method not only improves detection reliability, efficiency, and accuracy by considering various factors but also saves cost, as it does not require the use of radio telescopes.Thus, it is expected to be a useful tool in the normal operation of the satellite navigation system. 3)Using the original feature vectors in this study, the average accuracy can reach more than 90%.If the accuracy requirement is not strict, then one of GDOP, HDOP, and VDOP can be removed from the feature vectors.However, two features cannot be removed at the same time, as it can lead to inaccurate detection results.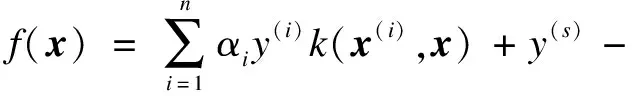


2.4 SRB intensity detection
3 Results and Discussion
3.1 Single station detection process


3.2 Detection results of multiple stations
3.3 Influence of feature vector composition on average accuracy


4 Conclusions
杂志排行

Journal of Southeast University(English Edition)的其它文章
- Statistical analysis of nondestructive testing results of cast steel joints in civil engineering structures
- Novel sensitivity analysis method and dynamics optimization for multiple launch rocket systems
- Metrics analysis of tactile perceptual space based on improved NMDS for leather textures
- Short-term traffic flow prediction with PSR-XGBoost considering chaotic characteristics
- Contract stability and default risk control of pig farming in the company and farmer mode
- Finite rate of innovation sparse sampling for a binary frequency-coded ultrasonic signal