Effects of shrub-grass patterns on soil detachment and hydraulic parameters of slope in the Pisha sandstone area of Inner Mongolia, China
2022-04-17PengChenJianyingGuoTiegangZhang
Peng Chen·Jianying Guo·Tiegang Zhang·
Zhi Dong1,2·Hongli Li1,2·Suqian Qiu1,2·Xiaoxue Chen1,2
Abstract The characteristics of soil holding capacity for different shrub-grass patterns are important to research the mechanisms regulating vegetation on slopes. The objective of this study was to describe the characteristics and mechanisms of soil erosion and hydraulic parameters under different vegetation patterns in the Pisha sandstone area of Inner Mongolia on lands of 8° slope gradient. We carried out field scouring experiments on five different shrub-grass patterns as treatments, viz no shrubs (GL), shrubs on the upper part of the slope (SU), middle part of the slope (SM) and lower part of the slope (SL). We designated bare slope (BL) as the control. We employed three different water flow rates (15, 20, 30 L·min-1). Our results showed that the contribution of plant root systems to slope sediment reduction ranged from 64 to 84%. The root systems proved to be the main contributing factor to reduction of erosion by vegetation. The relationship between soil detachment rate, stream flow power, and flow unit stream power under different scouring discharge rates showed that soil detachment declined in rank order as: BL > GL > SU > SM > SL. The SL pattern had the lowest soil detachment rate (0.098 g·m-2·s-1), flow stream power (2.371 W·m-2), flow unit stream power (0.165 m·s-1) and flow shear stress (16.986 Pa), and proved to be the best erosion combating pattern. The results of decision coefficient and path analysis showed that stream power was the most important hydraulic parameter for describing soil detachment rate. The combination of stream power and shear stress, namely Dr = 0.1ω -0.03τ -0.56 (R2 = 0.924), most accurately simulated the soil detachment characteristics on slopes. Our study suggests that the risk of soil erosion can be reduced by planting shrub-grass mixes on these slopes. Under the conditions of limited water resources and economy, the benefit of sediment reduction can be maximized by planting shrubbery on the lower parts of slopes.
Keyword Vegetation pattern·Soil detachment rate·Hydraulic parameters·Soil erosion·Caragana korshinskii
Introduction
The process of soil detachment caused by raindrop splash and water runoff is the key to soil erosion and landscape evolution (Defersha et al. 2011; Li et al. 2019). Understanding soil erosion characteristics under different conditions is a prerequisite to useful soil erosion research directed at avoidance of soil erosion risk. Numerous studies reported that hydraulic parameters of overland runoff, such as flow velocity, flow discharge, shear stress and stream power, significantly affect the process of soil detachment (Nearing et al. 1990; Govers et al. 2007). Among these factors, flow power, unit flow power and shear stress are important parameters for discussing flow energy and dynamic characteristics and are most widely used to research the process of soil erosion and the dynamic mechanisms of water erosion (Hairsine and Rose 1992; Morgan et al. 1998; Wagenbrenner et al. 2010). Debate remains, however, over which of these hydraulic parameters is most useful in simulation of the process of soil detachment. Govers et al. (2007) considered that shear stress most accurately simulated soil detachment rate. In contrast, Zhang et al. (2015) found that stream power exerted the greater effect. Therefore, the selection of optimal hydraulic parameters under different slope conditions needs further study.
The role of vegetation in water conservation and soil erodibility reduction is clear (García-Ruiz 2010; Fiener et al. 2011; Schwarz et al. 2015). The entanglement of roots with soil and the cementation of its secretions to soil particles plays important roles in retaining soil and improving the stability of soil surface (Knapen et al. 2007a; De Baets et al. 2006). Furthermore, Roots reduce soil detachment capacity by increasing soil organic matter, which promoted the formation of water-stable aggregates and enhanced surface roughness, hence improved soil resistance to water erosion (Demenois et al. 2017; Knapen et al. 2007b). However, plant growth is hindered by limited water carrying capacity of arid and semi-arid areas (Fu et al. 2003), and the effectiveness of vegetation in reducing soil erosion is seriously challenged by poor coverage. Under this situation, researchers began to explore vegetation collocation and pattern measures based on low coverage conditions that could effectively reduce water and soil erosion. Zhang et al. (2019) studied how different vegetation communities affected soil resistance to water erosion and reported that herbs reduced sediment loss more than shrubs on China’s loess plateau. This contrasted the results of Wei et al. (2014). The difference between the two studies was probably due to differing vegetation patterns caused by limited water resources. Wei et al. (2014) studied the soil retention benefits of different vegetation patterns and reported that the soil retention effect of vegetation was positively correlated with the distance between vegetation cover and the top of the slope. Similar conclusions were reached by Zhang et al. (2018). Li et al. (2018) reported that the root system is the main component of vegetation cover that contributes to reducing soil detachment rates. In many studies, researchers used other indicators as substitutes for root systems, such as surface vegetation coverage, biomass, and established soil erosion models (Gyssels and Poesen 2003). However, subsequent studies have found that this approach significantly underestimates the contribution of root systems (Gyssels et al. 2005). Thus, the study of the role of root systems in soil retention has become a focus of soil erosion research (Gyssels and Poesen 2003; Wang et al. 2018; Zhang et al. 2019). Herbaceous vegetation has most often been studied to quantify the impacts of vegetation on soil erosion (Zhao et al. 2013; Mu et al. 2019). The effects of shrub patches on runoff reduction and sediment yield have been extensively reported in arid regions (Du et al. 2013; Wang et al. 2018; Lu et al. 2019), but to date, few studies have linked shrub-grass patterns to runoff hydrological processes (Mayor et al. 2011; Wei et al. 2014). In particular, the contribution of the different parts of plant to reducing soil erosion under different shrub-grass patterns needs further study. Within China, such research is concentrated on the Loess Plateau. But conditions differ on the Pisha sandstone of Inner Mongolia where water is more limited and soil erosion is more severe (Yang et al. 2014; Chen et al. 2019, 2020). For these reasons, the Loess Plateau research findings are often not directly applicable to the Pisha region. Therefore, we studied the relationships between vegetation cover and soil erosion on the Pisha sandstone.
We studied four typical shrub-grass patterns on sandstone slopes, i.e., grass slopes without shrubs (GL), and shrub cover on the upper (SU), middle (SM), and lower slope (SL). We designated bare slope (BL) as our control. We studied soil erosion under varying conditions of scouring and hydrodynamic parameters. We aimed to describe the characteristics and mechanisms of soil detachment capacity under different shrub-grass vegetation cover patterns. Our goal was to develop scientific theory and technical bases for the use of vegetation to combat and control slope soil erosion in the Pisha sandstone area.
Materials and methods
Experimental conditions
The study was conducted at Hetonggou, a small watershed on the Ordos plateau of Inner Mongolia, China (N39°59′58″ to 40°13′18″, E109°53′36″ to 110°06′53″). We focused on a typical exposed Pisha sandstone region at the soil and water conservation monitoring station at Dalad Banner. The watershed was characterized by interlaced hills and gullies with loose lithological structure and poor vegetation cover. The hilly plateau surfaces were relatively gentle with gradients from 5° to 15°, but severe sheet and rill erosion processes were widespread on these slopes. The soil texture was mainly sandy soil, and the soil type was chestnut soil. The regional climate is temperate semi-arid continental with mean annual precipitation of 310.3 mm. More than 71.2% of the precipitation falls in the rainy season (from July to September) when short torrential storms frequently occur. The maximum rainfall intensity can reach 223 mm·h-1, which causes mountain torrents.Stipa bungeanaandLeymus chinensiswere the main flora species in the watershed.Caragana korshinskii,Pinus tabuliformis,andHippophae rhamnoideswere the main water conservation tree species, and the planting area ofC. korshinskiion the slopes was the largest.
Experimental design
After surveying the small watershed of the Hetonggou from April to May 2018, we selected a site of average slope gradient of 8 degrees as our test slope. According to the actual rainfall recorded by the meteorological station of Dalad banner from 1960 to 2016, the flow discharge rates were set to be 15, 20 and 30 L·min-1, which were equal to 1.5, 2.0 and 3.0 mm·min-1, respectively. According to the heterogeneous distribution pattern ofC. korshinskiion slopes in the watershed, five runoff plot types of different vegetation patterns, viz grassland slope without shrubs (pattern GL), shrubs on the upper slope (pattern SU), on the middle slope (pattern SM), and on the lower slope (pattern SL) respectively, were selected as test sites, and bare land slopes (pattern BL) were used as control (Fig. 1b). To study the influence of vegetation roots on the characteristics of slope erosion, two runoff plot models were set up for each of the above four shrub grass patterns, i.e., the runoff plot with total plant (referred to as TL) and the runoff plot with only root system after cutting off the surface vegetation (referred to as RS). After three months of natural subsidence, the runoff plots basically restored to their original state (Table 1).
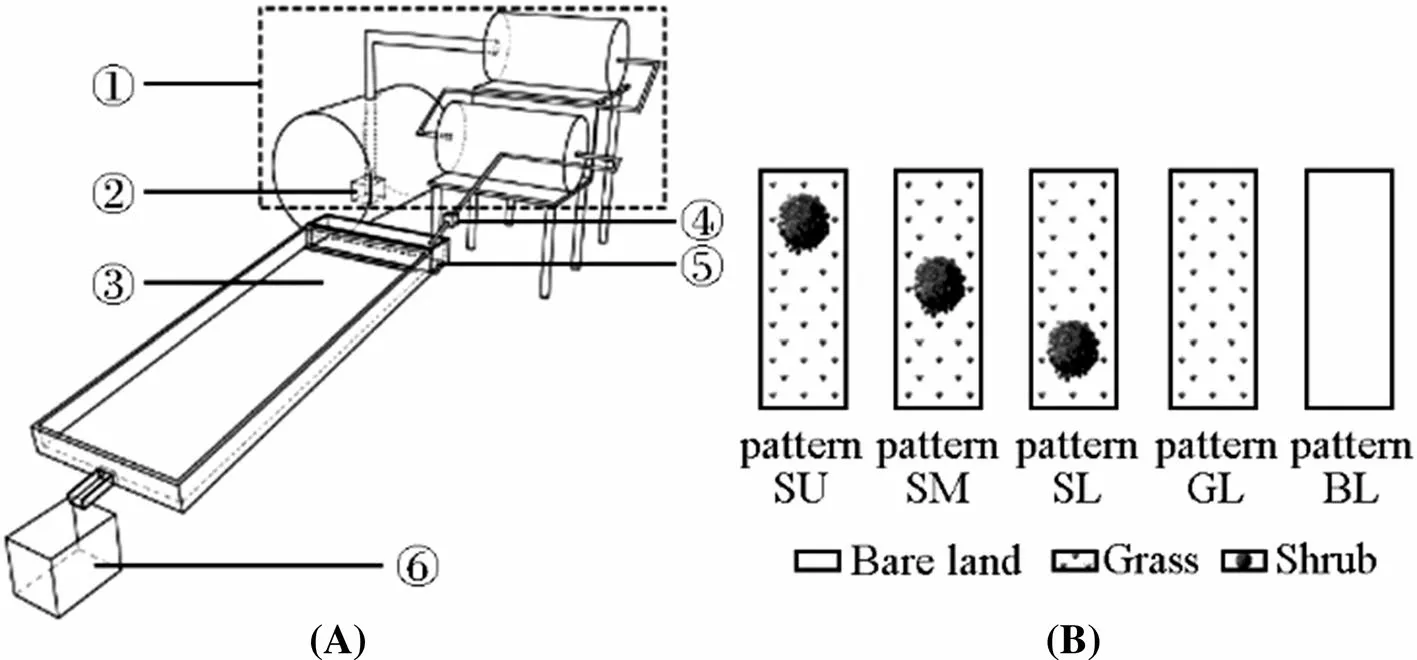
Fig. 1 The experimental device (a) and different vegetation patterns (b). a is experimental device, b is schematic of different shrub-grass patterns on the slope. In Fig. 1a, (1) is water supply stabilizing device; (2) is pump; (3) is runoff plot; (4) is flow meter; (5) is steel overflow tank; (6) is runoff collection device
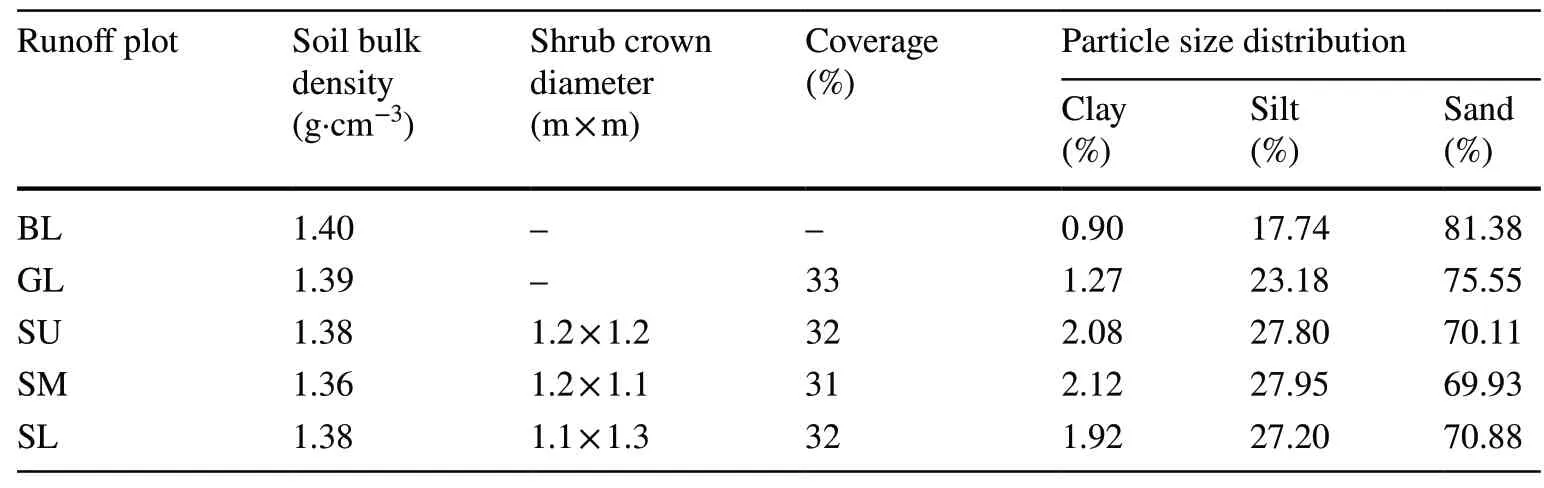
Table 1 Basic state of runoff plots
The experimental device in this study (Fig. 1a) included a water supply stabilization device, steel overflow trough, runoff plot and runoff collection device. The runoff plot was 5 m long and 2 m wide. The steel overflow tank was 2 m long, 0.5 m wide, and 0.3 m deep. The flow stabilizer and overflow tank were connected with PVC pipes. The flow rate was controlled by valves installed on PVC pipe and was measured directly using a calibrated flow meter. Before the test, the overflow tank was adjusted by the level, and a steel plate, 2.0 m long × 0.2 m wide, was placed at the top the runoff plot. We pumped the tap water into the flow stabilization device to eliminate the disturbance of runoff and to ensure that the water flowed smoothly and evenly into the runoff plot at low kinetic energy. When the water flow entered the runoff collection device, we started timing of the test. Runoff samples were collected once a minute after the onset of runoff, after 10 min of runoff, runoff samples were collected once in 5 min, and flow velocity, depth and width were also measured. The depth and width of the flow was measured with a ruler with an accuracy of 1 mm. The velocity of the water flow was assessed by a dye tracing method in which the velocity of the leading edge of the dye was multiplied by a correction factor of 0.8 to obtain the mean flow velocity (Li et al. 2019). The shrub crown diameter was measured by measuring the east-west and north-south diameters with a ruler and averaged. The soil bulk density was determined with a ring knife method, and soil moisture content was determined by TDR. The composition of soil particles was determined with Marvin laser particle size meter 2000. The duration of each test was 60 min. After settling of the turbid water, the volume of clear water was regarded as the runoff amount. The weight of the soil in the bucket after oven drying was taken as the sediment yield. The experiment involved running the scouring test with 15, 20, 30 L·min-1flow discharge rates in the runoff plots of total plants.
In order to minimize test error at each test interval (1 week), the soil moisture content was measured before the test to ensure that the soil moisture conditions were basically the same. Three replications were undertaken for a scouring event in each combination of scouring flow discharge and vegetation pattern, and a total of 81 scouring events were simulated.
Measurements and methods
Hydraulic parameter
Shear stress (τ), stream power (ω), unit stream power (P) and soil detachment rate (Dr) were calculated using the following equations (Wang et al. 2019):
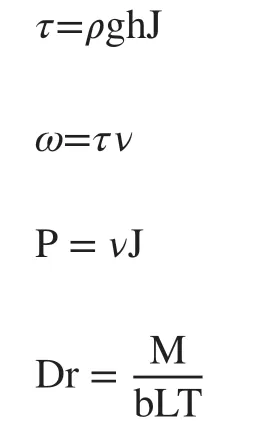
whereτ,ωandPare the shear stress (Pa), stream power (W·m-2), unit stream power (m·s-1) of the rill flow, respectively;Dris the soil detachment rate (g·m-2·s-1);ρis the water mass density (kg·m-3),gthe gravitational acceleration(g·m-1),hthe flow depth (m),Jthe hydraulic slope,vthe mean flow velocity(m·s-1),Mthe sediment yield of the scouring time (g),bthe mean flow width (m),Lthe slope length (m), andTis the sampling interval (s). In this study, sine of the flume slope gradient (m·m-1) was used instead ofJ.
Sediment reduction benefit
The effect of wind and water erosion has resulted in very low litter content on the surface of the region. Therefore, the effect of litter layer on runoff process was not considered in this study. We assumed that after removing vegetation from slope surfaces, only the remaining root systems regulated soil erosion process.
Two metrics, i.e., sediment reduction benefit (SRB, %) and rate of contribution (CR, %) were employed to represent the capacity and contribution of the different treatments to regulate sediments. The calculation of each metric was as follows (Li et al. 2018):

where,iis different patterns and treatment;randpare the root and total plant slope, respectively;SbandSjare the sediment yield rate (g·m-2·min-1) for the bare slope and vegetated slope, respectively;SRBiandCRrare the sediment reduction benefits of different treatments and contribution rate of root system to slope sediment reduction, respectively.SRBrandSRBpare the sediment reduction benefits of total plants and root, respectively.
Data analysis
The results are expressed as means. The differences in sediment and hydraulic parameter characteristics among the different treatments were compared by using one-way analysis of variance (ANOVA). Statistical significance was evaluated at the 0.05 level. All statistical analyses were performed using the software program SPSS 24.0 (SPSS Inc., Chicago, IL, USA), and figures were drawn using Origin Pro 2017 (Origin Lab Corp., Northampton, Ma, USA). Based on the path analysis of hydraulic parameters, the optimal regression equation was obtained by selecting the optimal influencing factors of soil detachment rate through direct path coefficient and indirect path coefficient.
Results
Characteristics of soil detachment and sediment reduction benefits of different shrub-grass patterns
Sediment production processes of each runoff plot differed significantly by flow rate (Fig. 2). Sediment production rate was positively correlated with flow discharge in each runoff plot, and the initial sediment production rate fluctuated greatly. With increasing scouring time, sediment production rates gradually decreased and tended to stabilize. Shrub-grass pattern significantly affected sediment production rates. Under the 30L·min-1flow discharge, the average sediment production rate of shrub-grass patterns was 57 g·min-1, 59% less than on pattern BL. The soil detachment rate increased with increasing of flow discharge for each runoff plot, consistent with sediment production rate. Under 15, 20 and 30 L·min-1flow discharge, the average soil detachment rates of bare-land plots were 0.277, 0.412, and 0.469 g·m-2·s-1, which were 2.70, 2.37, and 1.95 times that of the shrub-grass plots. Sediment reduction benefits differed by shrub-grass pattern (Table 2). At 15, 20 or 30 L·min-1flow rate, the sediment reduction benefit of pattern SL was optimal, with average sediment reduction rate of 83%, which was increased by 194%, 122% and 111% compared with patterns GL, SU and SM, respectively. Soil erodibility was significantly decreased by shrubs, and the sediment reduction benefit by shrub-grass pattern decreased as follows: SL > SM > SU > GL.

Fig. 2 Sediment yield characteristics of vegetation and root system under different shrub patterns. (TL means total plant slope, RS means only root slope. The column chart means soil erosion detachment of different vegetation patterns, and line chart drawn by dashed lines means the sediment yield rate of the root slope; Error bars represent the standard error of the means of soil detachment rate at different shrub-grass patterns, the same below)
After removal of surface vegetation, the initial sediment production time of each runoff plot was advanced, and sediment production and soil detachment rates were both increased (Table 2). With increasing scouring flow rate, the sediment reduction rate of roots in different shrubgrass patterns showed a trend of decline or fluctuating decline. Root system was the main contributing factor to reduction of soil detachment, and the presence of shrubs significantly increased the contribution of root systems to soil retention. At 15, 20 and 30L·min-1flow rates, the average contribution of root systems to sediment reduction were 64% - 82% under different shrub-grass patterns. Among these, the average contribution of root systems on SL, SM and SU patterns was 78%, an increase of 17% over GL.
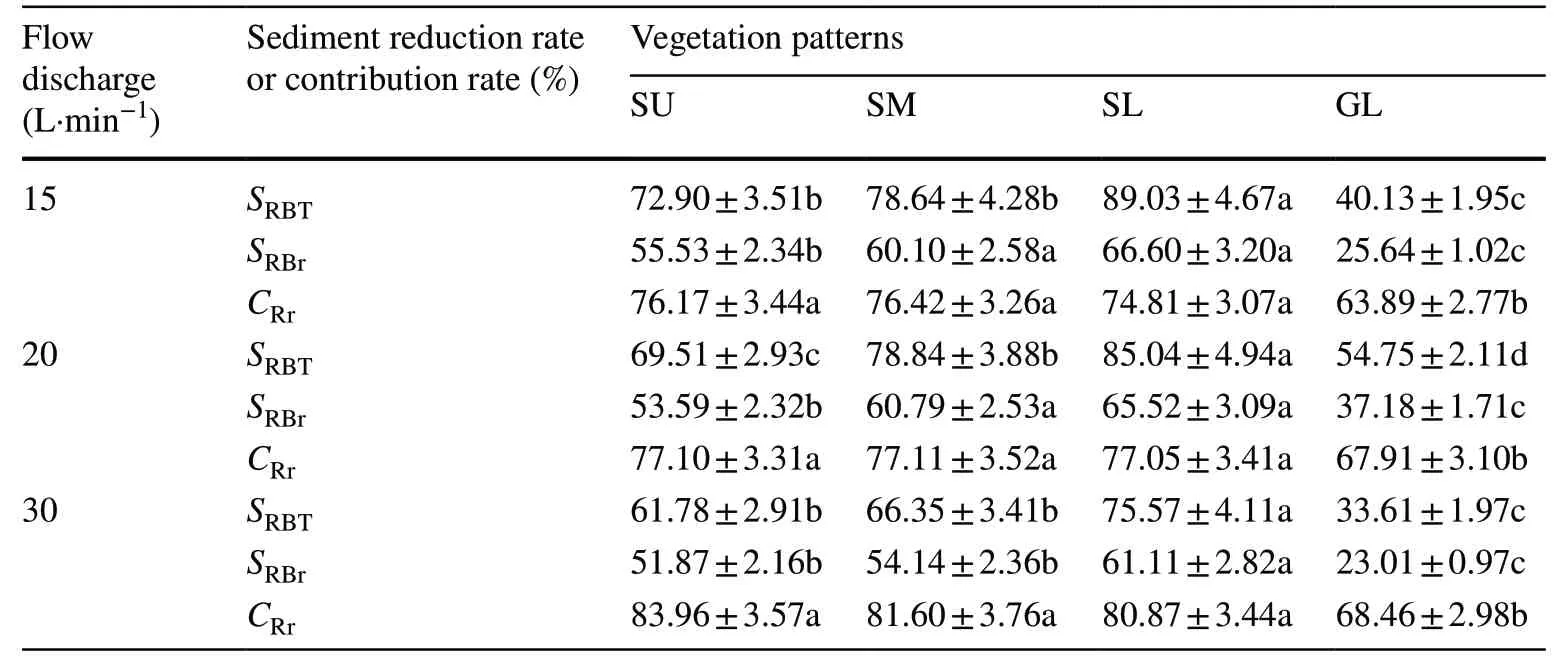
Table 2 The Sediment reduction benefit (%) of different vegetation part under different shrub-grass patterns
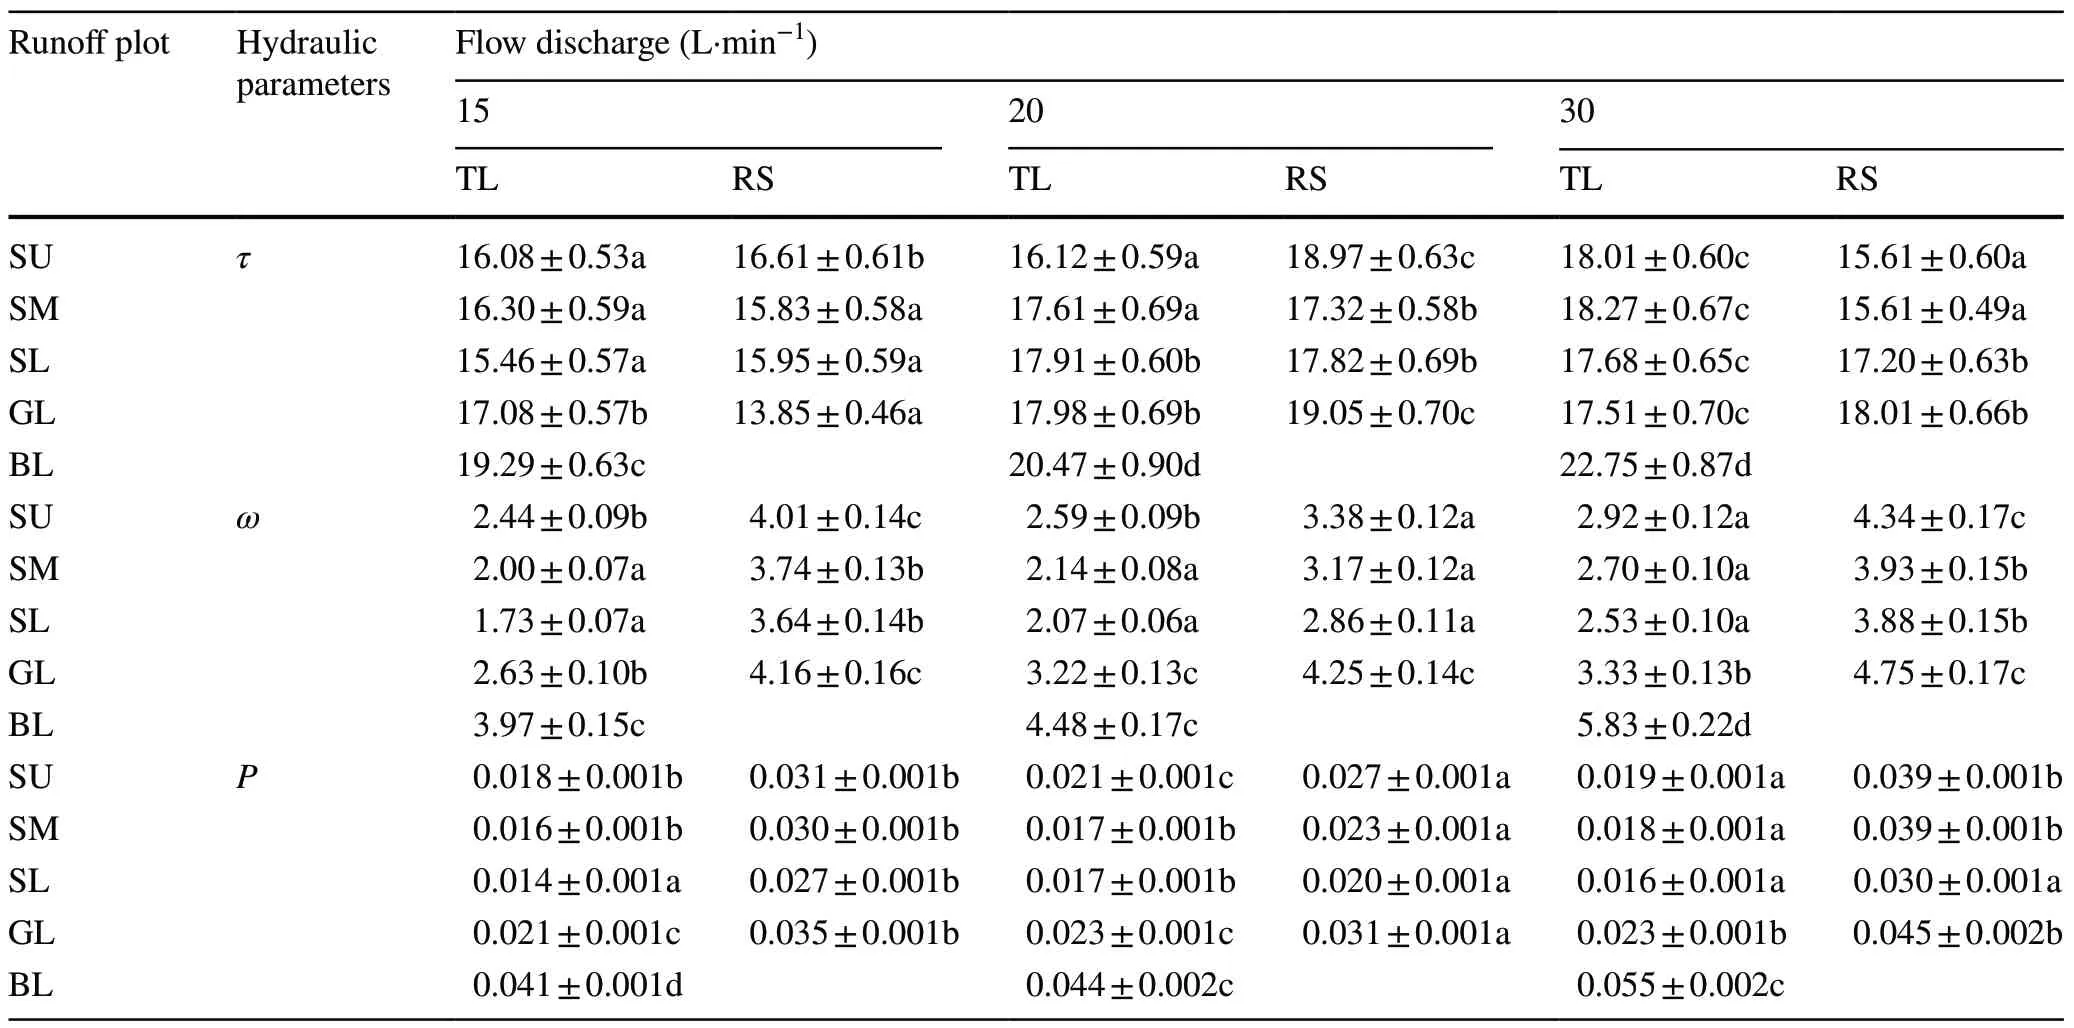
Table 3 Hydraulic parameters of different shrub-grass patterns
Characteristics of hydraulic parameters of differentshrub-grass patterns
Shear stress, stream power and unit stream power of each runoff plot differed by flow discharge rate (Table 3). Among these parameters, stream power, unit stream power, and flow discharge were positively correlated, but the trend of shear stress was not obvious. Average shear stress, stream power and unit stream power of different shrubgrass patterns were 17.46 Pa, 2.83 W·m-2and 0.02 m·s-1, respectively, which were 81%, 59%, and 44% of the bare pattern. Stream power and unit stream power of different shrub-grass patterns declined as: GL > SU > SM > SL. After surface vegetation removal, stream power and unit stream power of different shrub-grass patterns increased, and ranges of increase expanded at greater flow discharge rates. Taking unit flow power as an example, average unit stream power was about 1.14 times of the total plant slope at 15 L·min-1flow discharge, while the unit stream power at 20 and 30 L·min-1flow rates increased sharply to more than 1.50 times that of the total plant slope.
The relationships of soil detachment rates with shear stress, stream power, and unit stream power are shown in Fig. 3. Regression analysis showed that the linear equation or power function equation of hydraulic parameters yielded useful estimates of soil detachment rates. The soil detachment rates increased with increasing shear stress (Fig. 3a), stream power (Fig. 3b), and unit stream power (Fig. 3c) for different vegetation patterns. The data points of the flow stream power were more closely distributed near the fitted line, followed by those of the unit stream power and shear stress.
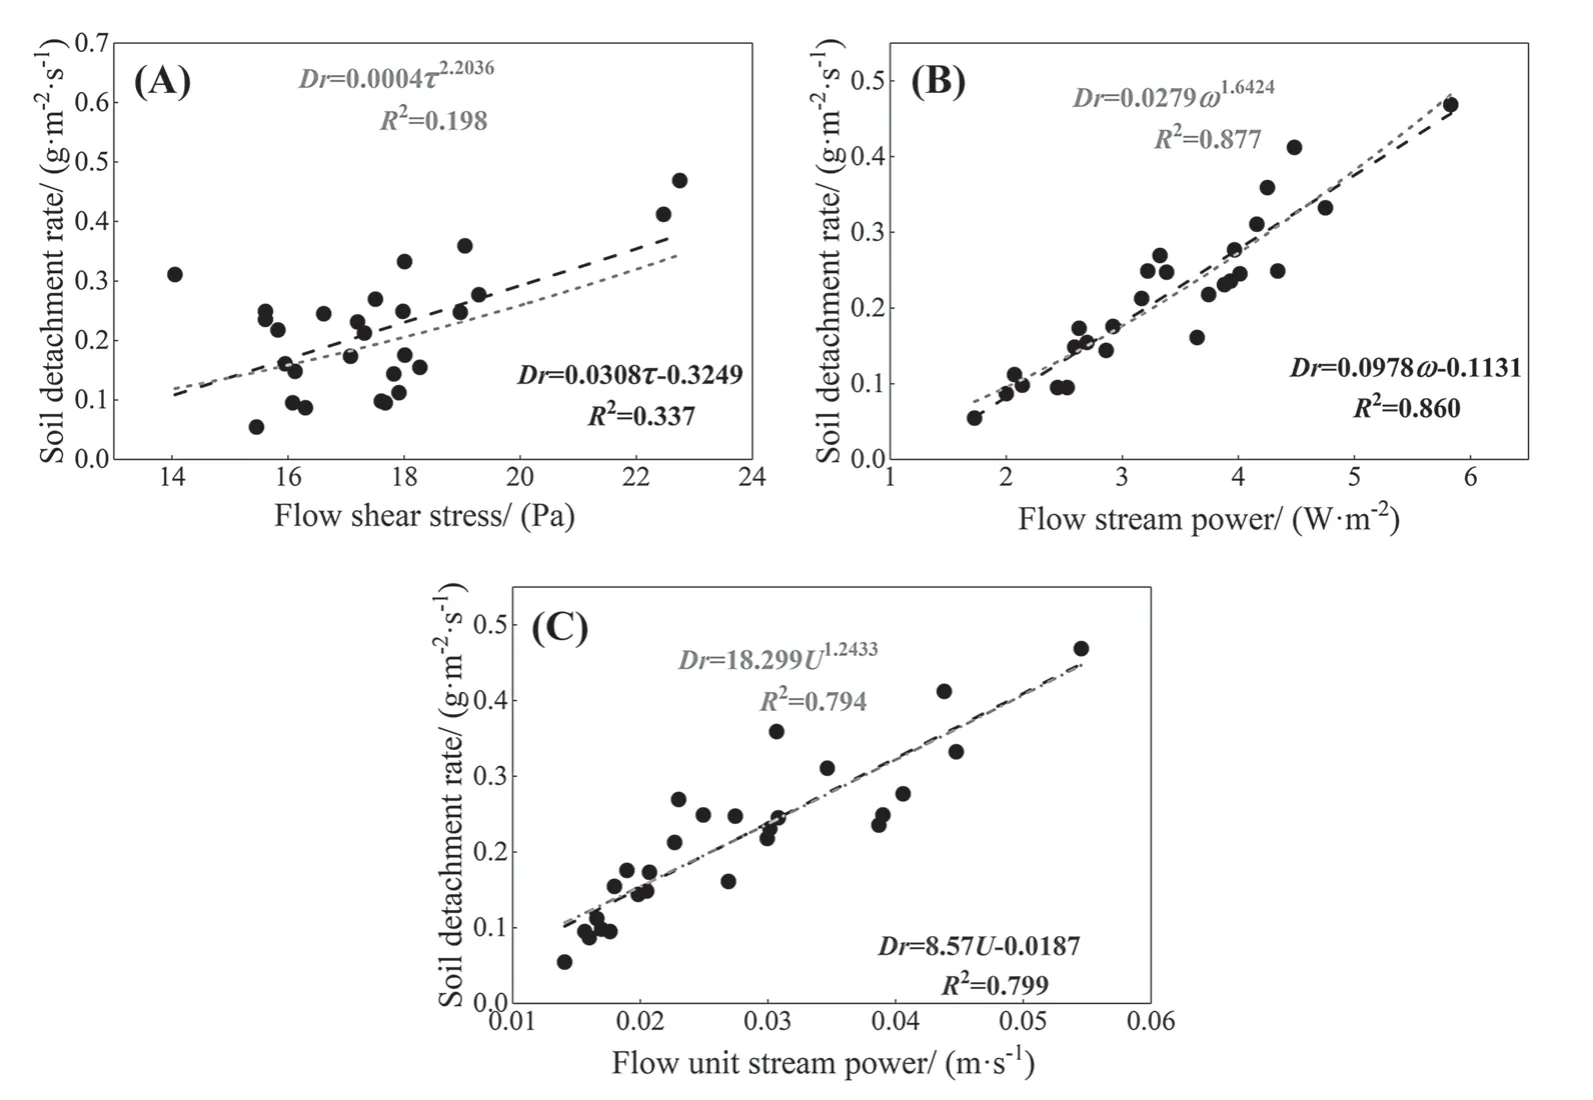
Fig. 3 The relationship between soil denudation rate and shear stress a, stream power(b) and unit stream power c
The linear equation or power equations of the stream power and unit stream power for different shrub -grass patterns were both efficient in predicting soil detachment rates. However, compared with the R2(coefficient of determination) of the two equations, the power equation of stream power and unit stream power proved better for describing soil detachment rate (R2= 0.877 and 0.799, n = 27). Although its coefficient of determination was lower (R2= 0.337, n = 27), critical soil detachment rate with shear stress followed a linear equation. Therefore, from the perspective of the decision coefficient, the power function of flow stream power proved to be the best regression equation to predict the soil detachment rate.
The relationship between hydraulic parameters and soil detachment rate
The variance inflation factors (VIFs) of the stream power and unit stream power were validated by high values (> 10), indicating strong collinearity between the two parameters, so unit flow power was screened in path analysis. Stream power significantly correlated with soil detachment rate, and the addition of the shear stress greatly improved the accuracy of the regression model (R2= 0.924) (Table 4). ModelDr= 0.1ω -0.03τ -0.56, more thoroughly addressed the parameters affecting soil detachment rate while yielding the smallest residual coefficient asmodel 2 (Table 4) proved most efficient for estimating soil detachment rate.
The direct and indirect path coefficients of stream power and shear stress on soil detachment rate were both positive (Table 5). The contributions of stream power and shear stress to soil detachment rate were 63% and 37%, respectively. The direct effect of stream power on soil detachment rate was greatest (0.682), while the indirect effect of shear stress on soil detachment rate was greatest (0.380).
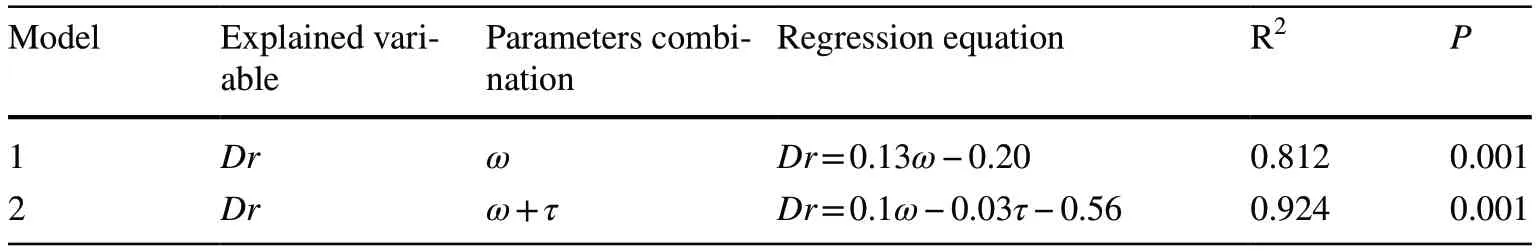
Table 4 Stepwise regression of the Soil detachment rate and hydraulic parameters
Relationship between root mass density and soildetachment rate
Soil detachment rate was negatively correlated with root mass density (P< 0.01). With increasing root mass density, soil detachment rates declined significantly (Fig. 4). The determination coefficient of the fitting function of root mass density (RMD) and soil detachment rate was greater than 0.93. The exponential function R2of root mass density was 0.937, while the linear function R2was 0.961. Therefore, the linear functionDr= 0.114RMD + 0.389 proved best to simulate their relationship.
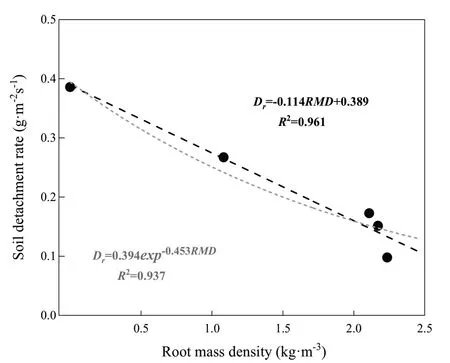
Fig. 4 Relationship between root mass density and soil detachment rate
Discussion
Effects of different shrub-grass patterns on soil detachment rate and Sediment reduction benefit
Compared with bare land, the average soil detachment rate of grass slopes (without shrubs, i.e., pattern GL) decreased by 31%, while that of shrub slope (i.e., patterns SU, SM and SL) decreased by 64%, which shows that shrub-grass combination patterns proved most effective in preventing soil detachment in study region. However our results differ from those of Zhang et al. (2019), who showed that grassland exceeded shrub-grassland in its capacity to combat soil detachment. The different results could be caused by the more developed root structure of shrub grassland than that of grassland under the test conditions of this study. Previous studies reported that soil detachment rates decreased significantly with the increase of RMD (Gyssels et al. 2006; Zhang et al. 2019), consistent with the results of our study. This indicates that plant roots can significantly affect soil retention (Mamo and Bubenzer 2001a; Yu et al. 2014). In addition, our study was located in a wind-water erosion crisscross region, and in this special erosion environment, the area where the shrub patches are located had formed soil mounds (Ravi et al. 2010) that might have reduced the flow regime, thus weakening the erosion effect of water flow on the slope surface as reported by Du et al. (2013) and Lu et al. (2019).
The characteristics of sediment reduction on different shrub-grass patterns varied widely. Under different flow rates, the reductions in soil detachment and sedimentation on the SL pattern were optimum. In terms of reduced sedimentation, the average benefit of pattern SL exceeded 83%, 8.6%, and 15.2% higher than on patterns SM and SU, respectively. The results suggest that shrubs on the lower slope yielded greater sediment retention than did shrubs located on the middle and upper slopes. This is due to the fact that erosion caused by water flow is concentrated in most of the area from the lower part of the upper slope to the upper part of the lower slope (Cerdà 1998; Zhang et al. 2018). Therefore, the shrub under the pattern SL and SM can form a more efficient protection for critical areas of slope erosion compared to the SU pattern.
Relationship between hydraulic parameters and soil detachment rate under different shrub-grass patterns
We found that soil detachment rates were positively correlated with stream power, unit stream power and shear stress, as reported by Wang et al. (2018). Our correlation of stream power and unit stream power with soil detachment rate could be described with the power function (R2= 0.877, 0.799), while the relation between the shear stress and soil detachment rate could be expressed as a linear function (R2= 0.337). This result does not entirely corroborate previous studies (Wang et al. 2018, 2019). In this study, stream power was the best hydraulic parameter for predicting soil detachment rates as reported by Zhang et al. (2015) and Wang et al. (2019). In contrast, McIsaac et al. (1992) concluded that unit stream power is the best hydraulic parameter for predictor of soil detachment rate. Wang et al. (2019) considered that variations in research conditions may lead to differences in the evaluation results of optimal hydraulic parameters. For this study, shear stress in the simplified formula is a function of flow depth and slope.
Results of path analysis showed that stream power was the best hydraulic parameter for predicting soil detachment rates, consistent with the results of stepwise regression analysis. Stream power and shear stress made the best combination of hydraulic parameters for predicting soil detachment rate. Bivariate linear functions composed of stream power and shear stress as independent variables better predicted soil detachment rates (R2= 0.924,P< 0.01). Although regression analysis showed that the effect of shear stress on predicting soil detachment rates was not satisfactory, path analysis showed that the indirect path coefficient of shear stress on soil detachment rate reached 0.380, basically the same as its direct path coefficient. Thus, shear stress proved to be an important hydraulic parameter affecting soil detachment capacity. This indicates that the indirect effect of shear stress on soil detachment rate should not be neglected when studying water erosion of slopes.
Effect of root system on soil detachment capacity
Our study found that the average sediment reduction rate of root systems under different shrub-grass patterns reached 51%, compared with bare land (pattern BL), and the average relative contribution rate of plant root system sediment reduction ranged from 63.89% to 83.96%. This corroborates reports of Wang et al. (2015) and Mamo and Bubenzer (2001a, b) that the root systems of plants proved to be the main agent reducing soil erodibility. The pattern of shrubgrass distribution also influenced reduction of sedimentation by roots. The average rate of root sediment reduction in pattern SL was 64%, while that in SM and SU patterns were 58% and 54%, respectively. This suggests that a certain number of shrubs planted on any slope location in the study area can effectively improve the erosion resistance of slope soils, and it is also conducive to improving the contribution rate of root system to sediment reduction. Moreover, even if the surface vegetation is seriously damaged by external disturbance, the root system can effectively control soil erosion (particularly shrubs are located at the lower part of the slope). However, the distribution pattern of shrubs in different parts of the slope has a profound influence on the effect of reducing sediment in the whole plant and its root system, and the sediment reduction rate under three distribution patterns decreased as follows: pattern SL > pattern SM > pattern SU. Therefore, for the study area, the risk of soil erosion can be reduced by planting shrub belt on the slope. Especially, under the condition of limited water resources and economy, the way of planting shrubs on the lower part of the slope can maximize the benefit of sediment reduction.
Conclusions
Patterns of vegetation affected the hydraulics parameters of flow on slope surfaces, thus leading to the difference in soil erosion characteristics. Plant root systems were the main agents reducing soil erosion. Stream flow power proved to be the best hydraulic parameter to describe soil detachment rate. The bivariate linear functionDr= 0.1ω -0.03τ -0.56 (R2= 0.924), composed of stream power and shear stress, better predicted soil detachment characteristics. Shrubs significantly reduced soil erodibility and increased the contribution of root systems to sediment reduction. We ranked the effects of different shrub-grass patterns in reducing soil erosion in accordance with two assessment indices (Soil detachment rate,Dr; sediment reduction benefit,SRB), as follows: Pattern SL (Dr= 0.098 g·m-2·s-1,SRB= 83%, the same as below) > pattern SM (0.151 g·m-2·s-1, 75%) > pattern SU (0.173 g·m-2·s-1, 68%) > pattern GL (0.267 g·m-2·s-1, 43%). Therefore, we recommend that in our study region, shrubs should be planted on slopes to reduce the risk of soil erosion. Given the prevailing limitations on water and economic resources, shrubs could be planted in belts on the lower slopes to maximize the benefit of sediment reduction.
AcknowledgementsWe thank Pu Wang, the station master of the soil and water conservation monitoring station in Dalad Banner, Inner Mongolia, China, for his help during the field investigation.
杂志排行

Journal of Forestry Research的其它文章
- Molecular characterization and functional analysis of daf‑8 in the pinewood nematode, Bursaphelenchus xylophilus
- Modeling habitat suitability and utilization of the last surviving populations of fallow deer (Dama dama Linnaeus, 1758)
- The identification and pathogenicity of Fusarium oxysporum causing acacia seedling wilt disease
- Growth and decline of arboreal fungi that prey on Bursaphelenchus xylophilus and their predation rate
- Volatile metabolites of willows determining host discrimination by adult Plagiodera versicolora
- Soil ecosystem changes by vegetation on old-field sites over five decades in the Brazilian Atlantic forest