Effects of grazing disturbance of spatial distribution pattern and interspecies relationship of two desert shrubs
2022-04-17LeiZhangYongGaoJinrongLiChaoZhangMinyuLiZhaoHuXiangxinCui
Lei Zhang·Yong Gao·Jinrong Li·Chao Zhang·Minyu Li·Zhao Hu·Xiangxin Cui
Abstract Grazing significantly affects the distribution, growth, and productivity of shrubs. In this study, we evaluated the effects of grazing disturbance on the spatial distribution patterns and interspecific relationships of two desert shrubs, Ammopiptanthus mongolicus and Sarcozygium xanthoxylon. Three types of grazing conditions were considered, including enclosed area (EA), seasonal rotational grazing area (SRGA), and grazing area (GA) (100 m × 100 m), in the West Ordos Nature Reserve of Inner Mongolia, China. The results showed that A. mongolicus and S. xanthoxylon populations were uniformly distributed at a small scale, and the distribution in EA and SRGA became gradually random. In GA, A. mongolicus population showed aggregated distribution but S. xanthoxylon population showed random distribution at a small scale. Moreover, both A. mongolicus and S. xanthoxylon populations at the 5-7 m scale showed random distribution. At the small and intermediate scales, the two species showed positive interspecific relationships of GA. However, no interspecific relationship was noted between the two species in EA and SRGA. A significant positive relationship (P < 0.01) was noted between the two species at 2-9 m and a negative relationship (P < 0.01) at 13-17 m scales in GA. Positive relationship (P < 0.01) was noted between the two species at 6-13 m scales and a significant negative relationship (P < 0.01) at 14-24 m scales in SRGA. The two species of desert shrubs showed positive interspecific relationships at the small scale, and they showed negative relationships as the interspecific competition intensified in the presence of grazing disturbance. When the grazing intensity exceeds a certain threshold, the interspecific relationships become weak. Therefore, moderate grazing would facilitate interspecific competition and species succession, whereas excessive grazing would disrupt natural competition causing desertification ultimately.
Keywords Extending point pattern analysis·Grazing·Interspecific relationships·Unmanned aerial vehicle (UAV)
Introduction
The spatial distribution and relationships among individual populations in the horizontal space represent the distribution pattern combinedly (Lan and Lei 2003). Plant species and communities show specific spatial distribution patterns. Generally, there are three types of spatial distribution patterns-random, uniform, and aggregated distribution (Zhang 2004; Gu et al. 2020). In plants, the spatial distribution patterns are formed through various processes. It includes seed dispersal, intra- and interspecies competition, herbivory, and external environmental interference. The spatial distribution patterns of populations can be explored and analyzed to deduce the potential underlying processes (Wiegand and Moloney 2004; Thammanu et al. 2021). It is generally believed that the formation of spatial distribution patterns can be attributed to two aspects. One is the biological characteristics of plants, such as regeneration, reproduction, seed dispersal and interspecific competition. On the other hand, there are external environmental factors, such as temperature and precipitation (Legendre and Legendre 1998).
Point pattern analysis, first proposed by Ripley, was introduced to China in 1997 by Zhang, analyzing the intra- and interspecific relationships among plants (Zhang 1998). Besides, point pattern analysis is superior to traditional methods that require the characteristics of populations and relationships with the environment (You et al. 2009), which limiting their applicability in analyzing spatial distribution patterns only on one scale (Zhang 1998; Yang et al. 2006). Ripley’sK-function is used to analyze point patterns as the basic method initially. Ripley and Galiano proposed applying the O-ring function to supplement the conventional method, which further promoted point pattern analysis (Galiano 1982; Lan and Lei 2003; Wiegand and Moloney 2004). The O-ring function interprets local neighbourhood density directly, which is a supplement of Ripley’sK-function and can be used instead of the pair-correlation functiong(r). Since then, the studies on spatial distribution patterns of single species in different stands and habitats, and ecological relationships among different species gradually enriched. Besides, the relationships between spatial scales, patterns about plant shapes and sizes have been analyzed (Yang et al. 2006; Zhao et al. 2011b; Fu et al. 2016). Distribution patterns, as well as mechanisms of intra- and interspecies coexistence, competition, and adaptability, have been explored in grasses (Chen 2010; Zhao et al. 2011a; Wang et al. 2015; Zhang et al. 2016a, b), shrubs (Jia and Li 2008; Xie et al. 2008; Liu et al. 2011; Yang et al. 2012), and trees (Song et al. 2010; Li et al. 2011, 2014) in various habitats, including grasslands, deserts, forests, etc. Under external environmental interference, desert shrubs exhibit different ecological adaptations related to physiological characteristics. Grazing is the most common interference in desert steppes. Chinese researchers have studied plant spatial distribution patterns under different stocking rates and grazing conditions (Xin et al. 2000; Liu and Li 2004; Su et al. 2018), although most of these studies have been focused on grasses.
Ripley’sLfunction of point pattern analysis was used to analyze the spatial pattern of trees in the 24 hm2sample plot in Xishuangbanna Tropical Rainforest (Lan and Lei 2003). The study showed that most rare species were in aggregated distribution pattern, and the pattern of upper dominant tree species changed from aggregated to random as the tree ages. Yang et al. (2012) used Ripley’sK(t) function to study the structure and point distribution pattern of three communities in Cele oasis on the southern edge of Taklimakan Desert. It was found that with the increase of wind erosion intensity, the relationships among five species showed a decreasing trend. Ripley’sKfunction and Monte Carlo stochastic simulation were calculated in Programita to study spatial distribution patterns and relationships among the populations ofStipa breviflora,Cleistogenes songorica, andAllium polyrhizum(Sun et al. 2016). Plants showed obvious responses to different grazing disturbances, and reflected as increased species colonization and decreased degree of aggregated distribution. The adaptability ofStipa grandispopulations responding to increased grazing intensity compared with that under non-grazing conditions (Su et al. 2018). Under a low stocking rate, the populations tended to adopt an aggregated distribution pattern, and they were uniformly distributed under an intermediate stocking rate, whereas under a high stocking rate, the populations shifted from aggregated to random distribution. Most studies on spatial distribution patterns have used the point pattern method as a basis (Wang et al. 2010; Chen et al. 2014; Sun et al. 2018, 2019) when the shrub is regarded as a point, the analysis would cover up its small-scale correlation to a large extent (Prentice and Werger 1985; Wang et al. 2010). While, Chen et al. (2011) used extending point pattern analysis to study the spatial patterns and ecological processes of plants in certain sizes and shapes. Extending point pattern analysis, based on networking and simulation, extends point models for analyzing with the sizes and irregular shapes data of plants compared to the conventional point pattern analysis. Therefore, the study of plants’ spatial distribution patterns and ecological processes would be more comprehensive considering the shape and size applying the extending point pattern analysis.
Desert steppe ecosystem, typically fragile, about which the competition between species and the strength of competition has been controversial. Some studies found that competition itself has no direct relationship with the results. In some ecosystems, although the probability of competition is slim, it also plays an important role in the formation of the community. In this study, we analyzed the spatial distribution patterns of desert shrubs in grazing plot, rotation grazing plot as well as enclosure plot aboutAmmopiptanthusmongolicusandSarcozygium xanthoxyloncommunity. Through aerial photography and extending point pattern analysis, we analyzed the spatial distribution patterns and interspecific relationships of the two species under different grazing conditions. Aiming to explore the ecological relationships of these two dominant shrub species, such as competition, and provide theoretical basis for protecting the species in the western Ordos.
Materials and methods
Study sites
The study sites were set up in the western Ordos Plateau desert of Inner Mongolia, China (106°48′ - 106°54′ E, 40°4′ - 40°7′ N). The area has a typical temperate continental climate with marked seasonal and diurnal temperature variations and low precipitation, which is also characterized by the earlier dry season, abundant light and heat as well as sandy and windy days. The soil is predominantly pale calcic, but brown calcic and saline soils are also present.
Three 100 m × 100 m study plots, with uniform plant community appearances, were selected in the western Ordos desert according to their grazing mode. They were defined as enclosed area (EA), seasonal rotational grazing area (SRGA) and grazing area (GA). EA locates within the West Ordos Nature Reserve, 1 km from the boundary. SRGA is about 2 km west of EA, where the grazing carried out in this region during the warm season (June to October) with a grazing intensity of 1.2 sheep·hm-2. GA is about 5 km southwest of EA with a grazing intensity of 1.8 sheep·ha-1(Fig. 1).

Fig. 1 Mapped location of the study area
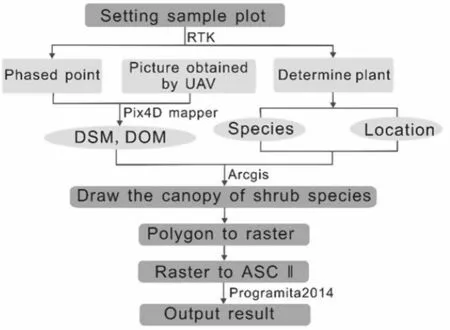
Fig. 2 Schematic workflow of field and UAV data processing

Fig. 3 Mapped extending point patterns of Ammopiptanthus mongolicus and Sarcozygium xanthoxylon in the study area. a Enclosed area. b Seasonal rotational grazing area. c Grazing area
The three study plots were all dominated withA. mongolicusandS. xanthoxylon, where these two species’ coverage degree, as well as density, were larger than the others (Table 1). The herbs were not investigated because of the difficulty of quantitative statistical data.

Table 1 Vegetation characteristics under different grazing conditions in three study plots
Data acquisition and processing
UAV photos and RTK data acquisition
EBee UAV (Unmanned Aerial Vehicle), carrying a Sony WX-220 visible light camera, was used to obtain ortho photos of shrubs in the three study plots (100 m × 100 m). EMotion 2 was used for flight route planning. The UAV flew at 100 m obtaining 600 visible light orthophotos with 5 cm/pix resolution at a shooting frequency of 5 s. Forward and side overlaps were set as 80% and 75%, respectively.
During the ground truth experiment, Hai Xingda H32 RTK (Real-time Kinematic) was also used to locate and number the shrubs. Species name and geographical coordinates of each shrub were recorded, which were used in the post-processing of UAV-based imaging data for matching the field and orthophotos locations as well as vectorizing species names to further support the point pattern analysis.
Shrub localization
Pix4D Mapper was used for processing the UAV orthophotos to obtain the ortho-mosaic images of each study plot. The raw visible light UAV photos were imported into Pix4D Mapper platform. After channel correction, format conversion and aerial triangulation, the photos were automatically matched and mosaicked. Combining with the GPS coordinates and inertial navigation attitude as well as the control point information, recorded by the drone control system, the Digital Surface Map (DSM) and the final Digital Orthophoto Map (DOM), were generated after the aerotriangulation.
The recorded geographical coordinates, orthomosaic images, and species name were imported into ArcGIS 10.2. After vectorizing the shrub pattern spots, the corresponding vectorized patterns were allocated to the shrubs in the plot through geographical spatial positioning. Datasets that described the distribution maps of populations, as well as the shapes and sizes of individual shrubs, were obtained through rasterization of the vectorized data. These datasets were imported into Programita (2014) for simulation and extending point pattern analysis (Figs. 2 and 3).
Indices for extending point pattern analysis
Poisson distribution
Poisson distribution was considered the most suitable distribution model for studying shrub point patterns in the western Ordos, by comparing the application scope of the models for point pattern analysis of data collected from the study plots, Poisson distribution was considered the most suitable distribution model for studying shrub point patterns in the western Ordos. Poisson distribution is commonly used to describe the random distribution of a population, in which the occurrence probability of an individual in each sampling unit is same, and the existence of any individual does not affect others.

wherexis the number of plants,x= 0, 1, 2, 3…;mis the overall mean, andp(x) is the probability ofxof the samples withxindividuals.
Extending point pattern analysis is based on networking and simulation to extend point models for analyzing the data of plants with specific sizes and irregular shapes rather than points comparing to the point pattern analysis. The basic idea is to apply the distribution maps got from 2.2.2 to represent plants in the study site that every plant can be expressed as one or more adjacent cells according to its size and shape. Different plants species can be substituted with different numbers. The Monte Carlo method was used for stochastic simulation under specific null models to construct confidence intervals and examine the significance of the random distribution deviations. Repeated simulations were performed until a determined number was reached.
Null models and corresponding functions for extending point pattern analysis
The key point in the application of extending point pattern analysis is to select an appropriate null model to solve the specific biological problems. The common null models in extending point pattern analysis include the Complete Spatial Randomness (CSR) model, Heterogeneous Poisson (HP) model, independence model, and random labelling model, etc. The O11(r) function and O12(r) function corresponding to the CSR and HP model, respectively, were used to analyze the single species distribution pattern as well as interrelationships ofA. mongolicusandS. xanthoxylon.
Complete Spatial Randomness model
In this study, the CSR model was used to analyze the spatial patterns ofA. mongolicusandS. xanthoxylonin the study plots. The CSR model is the most commonly used null model to assess the spatial patterns of univariate patterns. In a certain area, the occurrence of events follows a Poisson distribution that the probability of plant occurring in any position is equal and the plant is independently located, assuming no interactions. Plants in a certain size and irregular shape are, similar to CSR, distribute randomly as described. This null model operates as a dividing hypothesis to detect the regular or aggregated distribution of the univariate patterns.
O11(r) function
The O-ring function applied in single species, O11(r) function, was used to study theA. mongolicusandS. xanthoxylonspecies spatial distribution patterns. It uses rings to replace circles in conventional study methods to eliminate the scale accumulation effects of the RipleyRfunction. From the Monte Carlo simulated confidence intervals, we obtained two top and bottom envelopes. When O11(r) is above the top envelope, aggregated distribution was assumed; when O11(r) is below the bottom envelope, uniform distribution was assumed; and when O11(r) is between the two envelopes, random distribution was assumed (Shen et al. 2019). In this study, 99 simulations were performed to obtain the 99% confidence intervals (Fig. 4).

Fig. 4 Single species extending point patterns of Ammopiptanthus mongolicus (left panel) and Sarcozygium xanthoxylon (right panel). EA: Enclosed area, SRGA: Seasonal rotational grazing area, GA: Grazing area
Heterogeneous Poisson model
The HP null model was used to analyze the relationships betweenA. mongolicusandS. xanthoxylon. When the spatial patterns are heterogeneous, the CSR model is not suitable for testing the second-order features to reveal the true second-order effects of the observed patterns. All secondorder features in extending point patterns can be expressed using the density (λ) and K function. λK (r) is the expected number of points within any point distance r.
O12(r) function
Wiegand (2006) proposed ag(r) function based on network estimation to analyze the distribution patterns of plants with irregular shape in a certain area and obtained a binary correlation functiong(r) and statistic function O12(r), such that O12(r) = λg(r). When O12(r) > upper envelops, the correlation between the two subjects is positive. However, when O12(r) < lower envelops, the correlation between the two subjects is negative. When O12(r) is between the upper and lower envelopes, it indicates that the two species are not related. When O12(r) > λ, the correlation between the two subjects is significant. However, when O12(r) < λ, the correlation between the two subjects is not significant (Fig. 5).

Fig. 5 Interspecific relationships between Ammopiptanthus mongolicus and Sarcozygium xanthoxylon. EA: Enclosed area, SRGA: Seasonal rotational grazing area, GA: Grazing area
Results
Vegetation characteristics under different grazing conditions
Vegetation cover, average crown width, and the average height of the shrubs reflect the intensity of livestock grazing in a given area. There was a significant difference in average crown width betweenA.mongolicusandS. xanthoxylonunder the three grazing conditions (P< 0.05). ForA. mongolicus, average height was significantly greater in SRGA, than EA and GA; whereas forS. xanthoxylon, average height was significantly greater in SRGA and EA, than GA (P< 0.05) (Table 2). Overall, the values of vegetation indices (vegetation cover, crown width, and height) of the two shrub species increased and then decreased with the increasing grazing intensity.

Table 2 Vegetation characteristics of shrubs under different grazing conditions in three study plots
Spatial distribution patterns ofA. mongolicus andS. xanthoxylon populations
O11(r) function, was used to studyA. mongolicusandS. xanthoxylonsingle species distribution patterns, that when O11(r) was above, below and between the envelopes, aggregated, uniform and random distribution was assumed. In EA plot,A. mongolicuspopulations deviated from the bottom envelope at 0-13 m scale, showing uniform distribution. However, this distribution shifted from uniform to random at a larger scale of 13-50 m. In SRGA plot, the populations showed uniform distribution at 0-5 m scale, random distribution at 5-7 m scale, and aggregated distribution at 7-18 m scale, which shifted to random distribution at 18-50 m scale and uniform distribution at 30-35 m scale. In GA plot, it showed uniform distribution at 0-5 m scale, random distribution at 5-7 m scale, and aggregated distribution at 7-50 m scale (Fig. 4).
In EA plot,S. xanthoxylonpopulations showed uniform distribution at 0-6 m scale and random distribution at 6-50 m scale. In SRGA plot, the populations showed uniform distribution at 0-32 m scale and random distribution at 32-50 m scale. In GA plot, it showed uniform distribution at 0-4 m scale, random distribution at 4-6 m scale, and aggregated distribution at 6-14 m scale, which shifted to random distribution at 14-50 m scale and uniform distribution at 31-35 m scale (Fig. 4).
Interspecific relationships betweenA. mongolicus andS. xanthoxylon under different grazing conditions
The O12(r) function was used to analyze the interspecific relationships betweenA. mongolicusandS. xanthoxylon. In EA plot, the two species showed a non-significant positive relationship at 0-21 m scale and no relationship at 21-50 m scale. In SRGA plot,A. mongolicusandS. xanthoxylonshowed positive relationships at 0-13 m scale (non-significant at 0-6 m scale), a significant positive relationship at 6-13 m scale (P< 0.01), There is no relationship at 13-14 m scale, a significant negative relationship at 14-42 m scale (P< 0.01), a non-significant relationship at 24-42 m scale, and no relationship at 42-50 m scale. In GA plot,A. mongolicusandS. xanthoxylonshowed a positive relationship at 0-9 m scale (non-significant at 0-2 m scale and significant at 2-9 m scale (P< 0.01)), a significant negative relationship at 13-17 m scale (P< 0.01), and no relationship at 9-13 m and 17-50 m scales (Fig. 5). These results indicated that at the 0-50 m scale, as grazing intensity increases, competition betweenA. mongolicusandS. xanthoxylonshowed a trend of initial increase followed by a decrease.
Discussion
Effect of soil matrix on spatial distribution pattern in different study plots
The three study plots located in the same area close to each other, which can be considered that they have the same climatic background value. The climate of the study area is characterized by drought, less rain and high temperature in summer. The differences of community characteristics and distribution patterns between the two species,A. mongolicusandS. xanthoxylon, except for their genetic characteristics, mainly come from the impact of grazing intensity and soil matrix (Zhao et al. 2020).
Grazing is the primary mode of grassland resource utilization, and enclosure and rotational grazing are beneficial for the sustainable utilization of grassland resources (Li et al. 2013). During the experimental period, the climate of the study area was characterized by high temperature and concentrated rainfall in dry season, with no special impact on the shrub community.
Soil Organic Carbon (SOC) is an important index of soil fertility, which can be used as a distinguished index of soil characteristics. The SOC in 0-20 cm soil layer ofS. xanthoxylonin GA was lower than that in EA and SRGA (Fig. 6). In the 20-40 cm and 60-80 cm soil layers, it was the highest in SRGA, while that of GA was the lowest, and there were significant differences in SOC content among different grazing areas (P< 0.05). The SOC content in 0-60 cm layer ofA. mongolicuswas EA > SRGA > GA, but the change of it in the deep soil (60-80 cm) in SRGA was lower than that of EA and GA.
There were significant differences in soil total nitrogen content among different grazing intensities (P< 0.05), and in most of the soil layers it showed that SRGA > GA > EA. The total phosphorus content of soil decreased with the increasing depth of soil, and the difference between different soil layers was significant (P< 0.05). The total phosphorus content in all soil layers ofS. xanthoxylonin SRGA was significantly lower than that in EA and GA (P< 0.05), and the content in all soil layers ofA. mongolicusin GA was significantly higher than that of EA and SRGA (P< 0.05).
Except for the 40-60 cm soil layer, the soil moisture content is characterized by significant differences (P< 0.05) among the 0-80 cm soil depth ofS. xanthoxylonpopulation (Fig. 6). With the increase of grazing intensity, the soil moisture content in 0-20 cm soil layer reduced gradually, and it showed that EA > SRGA > GA as soil depth increasing. Overall, the soil moisture content of EA was significantly higher than the SRGA and GA. In the enclosed plot, the water content ofS. xanthoxylonpopulation was obviously higher thanA. mongolicuspopulation. In the 0-40 cm soil layer, the soil water content ofA. mongolicuspopulation increased and then decreased with the increasing of grazing intensity. In the 40-80 cm soil layer, the soil water content gradually decreased with the increasing of grazing intensity. In addition, with the increase of soil depth, the response of soil moisture to grazing disturbance became weaker and weaker.
Many scholars have studied the relationship between environmental factors and spatial distribution patterns of species. Chang et al. (2009) selected 11 variables as environmental factors, such as total nitrogen, total phosphorus, organic matter, etc., and the studies showed that the influence of environmental factors on the spatial distribution ofTilia amurensisis stronger. Wang et al. (2016) selected environmental factors, such as soil nutrients, surface microelevation, etc., to study the distribution pattern of grassland plant diversity. It showed that under the constraints of different micro-topography, the plants’ distribution pattern is the result of multiple factors, and the intensity of grazing interference could be the main reason. The author believes that the soil environment of the study plots is related to the spatial pattern and interspecific relationship of the two shrub species, but it is not yet qualitatively or quantitatively proved. This is also a point that deserves further exploration.
Competition growth on the formation of single species spatial distribution patterns
A. mongolicuspopulations showed uniform distribution at small scales (Fig. 4). Studies have shown that at small scales, different spatial distribution characteristics arise due to intra- or interspecies competition or limitations in seed dispersal, among others. Generative propagation occurs only under natural conditions, which strongly affects the early spatial distribution characteristics ofA. mongolicuspopulations. When humidity and temperature were appropriate, numerousA. mongolicusseeds germinated, ultimately increasing the population density (Liu 1998). This intraspecific competition that resulted in self-thinning ofA. mongolicuson small scale. The results corroborated the findings of Wei et al. (2005).

Fig. 6 The effects of EA, SRGA and GA on the soil characteristics of different shrubs community. Note Different capital letters indicate that there is a significant difference between different soil depths of same species under the same grazing intensity (P < 0.05); the different lowercase letters indicate that the same species in same soil depth under different grazing intensities have significant differences (P < 0.05)
At large spatial scales, the distribution patterns of populations are affected by terrain, soil moisture, and heterogeneities in other abiotic environmental factors (Zhang and Meng 2004; Zhang et al. 2016a, b). As the spatial scale expands, a significant increase in the number ofA. mongolicusindividuals would increase intraspecies competition. In the presence of limited resources, populations tend to be randomly distributed (Shen et al. 2019). Both EA and SRGA showed randomly distributed populations. Since constant grazing reduces intraspecies competition, shrubs formed patches for survival, and then populations showed aggregated distribution (He et al. 2006). This explained the occurrence of aggregated distribution in SRGA at the 7-18 m scale, which shifted to random distribution at larger scales. The interference was the greatest in GA, which resulted in remarkable responses of populations to external interferences, reflected as an aggregated distribution pattern at the 7-50 m scale.
The spatial distribution patterns ofS. xanthoxylonwere similar to those ofA. mongolicus. Uniform distribution was observed at small scales in EA and SRGA, which shifted to random distribution at larger scales. Aggregated distribution was observed in GA at the 6-14 m scale. Based on the distribution patterns of these two shrubs, the population density ofS. xanthoxylonwas far higher than that ofA. mongolicus.S. xanthoxylonpopulations also showed greater resistance to external interference. However, they showed random distribution, instead of aggregated distribution, at larger scales, which may be attributed to differences in the degree of palatability and interference ofA. mongolicusandS. xanthoxylonpopulations in GA.
Grazing disturbance on the formation of interspecific relationships patterns
The spatial relationships between populations can explain the mutual interaction among various species in heterogeneous habitats (Feng et al. 2016). The formation of plant population relationships depends on the species themselves as well as the environmental characteristics, such as soil, climate, and terrain (Zhang and Meng 2004). Within plant communities, positive and negative interactions exist simultaneously, and the relationships are determined based on the relative intensity of two interactions. These relative intensities are closely associated with the environmental conditions of communities (Wang et al. 2015).
Grazing disturbance could change the availability of environmental resources to a community and alter the interactions among species ultimately (Liu and Zhao 2000). This change in relationships caused by grazing is attributed to the changes in the ecological adaptability of populations and the niche overlap in response to altered community conditions (Zhang and Jiao 2003). Specifically, long-term grazing changes the community adaptability to environment leading to the competitiveness reduced of the dominant species (Soltani et al. 2020). It decreases the strong competitive selection pressure on weak species, changing the patterns of relationships among communities, then turns competition into coordinated coexistence.
This effects of ecological compensation alter the pattern of resource utilization from direct competition to mutual coordination (Fock et al. 2016; Liu 2019). Through the O12(r) function,A. mongolicusandS. xanthoxylonshowed a positive relationship at small scales under different grazing conditions, which is consistent with intense moisture competition in arid regions. To alleviate drought stress, plants seek shelter from other plants typically, then the positive relationships at small scales formed (Callaway et al. 2002).
Sun et al. (2019) measured the diurnal variation of photosynthesis in four kinds of desert shrubs in western Ordos, and the results showed that the net photosynthetic rate ofS. xanthoxylonwas significantly higher than that ofA. mongolicus, indicating thatS. xanthoxylonhad stronger photosynthetic physiological and ecological adaptability and habitat suitability thanA. mongolicus. It also has the highest average daily water use efficiency, which proves that it has stronger adaptability to arid environment. Through pot cultivation, Li et al. (2012) measured a series of morphological, growth indexes, photosynthesis, water physiological indexes, and made a comprehensive evaluation on the drought resistance of several sand-shrubs. The results showed that the drought resistance ofS. xanthoxylonwas stronger thanA. mongolicus.A. mongolicus.As an evergreen plant, it needs to maintain the integrity of leaf structure and function in the season of harsh environment, so it has a high material investment in leaves thanS. xanthoxylon. In addition, P element may be the main limiting factor leading to the growth ofS. xanthoxylonandA. mongolicus. The average P content ofS. xanthoxylonwas also higher thanA. mongolicusin the study plot, which may result in the stronger competitiveness ofA. mongolicusat this stage (Shi et al. 2018).
With the increase of scale, environmental factors gradually become dominant driving the spatial distribution of populations, and the differences in interference intensity alter the interspecific relationships within communities. In SRGA, the original interspecific relationships were disrupted due to external interference. As a result of competition for more space and resources,A. mongolicusandS. xanthoxylonshowed a negative relationship at the 14-42 m scale. The relationships between these two species were similar in GA and EA. However, the mutually dependent relationship between them shifted to a significant negative relationship at the 14-24 m scale in SRGA (P< 0.01).
In the absence of grazing, natural resources act as the limiting factor for population growth, and the difference in acquiring resource ability giving rise to competition among populations. As a result, the community showed insignificant negative relationships. In the presence of grazing, however, interference created by livestock (feeding and trampling) becomes the limiting factors for population growth. Under these conditions, interspecific coordination promotes response to grazing disturbance, leading to positive relationships among populations.
The stress gradient hypothesis states that competition plays a major role in environments, in which the stress is low. When meeting the high stress, interactions become more common (Bertness and Callaway 1994). However, when interference exceeds a certain limit, interspecific interactions between plants are diminished (Su et al. 2018). Based on the results, the stocking rate of GA exceeded the rational limit for that region. If grazing continues at this intensity, desertification of this region may be accelerated. During on-site surveys, we found that when grown together,S, xanthoxylonwas usually the stronger competitor thanA mongolicus, leading to the elimination ofA mongolicusas a result. In addition to the effects of soil and moisture, among other factors, further in-depth studies are warranted to explore whether allelopathic effects are present.
Conclusions
In this study, we analyzed the spatial distribution patterns ofA. mongolicusandS. xanthoxylonpopulations in the western Ordos desert.A. mongolicuspopulations showed uniform distribution at small scales, which gradually shifted to random distribution at large scales. To resist grazing, populations exhibited significant responses, as evidenced by aggregated distribution in SRGA at the 7-18 m scale and GA at the 7-50 m scale.S. xanthoxylonshowed uniform distribution in EA and SRGA at small scales and aggregated distribution in GA at the 6-14 m scale, before shifting to random distribution eventually. As the density ofS. xanthoxylonwas significantly greater than that ofA. mongolicus,S. xanthoxylonpopulations showed greater resistance to grazing interference than those ofA. mongolicus. The two species showed a positive relationship at small scales. Grazing interference gradually increases interspecies competition, resulting in a negative relationship between the two species in SRGA at the intermediate scales. When grazing intensity exceeds the rational stocking rate, interspecies competition gradually decreases. Therefore, optimal grazing intensity would increase interspecies competition, which is beneficial for population succession. However, excessive grazing would disrupt this natural competition and intensify desertification in arid areas.
AcknowledgementsWe thank the Institute of Water Resources for Pastoral Area of the Ministry of Water Resources and Inner Mongolia Agricultural University for their very helpful assistance with fieldwork.
Open AccessThis article is licensed under a Creative Commons Attribution 4.0 International License, which permits use, sharing, adaptation, distribution and reproduction in any medium or format, as long as you give appropriate credit to the original author(s) and the source, provide a link to the Creative Commons licence, and indicate if changes were made. The images or other third party material in this article are included in the article’s Creative Commons licence, unless indicated otherwise in a credit line to the material. If material is not included in the article’s Creative Commons licence and your intended use is not permitted by statutory regulation or exceeds the permitted use, you will need to obtain permission directly from the copyright holder. To view a copy of this licence, visit http:// creat iveco mmons. org/ licen ses/ by/4. 0/.
杂志排行

Journal of Forestry Research的其它文章
- Molecular characterization and functional analysis of daf‑8 in the pinewood nematode, Bursaphelenchus xylophilus
- Modeling habitat suitability and utilization of the last surviving populations of fallow deer (Dama dama Linnaeus, 1758)
- The identification and pathogenicity of Fusarium oxysporum causing acacia seedling wilt disease
- Growth and decline of arboreal fungi that prey on Bursaphelenchus xylophilus and their predation rate
- Volatile metabolites of willows determining host discrimination by adult Plagiodera versicolora
- Soil ecosystem changes by vegetation on old-field sites over five decades in the Brazilian Atlantic forest