Letter to the Editor Can sieving size affect the determination of soil available micronutrients?
2022-04-16
Dear Editor,
Globally,approximately two billion people suffer from micronutrient deficiencies(Tulchinsky,2010;Myerset al.,2014).Soil micronutrient availability is of great importance for the evaluation of soil fertility and the determination of appropriate measures for improving crop quality and human health.The diethylenetriamine-penta-acetic (DTPA)extraction method is used for the simultaneous measurement of available iron(Fe),manganese(Mn),copper(Cu),and zinc(Zn)in near-neutral and calcareous soils(Lindsay and Norvell,1978),and the procedures involve soil preparation,grinding,and extraction.The grinding of air-dried soil samples and sieving the samples through a 2-mm mesh sieve are commonly recognized as‘standard procedures’around the world (Carter and Gregorich, 2008).However, most Chinese laboratories use ground soil samples that are passed through a 1-mm mesh,referring to the methods in Soil and Agricultural Chemistry Analysis(Bao,2008),as mentioned in some articles(Weiet al.,2006;Zhaoet al.,2014;Wanget al.,2017;Zhanget al.,2017).Unfortunately,the use of the 1-mm sieving method is often considered controversial,and many researchers prefer using 2-mm sieving (Huanget al.,2019).Additionally,soils passed through a 1-mm mesh have generally been used for storage after relevant chemical analyses in China.This limits the interpretation of results obtained from China and their comparison to those from other countries,since soil sample handling might profoundly influence the measured values of these micronutrients(Carter and Gregorich,2008).
Numerous studies have shown that the available micronutrient concentrations are higher in fine soil fractions than in coarse fractions(Leeet al.,1997;Sharmaet al.,2004;Karamiet al.,2009;Gaoet al.,2011).After hand-sieving soils to pass through a 2-mm mesh,a portion of the samples,such as sand,may still remain on the 1-mm sieve.Here,our hypothesis is that the grinding methods for passage through 1-and 2-mm sieves will not affect the determined concentrations of available Fe,Mn,Cu,and Zn in soils with a low proportion of larger particles, whereas the corresponding measured values may be higher for the 1-mm sieving method in soils with a high proportion of larger particles due to a dilution effect.To test this hypothesis,we investigated and analysed 55 soils,including those with different proportions of sand, silt, and clay, from five soil layers in four typical wheat production regions of China.The objective of this study was to answer the following questions.i) Do sieve sizes of 1- and 2-mm influence soil Fe, Mn, Cu, and Zn availability?ii) If the answer is ‘yes’, then which factors are responsible for the differences between the two sieving methods?
Soil samples were collected from 11 sites, including the main soil characteristics of China’s four typical wheat cropping regions:spring wheat(Triticum aestivumL.),single winter wheat,winter wheat-summer maize(Zea maysL.)rotation, and rice(Oryza sativaL.)-winter wheat rotation regions.At the centre of each field,a 5 m×10 m block was selected as the sampling area.A detailed description of the sampling sites is presented in Table I.For each field,three soil cores(0–100 cm)in the sampling area were randomly taken at 20-cm intervals between wheat rows using a stainless-steel auger with a 4.0-cm inner diameter at wheat maturity.Soils from the same layer were completely mixed and immediately sealed in numbered plastic bags.
After air-drying and removing the stones and plant residues manually, each soil sample was mixed, crushed with a wood mallet,and hand-sieved through a 2-mm nylon mesh;then,one-half was sieved through a 1-mm nylon mesh.Samples passed through 2- and 1-mm mesh sieves were separately stored in sealed polyethylene bags for pH and available Fe,Mn,Cu,and Zn concentration analyses.For samples passed through the 2-mm mesh,subsamples ofca.5 g soil were subjected to analysis of the particle-size distribution, and 80.0 g of soil was used to measure the size distribution of ground samples(<1 and 1–2 mm).A fraction of each 1-mm subsample was ground to fine powder(0.15 mm)for calcium carbonate(CaCO3),organic matter,and total nitrogen(N)analyses.
Soil pH was measured in suspension at a 1:2.5 soil-towater ratio(weight/volume)using an ion selective electrode,and the particle size distribution was determined using a laser particle size analyser(Mastersizer 2000,Malvern Instruments, England, UK) (Blott and Pye, 2006).The size distribution of the ground samples was manually measured using the dry-sieving method (Dıaz-Zoritaet al., 2002).Soil available Fe, Mn, Cu, and Zn were extracted using the DTPA extraction method(Lindsay and Norvell,1978)and analysed using a PinAAcle 500 atomic absorption spectrophotometer (PerkinElmer, Waltham, Mass, USA).The CaCO3content was determined using the pressure-calcimeter method(Sherrodet al.,2002),and the organic matter and total N were determined using the wet oxidation(Walkleyand Black, 1934) and Kjeldahl (Bremmer and Mulvaney,1982)methods,respectively.The precision and accuracy of the measurements were assessed using certified reference materials prepared in our laboratory.Two reagent blanks,duplicate samples, and three certified reference materials were included in each batch during the chemical analysis process.A two-way analysis of variance(ANOVA)was applied to detect the effects of cropping pattern and soil depth on different traits after testing for normality.For each soil layer at 20 cm depth increments,the correlations between variables were characterized using Pearson’s correlation coefficients.Linear regression analysis was used to evaluate the association between the 1-and 2-mm sieving methods for 55 soil samples from the 0–100 cm layer.SPSS 21.0 software(SPSS Inc.,USA)was used for statistical analyses.
The basic physicochemical properties of the soils in the four typical wheat cropping regions varied across sites and soil layers(Table SI,see Supplementary Material for Table SI).The major soil texture was either clay loam or loam,while others were sandy loam,silty clay loam,clay,and silty clay.The sand content ranged from 17%to 63%in the 0–20 cm topsoil layer and 15%–51%in the 0–100 cm soil layer.In the 0–20 cm soil layer,the pH,CaCO3,organic matter,and total N ranged from 5.8 to 8.7,0.9 to 112,9.2 to 32,and 0.5 to 1.6g kg−1,respectively.The corresponding ranges were 7.1–8.8, 1.1–160, 4.1–2, and 0.3–1.2 g kg−1in the 0–100 cm soil layer,respectively.After hand-sieving through the 2-mm mesh,14%–37%of soils were still retained on the 1-mm sieve(Fig.1),revealing the different soil sample size distributions for the 1-and 2-mm sieving methods.

TABLE ISite description of soil samples collected from four typical wheat cropping regions in China
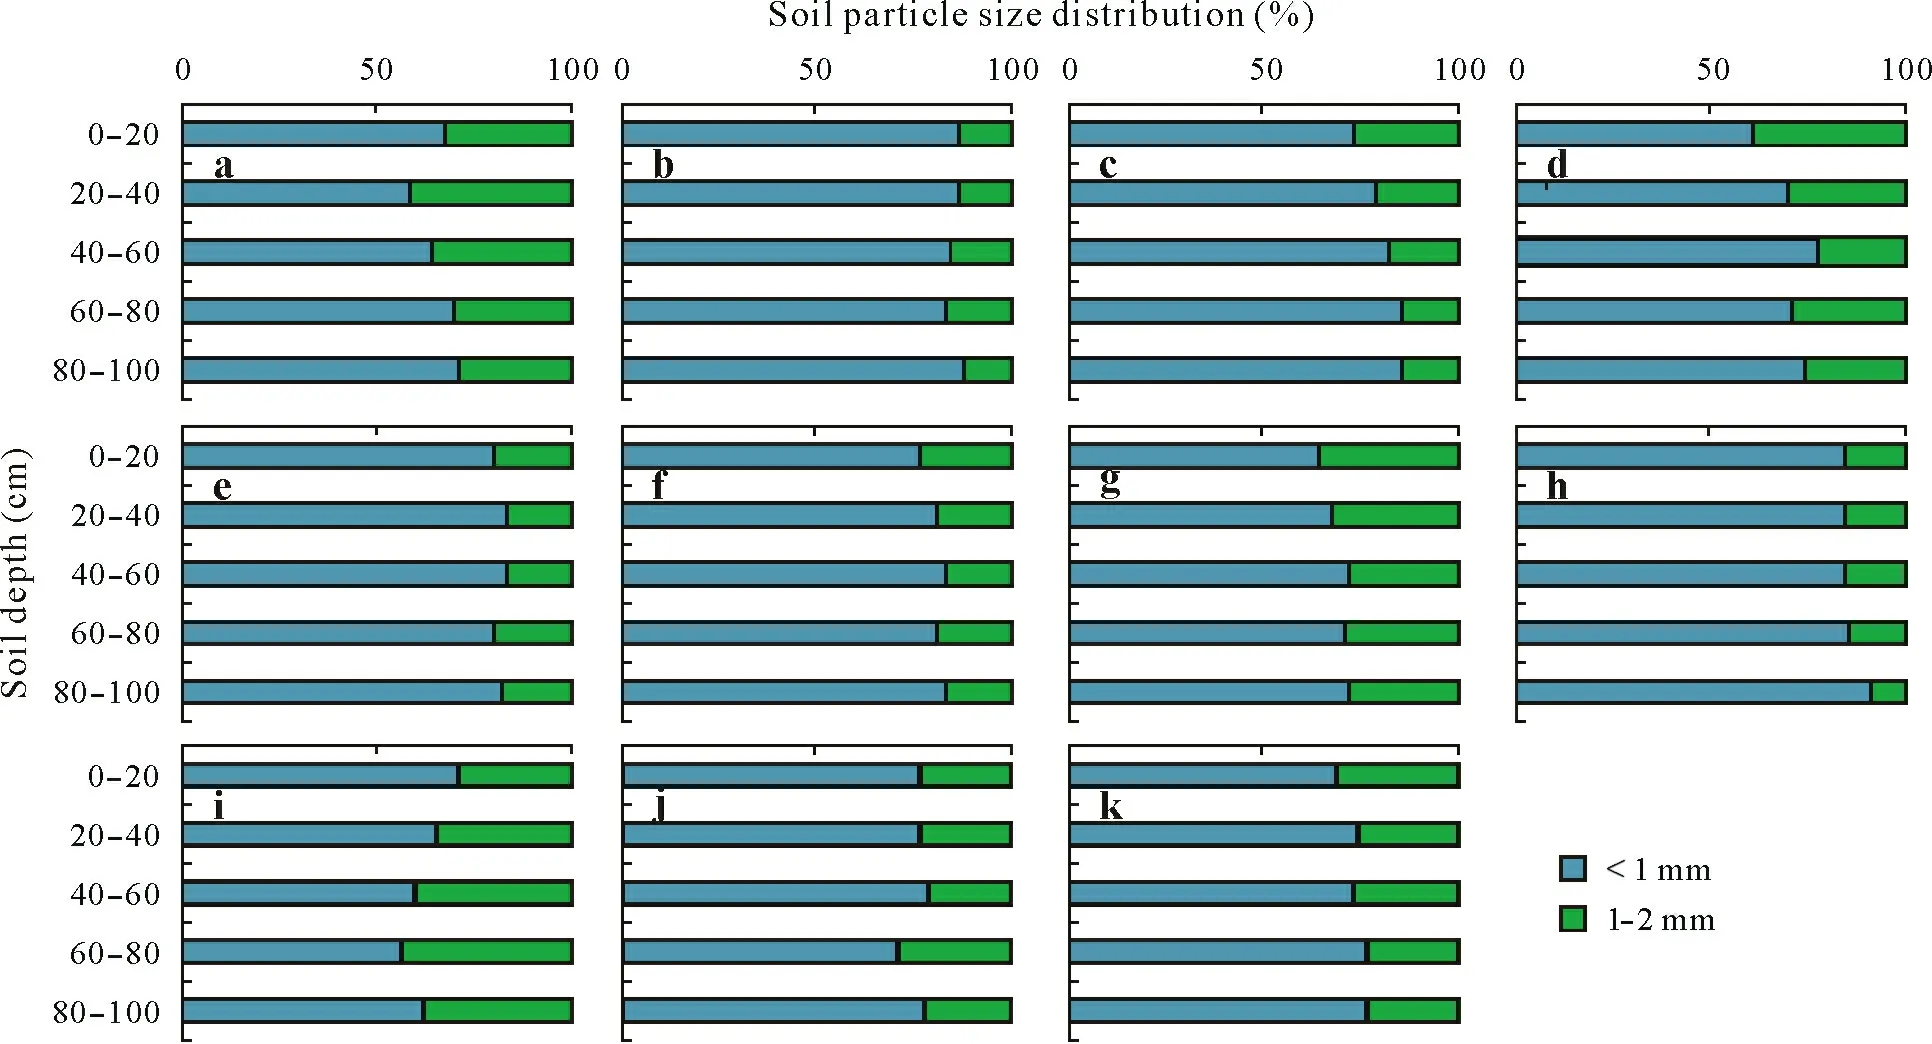
Fig.1 Particle size distribution of ground soil samples passed through a 2-mm mesh sieve from different sites,Qiqihar,Heilongjiang(a),Kashgar,Xinjiang(b),Bayan Nur,Inner Mongolia(c),Tianshui,Gansu(d),Linfen,Shanxi(e),Weinan,Shaanxi(f);Xingtai,Hebei(g),Liaocheng,Shandong(h),Xinyang,Henan(i),Luan,Anhui(j),and Nanchong,Sichuan(k),in China.
In addition,our results clearly demonstrated that the soilgrinding methods for passage through the 1-and 2-mm mesh sieves did not result in differences in the available Fe,Mn,Cu,and Zn concentrations in a series of soils with different sand contents,which contradicts the above hypothesis.For each soil layer,the correlation coefficients between the two methods varied from 0.936to 1.000(Table II).For all samples from the 0–100 cm soil layer,regression analysis indicated that the measured values obtained with the 1-mm mesh were positively correlated with those obtained with the 2-mm mesh,with the 2-/1-mm sieve slope ranging from 0.978 to 1.026,andr2values ranging from 0.977 to 0.997(Fig.2).It is worth noting that in the DTPA extraction procedure,25 g of air-dried soil sample was mixed with 50 mL of extraction solution in an Erlenmeyer flask (soil:solution= 1:2) and then shaken for 2 h on a reciprocating shaker at 120 strokes per minute (Lindsay and Norvell, 1978).Therefore,the approximate concentrations of soil available micronutrients between the 1-and 2-mm sieving methods should be explained by the fact that the 2-h shaking wascapable of breaking the soil aggregates and ensuring the release of the available nutrients in larger soil particles.Moreover,according to the USDA classification system of soil particles,particles between the diameters of 1-and 2-mm are often recognized as ‘very coarse sand’, which mainly consists of quartzs or other simple silicates and made little or no contribution to soil micronutrient availability.

Fig.2 Regression analyses of available Fe,Mn,Cu,and Zn concentrations between the 1-and 2-mm sieving methods at each soil layer from 11 sites in four typical wheat cropping regions in China.
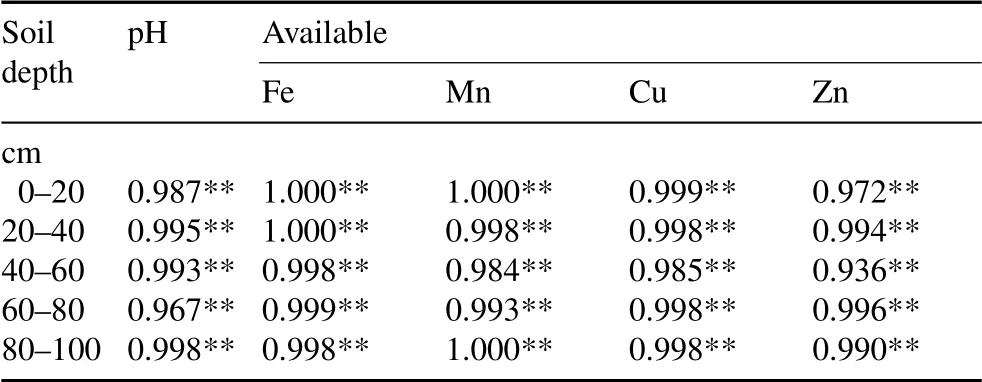
TABLE IIPearson correlation coefficients for soil pH and available micronutrient concentrations between the 1-and 2-mm sieving methods at each soil layer from 11 sites in four typical wheat cropping regions in China
The results address controversies about the available micronutrient results yielded by these two sieve size methods,at least for soils in major wheat-producing regions.Generally,the 2-mm sieving method has been considered superior,as we were asked to mention in our previous paper:“After airdrying,the soil samples were ground to pass through 1-mm nylon mesh, and subjected to assays to determine the soil pH and available nutrients(Bao,2008),although it is better to use 2-mm sieve,the world widely used method,here,for the possible comparison with results from others in China,where the 1-mm sieve method is widely used”(Huanget al.,2019).The results of this study revealed that the available micronutrient concentrations obtained by the 1-and 2-mm sieving methods were comparable,and previously archived soil samples passed through a 1-mm mesh sieve could be used to determine micronutrient availability and evaluate the changes in soil nutrients under several experimental designs,particularly long-term field experiments in China,as mentioned by Gonget al.(2011)and Zhanget al.(2013).More importantly,this finding also provides an opportunity for scientists and researchers from other countries to compare and interpret their results with those from China andvice versa.
CONTRIBUTION OFAUTHORS
Tingmiao HUANG and Yixuan WANG contributed equally to this work.
ACKNOWLEDGEMENTS
This research was supported by the National Key Research and Development Program of China(No.2018YFD 0200401),the China Agricultural Research System of MOF and MARA (CARS-03), the Science and Technology Innovation Fund Program of Shanxi Agricultural University,China(No.2020BQ72),and the Incentive Funding Research Program for Doctor Graduates Working in Shanxi Province,China(No.SXBYKY2021030).We gratefully acknowledge the CARS extension staffand local farmers for their assistance with the soil sample collection.
SUPPLEMENTARY MATERIAL
Supplementary material for this article can be found in the online version.
杂志排行

Pedosphere的其它文章
- Genomic characterization of multidrug-resistant extraintestinal pathogenic Escherichia coli isolated from grain culture soils
- Soil compression influences the avoidance behavior of Allonychiurus kimi(Collembola)to cadmium and copper
- Carbon mineralization in subtropical alluvial arable soils amended with sugarcane bagasse and rice husk biochars
- Key variable for simulating critical nitrogen dilution curve of wheat:Leaf area ratio-driven approach
- CO2 emission and source partitioning from carbonate and non-carbonate soils during incubation
- Co-inoculation of indigenous Pseudomonas oryzihabitans and Bradyrhizobium sp.modulates the growth,symbiotic efficacy,nutrient acquisition,and grain yield of soybean