Key variable for simulating critical nitrogen dilution curve of wheat:Leaf area ratio-driven approach
2022-04-16KeZHANGJifengMAYuWANGWeixingCAOYanZHUQiangCAOXiaojunLIUandYongchaoTIAN
Ke ZHANGJifeng MAYu WANGWeixing CAOYan ZHUQiang CAOXiaojun LIU∗and Yongchao TIAN∗
1National Engineering and TechnologyCenter for Information Agriculture,Nanjing Agricultural University,Nanjing 210095(China)
2Engineering Research Center of Smart Agriculture,Ministryof Education,Nanjing Agricultural University,Nanjing 210095(China)
3KeyLaboratoryfor Crop System Analysis and Decision Making,Ministryof Agriculture and Rural Affairs,Nanjing Agricultural University,Nanjing 210095(China)
4Jiangsu KeyLaboratoryfor Information Agriculture,Nanjing Agricultural University,Nanjing 210095(China)
5Jiangsu Collaborative Innovation Center for Modern Crop Production,Nanjing Agricultural University,Nanjing 210095(China)
ABSTRACT Nitrogen(N)dilution curves,a pivotal tool for N nutrition diagnosis,have been developed using different winter wheat(Triticum aestivum L.)tissues.However,few studies have attempted to establish critical nitrogen(Nc)dilution curves based on the leaf area ratio(LAR)to improve the monitoring accuracy of N status.In this study,three field experiments using eight N treatments and four wheat varieties were conducted in Jiangsu Province of China from 2013 to 2016.The empirical relationship of LAR with shoot biomass(expressed as dry matter)was developed under different N conditions.The results showed that LAR was a reliable index,which reduced the effects of wheat varieties and years compared with the traditional indicators.The N nutrition index(NNI)based on the LAR approach(NNI-LAR)produced equivalent results to that based on shoot biomass.Moreover,the NNI-LAR better predicted accumulated N deficit and best estimated the relative yield compared with the other two indicator-based NNI models.Therefore,the LAR-based approach improved the prediction accuracy of Nc,accumulated N deficit,and relative yield,and it would be an optimal choice to conveniently diagnose the N status of winter wheat under field conditions.
KeyWords: agronomic parameter,grain yield,leaf area index,nitrogen nutrition index,nitrogen status,nitrogen use efficiency
INTRODUCTION
Nitrogen(N)is a major nutrient for crop growth and yield production(Van Herwaardenet al.,1998;Wanget al.,2018).Diagnosing the N status of crops is necessary to detect the asynchrony between N availability and crop demandin situ(Demotes-Mainardet al.,2008).Adjusting the dose and time of fertilizer application based on plant N-related indicators,such as plant N accumulation, leaf N accumulation, N nutrition index(NNI),etc.,could improve N use efficiency(Liuet al.,2002).
In the past few decades,N accumulation-related diagnostic indexes have been used to diagnose crop growth status(Ntamatungiroet al., 1999; Liuet al., 2014; Wanget al.,2014).However,these indicators are limited by crop growth stage(Donget al.,2001),crop variety(Prasad and Prasad,1980),agricultural site(Paret al.,2006),fertilizer dosage(Malhiet al.,2014),and soil environmental factors(Donget al.,2001).Therefore,more agronomists have been focusing on using N concentration-related indicators (such as leaf or plant N concentration) to estimate the N status of crops(Nichols and Keeney,1976;Penget al.,1993;Lemaireet al.,1997,2008;Roggyet al.,1999;Ata-Ul-Karimet al.,2016,2017b).
Several studies have shown that there is a decrease in N concentration during the growth period(Lemaireet al.,1997,2008;Ata-Ul-Karimet al.,2017b).Justeset al.(1994)used crop biomass to predict the dilution trends of plant N concentrations in field crops,as follows:

where DM is the amount of crop biomass expressed as dry matter accumulated in the shoots in t ha−1;Ntis the total N concentration in crop biomass in % DM; andaandbare the regression coefficients.The critical N(Nc)dilution curve based on whole crop biomass is a direct consequence of the “structuralvs.metabolic” compartment dynamic.Researchers have applied the crop N dilution approach usingdifferent tissues to develop specific curves,such as leaf or stem(Ata-Ul-Karimet al.,2017b),ear(Zhaoet al.,2018),or panicle(Zhaoet al.,2016b).However,the curves based on specific organs to diagnose the crop N status are restricted to specific growth stages,most of them until flowering(Wanget al.,2014;Ata-Ul-Karimet al.,2017b).
The N dilution curves are related to phenological stages more than to crop biomass accumulation(Zhanget al.,2020).Additionally,leaf area ratio(LAR),the leaf to stem or leaf area to crop biomass ratio,affects N dilution(Ata-Ul-Karimet al., 2017b; Ratjenet al., 2018).Lemaireet al.(2019)indicated that the leaf area divided by shoot biomass was relevant for N dilution.In Gramineae(wheat,barley,maize,sorghum, and rice), the specific leaf area declines as the number of leaves increases and this leads to an allometric decline in surface area with crop biomass.However,as the size of new leaves progressively reduces,specific leaf area progressively increases,compensating for a decrease in the leaf to stem ratio.Thus, the adjustment of leaf area index(LAI)for specific leaf area greatly increases the accuracy of prediction across the different genotypes at different growth stages,but this correction is incomplete because it does not take into account the associated effect of a leaf to stem ratio at the whole crop level.
As reported in some studies, LAR can act as a valuable tool to explore crop N status (Lemaireet al., 2007;Ratjenet al.,2018);however,few studies have introduced this parameter into the Ncdilution models.Therefore,the objectives of this study were to 1) demonstrate that LAR allometry drives N dilution curve in wheat,2)compare the Ncdilution curves based on three indicators(LAR,DM,and LAI), and 3) evaluate the efficiency of an LAR-based Nccurve for N status diagnosis in wheat.
MATERIALS AND METHODS
Experimental design and crop management
Field experiments(Experiments 1,2,and 3)of eight N application rates(0,90,120,180,225,270,330,and 360 kg N ha−1)and four winter wheat cultivars were conducted at three agricultural sites(Rugao,Huai’an,and Sihong)situated in Jiangsu Province of eastern China from 2013 to 2016.The treatments were imposed in a completely randomized block design with three replicates in all experimental sites.For these experiments, winter wheat was planted between the 5th and 15th of November each year,after the rice had been harvested.The size of each plot was 6m×8 m(48 m2)with a row spacing of 0.25 m.In all experiments,urea as an N fertilizer was applied,50%before sowing as a base fertilizer and 50%at the jointing stage as a topdressing fertilizer.Soil samples were collected from a depth of 20 cm (potential root zone)before fertilizer application for all plots.For all the treatments,phosphorus and potassium fertilizers were incorporated into the soil before sowing as monocalcium phosphate(Ca(H2PO4)2,105 kg P2O5ha−1)and potassium chloride (KCl, 135 kg K2O ha−1), respectively.Detailed information is summarized in Table I.
The study sites were typically characterized by a subtropical monsoon climate with hot and rainy summers and mild and light rainy winters.Locally,the period of maximum vegetative growth of durum wheat was from February to May(jointing to anthesis;60th to 140th day of the year)(Fig.1).Rainfall-related water quality parameters were considered from the cumulative daily rainfall data corresponding to the analysis period.In the present study,the cumulated rainfall of the three sites ranged from 812 to 1 143 mm (Fig.1).The daily distribution of rainfall varied considerably among the three sites.Similar changes were observed among the sites in terms of dew point temperature(Fig.1),which is an important indicator to evaluate the growing conditions of the agricultural sites.

Fig.1 Climatic conditions,including daily temperature,precipitation of every month,and dew point temperature,of the three study sites(Rugao,Huai’an,and Sihong in Jiangsu Province,eastern China).
Sampling and measuring
Plant samples(20 plants per plot)were harvested during the vegetative phase at spring regrowth,tillering,jointing,booting,and heading stages.The plant samples were split into leaf (green leaf blade), stem (culm plus sheath), andspike.The green leaf area was measured with a leaf area meter(Li-3050,LI-COR,Lincoln,USA)and expressed as LAI.All the samples were oven-dried at 105°C for 30 min to halt the metabolic processes and then dried at 80°C in a forced-draft oven until reaching a constant weight.Each sample was then ground into powder,passed through a 1-mm mesh sieve in a Wiley mill,and stored at room temperature(approximate 25°C)for further chemical analysis.The plant samples(0.2 g)were digested with H2O2and H2SO4.The N concentrations in leaf,stem,and panicle were measured(Zhaoet al.,2016b)using a continuous-flow auto-analyzer AA3(Bran+Luebbe,Hamburg,Germany).Grain yield was recorded at maturity by harvesting 1 m2of winter wheat and drying it to a moisture content of 14%.

TABLE IDetailed information of all the experiments conducted to evaluate plant N index in Jiangsu Province,eastern China
Statistical analysis
For each sampling date,year,and cultivar,the DM,corresponding tissue N concentrations,and LAI were subjected to an analysis of variance using the general linear model procedure in IBM SPSS version 20.0 (IBM Corporation,Armonk,USA).The data from Experiments 1 and 2 were mainly used to develop the model, while the data from Experiment 3 was used to test the model.
Linear regression analysis was performed to evaluate the relationship between NNI and accumulated N deficit(AND)during the different vegetative phases using GraphPad Prism 5(GraphPad Software,San Diego,USA).
Spurious correlations,which are caused by data transformations,do not reflect meaningful properties of the underlying data.Therefore,spurious correlation analysis is very important for assessing non-independent variables(Brett,2004).In regression analysis,theXandYvariables should always be independent to avoid the risk of spurious correlation when analyzing non-independent variables.In this study,the regression ofXagainstY/Xwas analyzed,and Eq.2 was used,assumingr=0(Brett,2004):

where CV is the coefficient of variation.
Construction of N dilution curves
The Ncdilution curve was constructed following the procedure proposed by Justeset al.(1994),using N-limited or N-non-limited data points defined by N recommendations of the study sites(Zhaoet al.,2016b).If statistical analysis distinguished at least one set of sub-optimal N and one set of supra-optimal N growth data points on the same measurement date,this series of data were used to define the Ncdilution curve.An allometric function based on a power regression model(Freundlich model)(Justeset al.,1994)was used to determine the relationship between the observed decrease in plant N concentration and an increase in DM or LAI.For LAR, a new regression model was introduced in this study.Each Ncwas determined by the inflection point of the dilution curve.We used multiple comparison tests to detect significant differences atP <0.05 between the pairwise treatments.
The maximum N(Nmax)and minimum N(Nmin)dilution curves were developed to set the upper and lower limit curves.Data points from the N-non-limited and N-limited treatments of Experiments 1 and 2 were selected to construct the Nmaxand Nmindilution curves,respectively.
Indicators
To characterize the N status of plants,NNI was calculated using Eq.3(Justeset al.,1994):

If NNI = 1, then N nutrition was considered to be optimal,while NNI>1 and NNI<1 indicated excessive andinsufficient N nutrition,respectively.The AND(kg ha−1)at different growth stages was calculated using Eq.4, as proposed by Ata-Ul-Karimet al.(2013):

where Ncnarepresents the N accumulation under critical N growth conditions and Nnarepresents N accumulation under different N levels.If AND=0,then plant N nutrition was considered to be optimal, while AND>0 and AND<0 indicated insufficient and excessive plant N nutrition,respectively.
An allometric relationship was established between crop LAI expansion and crop biomass(expressed as DM)accumulation using Eq.5(Lemaireet al.,2007):

wherekandαare the coefficients.
Leaf area ratio was calculated as the ratio of crop LAI to crop biomass(expressed as DM)(Lemaireet al.,2019)as follows:

where LAI represents green leaf area under different N levels and crop biomass is the aboveground dry matter.The method used to determine the LAR critical value is similar to the method used to calculate the critical N concentration.
Relative yield(RY)was calculated using Eq.7(Ata-Ul-Karimet al.,2016):

whereYirepresents the yield under different N levels andYmaxrepresents the maximum yield at each site.
Model performance evaluation
The coefficient of determination(R2),root mean square error(RMSE),and Akaike information criterion(AIC)were used to assess the stability of the models developed in this study.

wherenis the number of test samples;Piis the model estimate ofith test sample; andQiis the observed value ofith test sample.The AIC is a likelihood ratio statistic with a degree-of-freedom adjustment that provides values for model selection(Akaike,1973).The AIC values were calculated using the R language.The model with the lowest AIC value and higher Bayesian information criterion(BIC)value were considered to be the optimal model(Bozdogan,1987).On the other hand, the standard error of estimate(SEE)represents how large the prediction errors(residuals)are for the dataset in the same units asY,or how wellYcan be predicted.
RESULTS
General wheat productivity
The four varieties of wheat used in this study were those used locally in this region(Table II).The seeds of the different wheat varieties were sown in plots under rainfed conditions and irrigated to avoid water stress during wheat growing.The effective spike number, grain number per spike, and thousand grain weight were similar among the varieties,while gluten concentration was different.Among these four varieties, the grain yield of Xumai 30 was not significantly different(7.65 t ha−1)than those of the other varieties(6.92–7.07 t ha−1).The same variety had different growing characteristics because it grew in different eco-sites,which increased the diversity of the input data.
Analysis of leaf area ratio
To avoid the effect of a spurious correlation, we first tested the spurious component to explore the relationship between LAR and DM(shoot biomass).Figure 2 shows the changes in the CV andXCV/YCV,with theirR2calculated from different growth conditions.The analysis revealed an appropriateR2with smaller CV and negative values of regression.The shared term CV was small,and therefore,spurious correlations were generally small.This indicated that the sample size in this study had only a modest impact on the magnitude of spurious correlations,as the measurement error for the shared variable was smaller than half of the CV for that variable.

TABLE IIGeneral performance of the winter wheat varieties used in the study
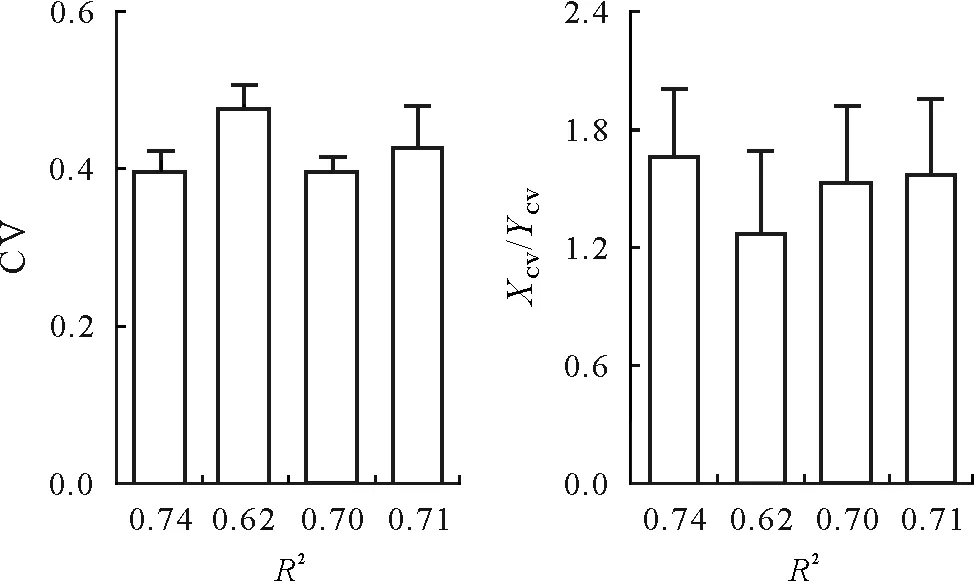
Fig.2 Results of Monte Carlo simulation for the case X vs.Y/X and the impact of distance in variability between the shared and non-shared terms for each of the four types of regressions considered in this study,by which the coefficient of determination(R2)was calculated.Vertical bars represent standard deviations of the means(n=3).CV=coefficient of variation.
Four varieties were used to develop the power function model between DM and LAR(in range from 0.25 to 1.72).Data points of the different varieties were well-distributed along the curve(Fig.3).The LAR/DM relationship in wheat was similar under different N rates(Fig.3a–c).This indicates that the dynamic model is unique.HighR2values(0.88–0.93) with low AIC values (125–135) indicate that the developed model is appropriate to simulate the relationship between DM and LAR.The optimal LAR based on DM was 1.61DM−0.50in critical N condition,1.24DM−0.48in N-limited condition, and 1.64DM−0.39in N-non-limited condition(Fig.3d).
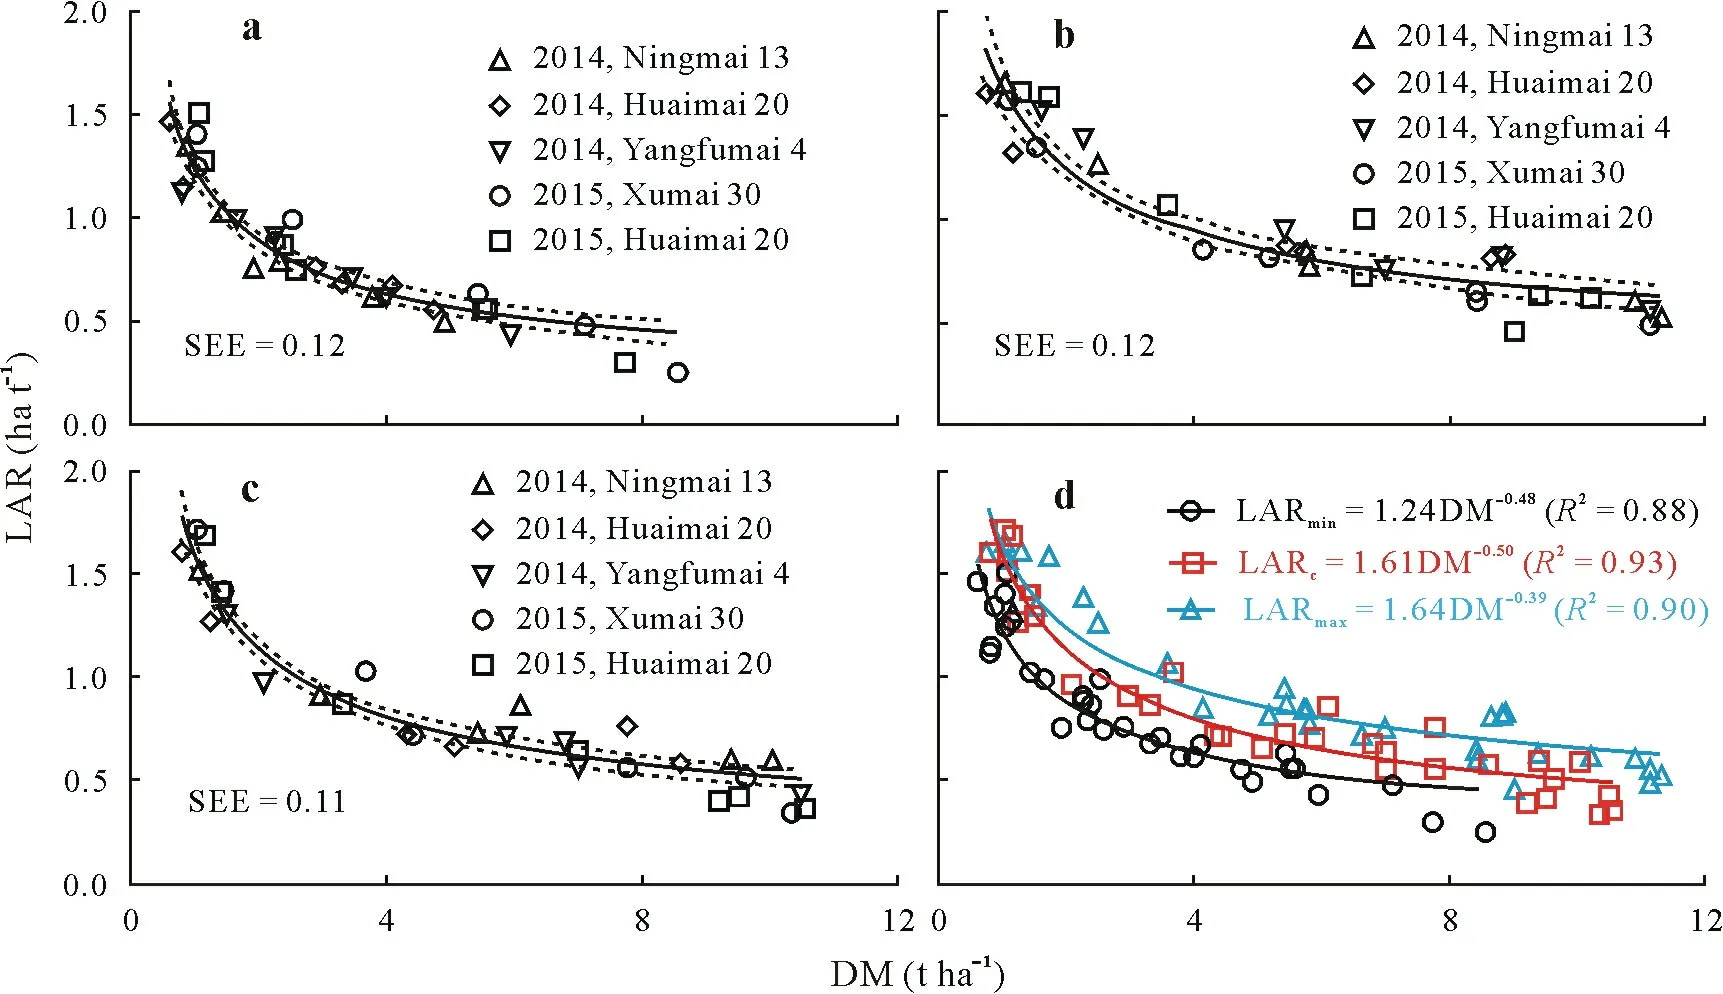
Fig.3 Leaf area ratio(LAR)of four wheat varieties in the function of shoot biomass(expressed as dry matter,DM)under different N nutrient conditions in the field experiments,Experiments 1 and 2,in 2014 and 2015:N-limited(a),N-non-limited(b),critical N(c),and all relationships between LAR and DM(d).LARmin,LARc,and LARmax are the LAR values obtained under the N-limited,critical N,and N-non-limited conditions,respectively;SEE=standard error of estimate;R2 =coefficient of determination.
Critical,maximum,and minimum N dilution curves based on different indicators
To find the optimal linear regression model, we used different methods,namely,population linear regression model,a standard deviation ofXandY,ordinary least squares,and weighted least squares,to determine the statistical fit of the LAR-based N dilution curve.No significant difference was found among the different methods (R2= 0.957,Fvalue=670.24).However,the population linear regression model showed a slightly higherR2(0.958) andFvalue(682.75).Therefore,it was selected as a model(Table III).

TABLE IIIPerformance of different methods to fit N dilution curves
The data from Experiments 1 and 2 were used to construct three critical N dilution curves based on three different indicators:LAI,DM,and LAR(Fig.4).For the same range of Nc,LAI varied from 0.67 to 7.22,DM from 0.75 to 11.32 t ha−1,and LAR from 0.33 to 1.72 ha t−1.The coefficientsaandbfor the N dilution curves ranged from 1.83 to 3.89 and−0.65 to 0.94, respectively.Among these curves, the LAR-based N dilution curve was the most significant(R2=0.90–0.96).

Fig.4 Comparisons of the minimum,critical,and maximum N(Nmin,Nc,and Nmax,respectively)dilution curves in wheat based on three different indicators,leaf area index(LAI),shoot biomass(expressed as dry matter,DM),and leaf area ratio(LAR).The data from field experiments,Experiments 1 and 2,in 2014 and 2015 under N-limited,critical N,and N-non-limited conditions were used to construct the Nmin,Nc,and Nmax dilution curves,respectively.Nt =total N concentration in shoot biomass in%DM;R2 =coefficient of determination.
The Ncdilution curve was validated for both N-limited and N-non-limited situations.The growth rate and wheat variety did not affect Nc.The data points from Experiments 1 and 2 that were not used to establish the parameters of the allometric function were used to partially validate the curve.Independent data points from the experiments conducted at different sites were used to validate those curves.The Ncdilution curve discriminated between N-limited and Nnon-limited conditions.All points from N-limited treatments were close to or below the Ncdilution curve, while those from N-non-limited treatments were close to or above the Ncdilution curve under the three different indicator-based conditions.However,these three Nccurves were different from each other.The LAI-and DM-based Ncdilution curves were a standard power function,while the LAR-based Ncdilution curve was linear(Fig.4).However,the LAR-based Nccurve gave a better fit than the other indicators based on the model assessment parameters AIC and BIC.
Table IV shows that the regression coefficientsaandbof the LAI-and DM-based Ncdilution curves significantly differed among varieties and years,whereas the LAR-based Ncdilution curve was not influenced by varieties and years.The standard error of the three indicators revealed that the LAR-based curve was more reliable than the others due to its lower values across years and varieties.Therefore,LAR was considered to be a stable indicator for developing the critical N dilution curve.
Relationships between DM-based NNI and LAI-and LARbased NNI
The NNI can be derived from the Ncdilution curve at each growth stage and used for the accurate and real-time diagnosis of plant N status.Figure 5 compares the NNI values obtained with the three indicators(LAI,DM,and LAR)under different N application rates for the four retained growth stages (spring regrowth, booting, jointing, and heading).Overall, an increasing N application rate helped increase NNI for all the derived-indicators at all the growth stages.The DM-based NNI was most positively influenced by the N fertilization,whereas the LAI-based NNI was less affected,particularly at the heading growth stage.
The relationships between DM-based NNI and LAIand LAR-based NNI under different N application rates are shown in Fig.6.The abscissae of the Nccurve refer to the NNI calculated on the basis of shoot DM,while the ordinates refer to the NNI calculated on the basis of LAI or LAR.TheR2values were higher with LAR-based NNI than with LAI-based NNI for all N application rates except 0 kg N ha−1.Overall,LAI-based NNI values tended to be lower than DM-based NNI values,while LAR-based NNIvalues were almost similar to DM-based NNI values across all N application rates.The slope of the LAI models ranged from 0.62 to 1.19,whereas the slope of LAR models was constant at 0.9,except for the N application rate of 120 kg N ha−1.This indicates that the LAR-based Nccurve can be considered as an effective tool to calculate NNI.
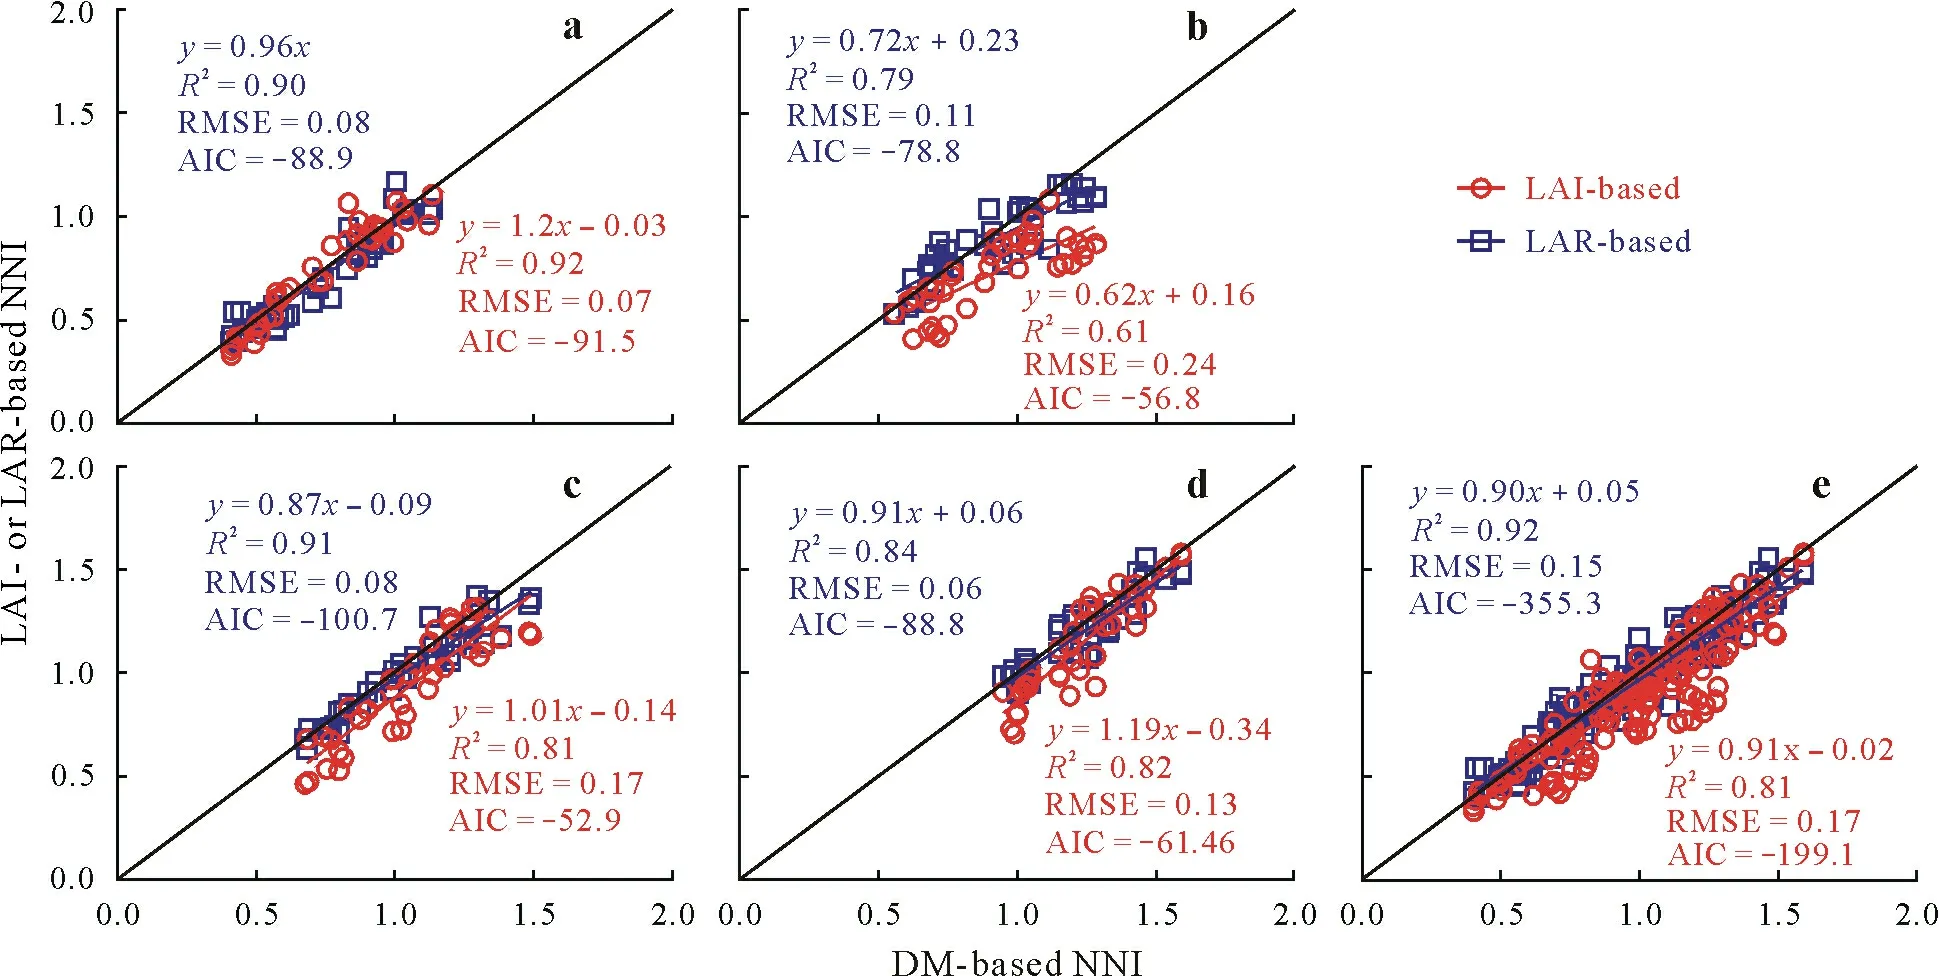
Fig.6 Relationships between N nutrition index(NNI)based on shoot biomass(expressed as dry matter,DM)and those based on leaf area index(LAI)and leaf area ratio(LAR)under N application rates of 0(a),120(b),225(c),and 360 kg N ha−1 (d)and all N treatments(e).R2 =coefficient of determination;RMSE=root mean square error;AIC=Akaike information criterion.

TABLE IVAnalysis of variance for the regression parameters of the three indicators used to develop critical N dilution curves of different winter wheat varieties in field experiments in different years(2014–2016):leaf area index(LAI),shoot biomass(expressed as dry matter,DM),and leaf area ratio(LAR)
Accumulated N deficit with the three Nc dilution curves
The AND is commonly used to illustrate the N nutrition status of crops.The AND values obtained from our newly-developed curves effectively distinguished deficient,optimal, and excessive N nutrition conditions in wheat.These indices can be calculated during all vegetative growth periods and be used as diagnostic tools in N fertilization management.Generally, a negative linear correlation was exhibited between NNI and AND for all the three indicators under the four N application rates(Fig.7).Under the rate of 0 kg N ha−1,the majority of data points were in the N deficit region,while under the rate of 360 kg N ha−1,the majority of data points were in the N sufficient region.For the two intermediate N application rates,approximately half of the points were in the N deficient region and the other half were in the N sufficient region.Based on theR2and model evaluation parameters AIC and BIC,the LAR-based NNI gave similar to slightly better results than the DMand LAI-based NNI.When N was deficient,the optimum prediction effect was obtained.However,the accuracy of the prediction model decreased once the N was in excess withR2from 0.94 to 0.58.Therefore,we should further explore the application of the NNI-based N-deficient model under N excessive conditions.
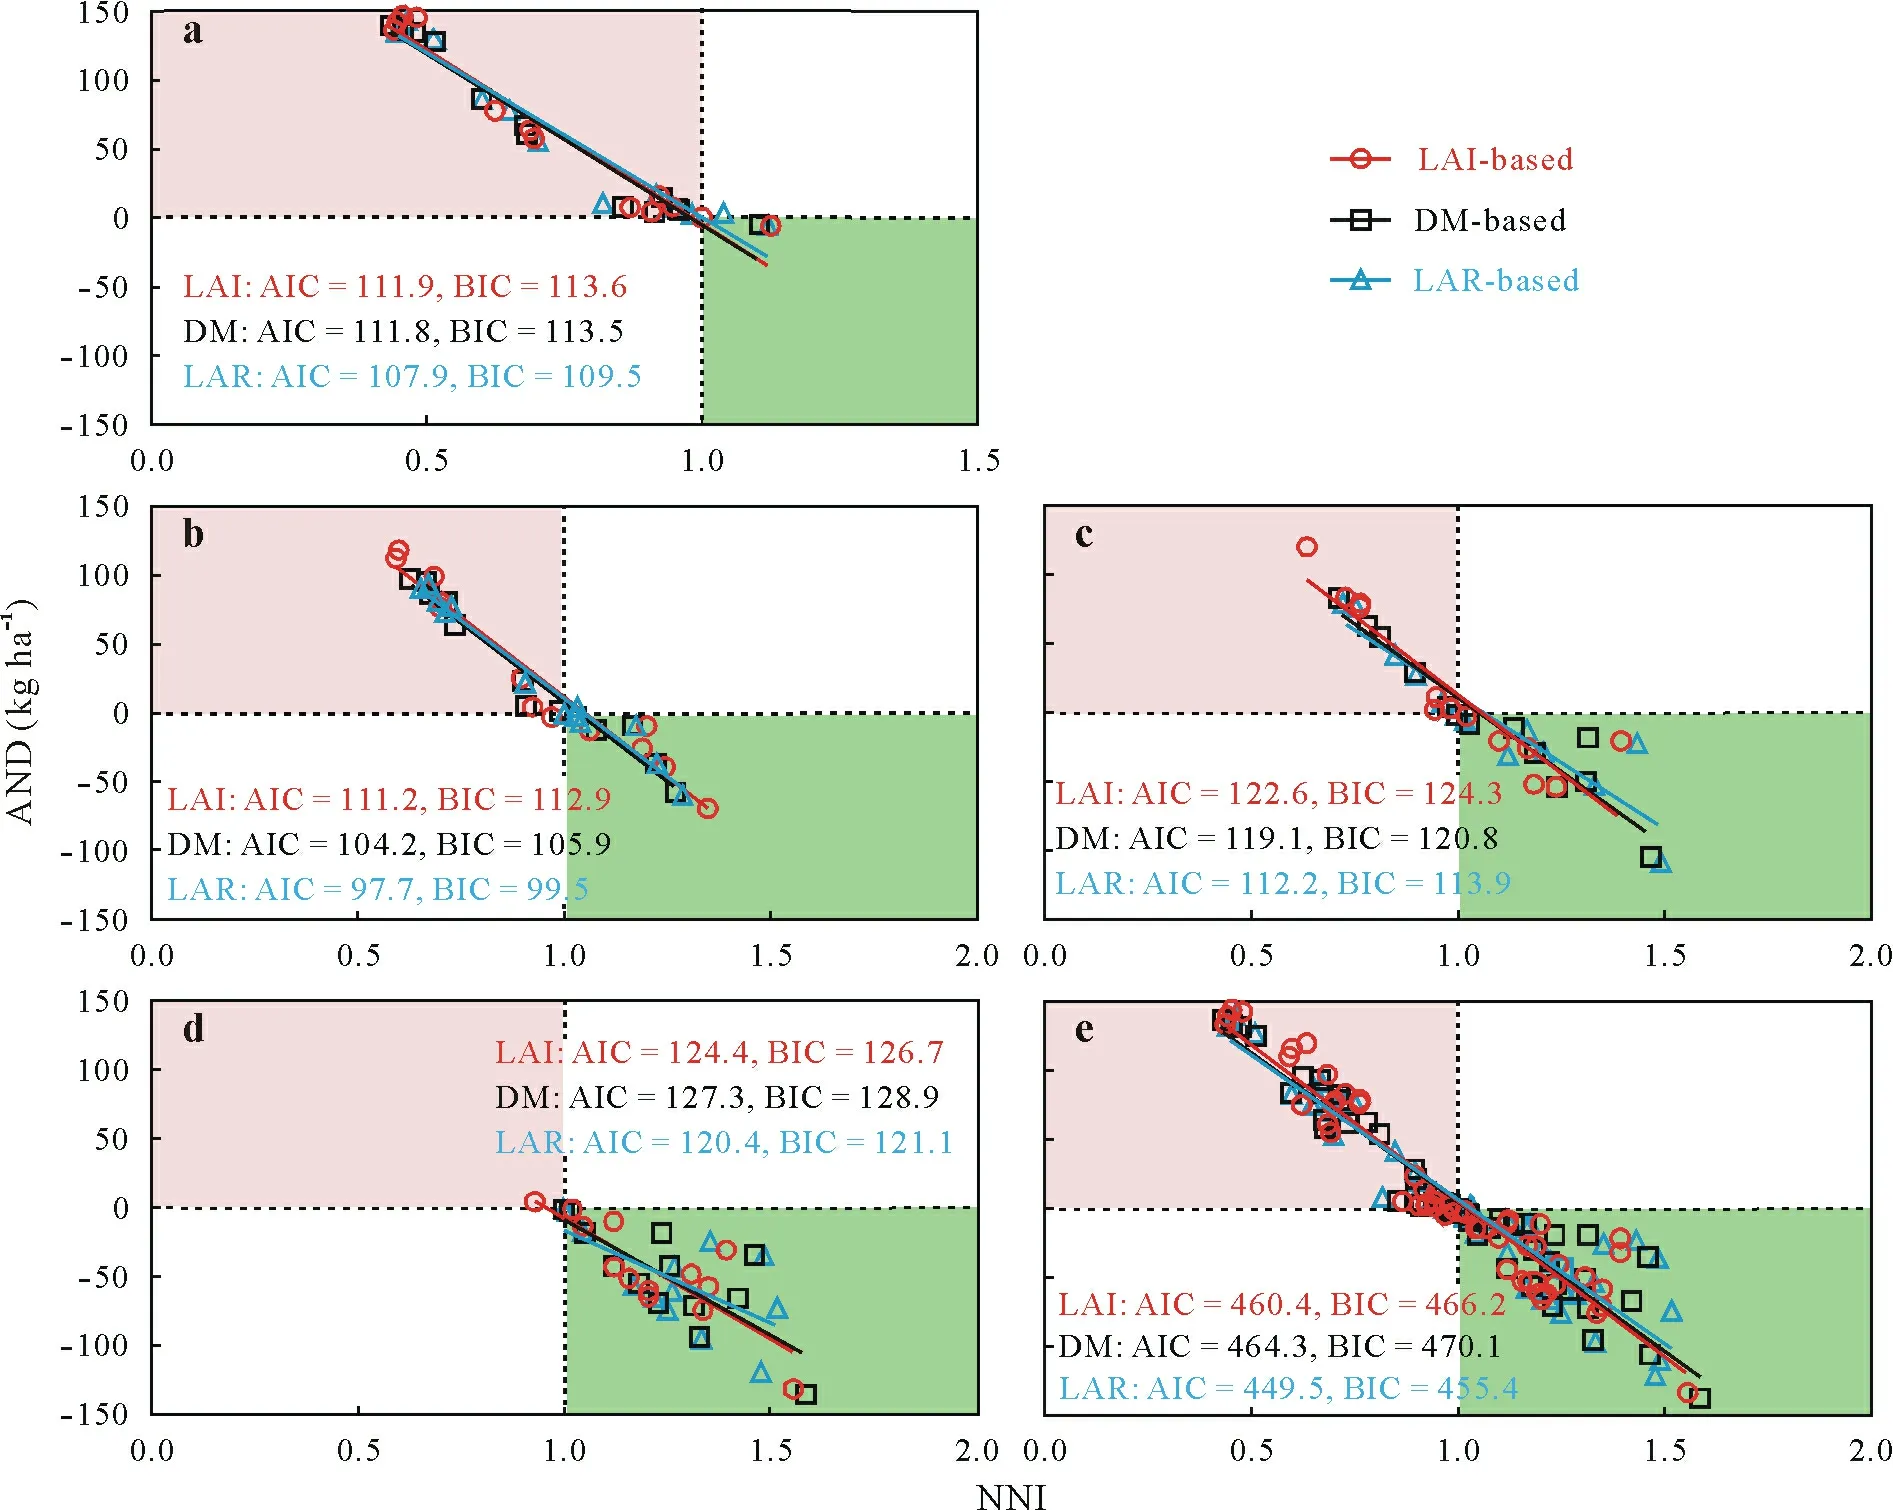
Fig.7 Relationships between accumulated N deficit(AND)and N nutrition index(NNI)based on leaf area index(LAI),crop biomass(expressed as dry matter,DM),and leaf area ratio(LAR)under N application rates of 0(a),120(b),225(c),and 360 kg N ha−1 (d)and all N treatments(e).The red area means deficient N,and the green area means sufficient N.AIC=Akaike information criterion;BIC=Bayesian information criterion.
Relationships between relative yield and NNI from the three different Nc dilution curves
An in-season estimate of grain yield in wheat will benefit farmers and processing industries to quantify the product supply and market price under different agrometeorological conditions and agronomic practices.The relationship between RY and NNI during the vegetative growth period was used to estimate grain yield.Using the three Ncdilution curves,we can express RY as a quadratic function of NNI during different vegetative growth stages.
In this study,theR2values and inflection points were used to compare the performance of different indicator-based NNI and to identify the best prediction model to estimate RY.NNI=1 was the threshold value using LAR,whereas NNI>1 was the threshold value using the other two indicators(Fig.8).The LAR-based curve had the highestR2and the lowest AIC value.Thus, we propose that the LAR-based curve is the best prediction model to estimate the wheat grain yield.

Fig.8 Relationships between relative yield(RY)and N nutrition index(NNI)based on leaf area index(a),crop biomass(expressed as dry matter)(b),and leaf area ratio(c)at different growth stages of wheat.R2 =coefficient of determination;AIC=Akaike information criterion.
DISCUSSION
Diagnosing crop N nutrient status is a key step in crop fertilization management.The Ncdilution curve is generally used to diagnose plant N nutrition status (Lemaireet al.,2019).The present study provides important findings to develop the Ncdilution curve for winter wheat based on different indicators.
Comparison of Nc dilution curves with different indicators
The N dilution process in crops (C3 and C4, monocotyledonous and dicotyledonous)is driven by the allometry between LAI expansion and crop biomass accumulation(Lemaireet al.,2007),which acts as an important indicator of crop growing.During the vegetative phase,an increasein crop biomass leads to a parallel decline in both LAR and plant N concentration(Ratjenet al.,2018).The relative LAI expansion rate is lower than the comparative growth rate,which results in a progressive decrease in LAR.Ratjenet al.(2018)demonstrated that the power function between DM and LAR had a relatively highR2(0.88–0.93) in an experiment using different wheat varieties under different N nutrition conditions(deficient,critical,and excessive)at two sites.Penget al.(1993)used specific leaf weight to correct SPAD(soil and plant analyzer development)value,which improved the accuracy of Ncprediction in rice.This study used different crop biomasses to correct LAI and enlarged the difference among groups, which was proved to be an effective approach to decrease the impact of environmental conditions and plant varieties.
Here,we also compared the newly developed N dilutioncurves based on three different indicators and evaluated their potential to assess wheat N status in order to find a reliable method to estimate N nutrition in real-time.The N concentration-DM dilution curve paralleled the LAR-DM dilution curve.The LAR-based dilution curve had a higherR2and a lower AIC value compared with the LAI-and DMbased curves.The relationship between Ncand LAR differed from the standard power function and was best described by a linear function.We found that LAR declined with an increase in biomass,which was also observed by Ratjenet al.(2018).During earlier growth stages,leaf area expands at a faster rate than dry matter growth(Van Den Boogaardet al.,
1996);however,in later growth stages,leaf area decreases due to leaf senescence,while DM continues to increase(Hu and Schmidhalter,2008).Furthermore,to fit the Ncdilution curve to the dataset of Experiments 1 and 2, parameterasignificantly differed among the varieties and years in LAIand DM-based approaches, while it was constant in the LAR-based approach.This difference could be related to the differences in climatic conditions and varieties.Justeset al.(1994) obtained similar curves in Belgium and in France,while these relationships differed in Sweden,with points below the curve of France.The length of growing seasons in different regions suggests that winter wheat has a great capacity for N accumulation and dilution(Zhaoet al.,2016b).Since the parameteraof dilution was unaffected by year and the relationship was simpler and highly significant with Nc,LAR could be a more reliable plant indicator for Ncprediction than LAI and DM.
Comparison between NNI and AND from different Nc dilution curves
The DM-based NNI and AND values obtained from our newly developed curves effectively distinguished deficient,optimal, and excessive N levels for wheat growth.These indices can be measured during all vegetative growth stages and be used as diagnostic tools to support N fertilization management(Liuet al., 2017; Zhanget al., 2017), while N applied during the reproductive period was slightly less effective.
The DM-based NNI was more reliable than the LAIand LAR-based NNI in rice(Ata-Ul-Karimet al.,2017b),and it was used as a reference to measure the performance of LAI-and LAR-based NNI in wheat.The LAR-based NNI was close to the DM-based NNI for all the different growth stages.Under the different N treatments,the LAR-based NNI also fitted the 1:1 line with lower RMSE values(0.06–0.15)(Fig.6).
Similar AND values were calculated for LAI-,DM-,and LAR-based NNIs under the four different N treatments.The N-deficit situation was maintained throughout the growth cycle in the treatment with 0 kg N ha−1, whereas the Nexcessive situation was present during most of the stages in the treatment with 360 kg N ha−1.The three indicator-based prediction models were successful.
The present study indicated that the LAR-based approach was the best alternative to a DM-based approach.However,a more effective,efficient,and convenient method that consumes less time should be explored for use in precision agriculture.Therefore,future studies should investigate the correlation between LAR with other vegetation indexes(e.g.,normalized difference vegetation index and ratio vegetation index)for accurately monitoring N concentrations.
Application of NNI
The NNI is an effective index used to diagnose crop nutrition status(Zhanget al.,2019b)and to predict the effect of N fertilization on crop yields(Liuet al.,2017).Higher yields are generally associated with higher plant Nc;however,an excessive application of N does not necessarily increase crop yields(Zhanget al.,2019a).In wheat,a positive linear correlation was found between NNI and RY until it reached a plateau,where RY did not further increase.However,slight differences were observed between the different indicatorbased prediction models.Indeed, the slope of the linear function differed,and the threshold at which the plateau was reached varied from 1.0 with LAR to 1.1 with DM and LAI.Studies have used NNI for the in-season prediction of RY in crops like corn(Ziadiet al.,2008),sunflower(Debaekeet al., 2012), barley (Zhaoet al., 2016b), and rice (Yuanet al., 2016).This relationship based on the Ncdilution curve supports N fertilization management decisions(Ata-Ul-Karimet al., 2017a).The results of the present study suggest that the LAR approach might be the most reliable indicator for wheat grain yield prediction.However,the realtime determination of DM and LAI is an obstacle to the use of NNI as a diagnostic tool.Therefore,future studies should focus on the use of non-destructive diagnostic techniques,such as remote sensing, under a unique drone or satellite platform,to estimate DM and N concentrations.
CONCLUSIONS
This study demonstrated that the use of LAR(the LAI to DM ratio)allometry drove the N dilution curve in different wheat varieties at earlier growth stages.The LAI and DM values increased with wheat growth until booting,while the LAR value decreased.Therefore,the relationships between N concentration and the indicators (LAI, DM, and LAR)differed;the LAI-and DM-based Ncdilution curves were best described by a power function,while the LAR-based Ncdilution curve was a linear function.Due to its constancy throughout all the vegetative stages,regardless of variety and year,and its highR2and low AIC values,the LAR-based model was a better predictor of wheat N status than the LAI-and DM-based models.The relationships between NNI and RY based on the different indicators showed a high prediction efficiency, with the LAR-based NNI being the most optimal(NNI=1.0).In future studies,easier methods,such as using sensors or drones to evaluate LAR, should be used because sampling plants and chemically analyzing plant N are time-consuming.
ACKNOWLEDGEMENTS
We are grateful to Prof.Gilles Lemaire from the National Research Institute for Agriculture,Food and Environment(INRAE),France,Dr.Syed Tahir Ata-Ul-Karim from The University of Tokyo,Japan,and Dr.Xiaoling Wang from Nanjing Agricultural University,China,who have helped with the paper.This work was supported by the National Natural Science Foundation of China(No.32071903),the Earmarked Fund for Jiangsu Agricultural Industry Technology System,China(Nos.JATS(2020)415 and JATS(2020)135),the Fund of Jiangsu Agricultural Science and Technology Innovation,China(No.CX(20)3072),and the Jiangsu Provincial Key Technologies R&D Program of China(No.BE2019386).
杂志排行
Pedosphere的其它文章
- Variability in pattern and hydrogen isotope composition(δ2H)of long-chain n-alkanes of surface soils and its relations to climate and vegetation characteristics:A meta-analysis
- Synergy of remotely sensed data in spatiotemporal dynamic modeling of the crop and cover management factor
- Heterotrophy-coordinated diazotrophy is associated with significant changes of rare taxa in soil microbiome
- Impact of drilling waste pollution on land cover in a high subarctic forest-tundra zone
- Net ecosystem carbon exchange for Bermuda grass growing in mesocosms as affected by irrigation frequency
- Short-term biochar effect on soil physicochemical and microbiological properties of a degraded alpine grassland
