Magnetohydrodynamic effect of internal transport barrier on EAST tokamak
2022-04-15YuqiCHU储宇奇HaiqingLIU刘海庆ShoubiaoZHANG张寿彪LiqingXU徐立清ErzhongLI李二众YinxianJIE揭银先HuiLIAN连辉TianfuZHOU周天富XiFENG冯喜XuexiZHANG张学习YunfeiWANG王云飞XiangZHU朱翔ChenbinWU吴陈斌ShouxinWANG王守信YaoYANG杨曜HANADABoLYU吕波YingyingLI李颖颖Q
Yuqi CHU (储宇奇), Haiqing LIU (刘海庆), Shoubiao ZHANG (张寿彪),Liqing XU (徐立清), Erzhong LI (李二众), Yinxian JIE (揭银先),Hui LIAN(连辉),Tianfu ZHOU(周天富),Xi FENG(冯喜),Xuexi ZHANG(张学习),Yunfei WANG(王云飞),4,Xiang ZHU(朱翔),Chenbin WU(吴陈斌),Shouxin WANG (王守信), Yao YANG (杨曜), K HANADA, Bo LYU (吕波),Yingying LI (李颖颖), Qing ZANG (臧庆) and EAST Team,7
1 Institute of Plasma Physics, Hefei Institutes of Physical Science, Chinese Academy of Sciences, Hefei 230031, People’s Republic of China
2 University of Science and Technology of China, Hefei 230026, People’s Republic of China
3 University of California, Los Angeles, California 90095, United States of America
4 Interdisciplinary Graduate School of Engineering Sciences, Kyushu University, Kasuga 816-8580, Japan
5 Advanced Energy Research Center,Shenzhen University,Shenzhen 518060,People’s Republic of China
6 Research Institute for Applied Mechanics, Kyushu University, Kasuga, Fukuoka 816-8580, Japan
Abstract An internal transport barrier(ITB)can be formed on EAST in exploring high-parameter operation.Previous studies show that safety factor(q)profiles,Shafranov shift and magnetohydrodynamic behaviors could be helpful in ITB formation by suppressing anomalous transport.Recently,electron density evolution with high resolution demonstrates that fishbone could be dominant in electron density ITB formation and sustainment.The power threshold is low in the fishbone condition and the electron density profile is determined by traits of fishbone.Simulation shows that the low-k ion mode is suppressed by fishbone.Direct measurement of turbulence in the inner region shows that the internal kink mode could sustain an electron temperature ITB by suppressing the trapped electron mode.The multi-scale interaction between the kink mode and turbulence by current could be key in sustaining high-electron-temperature long-pulse operation.
Keywords: ITB, fishbone, kink mode, micro turbulence
1.Introduction
Future fusion devices like ITER are foreseen to be with 100%non-inductive current drive and the burning phase is expected to be up to 1000 s[1].As an intermediate process of exploration of steady-state operation,hybrid operation is always mentioned in several tokamaks.With lower plasma current for optimizing the high fraction of bootstrap current, the regime calls for improving core confinement beyond a solitary edge transport barrier.Thus, an internal transport barrier(ITB)with all these requirements is well worth studying.
ITBs have been studied broadly in various machines in recent years [2–9].In general, a reduction of anomalous transport could be the root cause of ITB formation.This can come from E×B flow[10,11],local zonal flow[12,13]and magnetic shear [14], etc [15, 16].To understand the detailed mechanism of ITB formation,the position of the ITB foot is a good candidate which could reflect what is playing a role here.In most cases,the ITB foot is always relevant to rational safety factor (q) surfaces [3].The effects of flow shear, magnetic island and magnetohydrodynamics(MHD)near here have been widely explored.In this work,further study of MHD activities on ITB formation is performed on the EAST tokamak.
An ITB has been observed on the EAST tokamak in recent years [17, 18] in both high-βNand high-βpexperiments, in which several MHD behaviors were observed.Double tearing mode is a typical factor leading to constrained deterioration[19].Fishbone and kink mode are emphasized with ITB formation and sustainment.Simulation shows that fishbone could deliver fast particles from the inner to outer region[20,21];a strong Ershear is generated in this process, leading to a local reduced turbulence,and ITB can be formed as a result.In this paper,an ITB with different characteristics of fishbone is shown as experimental verification.Moreover, the effect of the kink mode on turbulence suppression is studied.The remaining sections are arranged as follows.The experimental setup and related diagnostics are introduced in section 2.Section 3 discusses the effect of fishbone in EAST high-βNexperiments.The mechanism of the kink mode is presented on section 4.A discussion and summary are included in section 5.
2.Experimental setup
EAST is a superconducting tokamak with an ITER-like W/Cu top divertor and graphite bottom divertor, and ITER-like magnetic field configurations and heating schemes.EAST has major radius R=1.85 m and minor radius a=0.45 m[22, 23], and operates with toroidal magnetic field Bt≤3.5 T and plasma current Ip≤1 MA.All experimental plasma discharges reported in this paper are operated with upper single null divertor configuration.Augmented and reliable current drive and auxiliary heating capabilities are applied on EAST,including lower hybrid current drive with frequencies of 2.45 GHz and 4.6 GHz[24],neutral beam injection(NBI)with two beam injectors providing co-direction and counter-direction which influence plasma toroidal rotation velocity[25],and electron cyclotron resonance heating system to obtain a higher electron temperature, with which highly reproducible highperformance plasma with an ITB has been achieved on EAST.
The main diagnostics for physic analysis are shown in figure 1.Charge exchange recombination spectroscopy with a measuring point on the mid-plane is used to provide ion temperature and toroidal rotation profiles [26].Absolute measurement of the electronic temperature is achieved by a Thomson scattering (TS) system [27] whose measurement points are indicated by the blue circles in figure 1.The soft x-ray(SXR)system has a certain coverage area;the two green lines in figure 1 indicate its upper and lower boundaries,respectively, and combined with an electron cyclotron emission (ECE) system [28], the location of MHD can be accurately given.The measurement range of the ECE system covers the entire mid-plane, and here we use the data from its lowfield side as shown by green circles in figure 1.A polarimeter–interferometer(POINT)system is a powerful diagnostic system in plasma density and magnetic field measurement [29].As shown in figure 1, red lines imply the measurement chords of the POINT system with a spatial resolution of 8.5 cm,and the time resolution can be as high as 1 μs.The plasma density profile can be given by the Abel-inversion method with POINT measurements [30].By using the Faraday rotation by POINT as an additional constraint in EFIT code, the plasma current profile and q profile can be obtained [31].
3.Fishbone effect on electron density ITB discharges
Fishbone is a common MHD behavior on the EAST tokamak and it arises from excitation of the internal kink mode by trapped energetic ions[32,33].In EAST βNexperiments,fishbone with a central flat q profile is often observed with ITB formation[17, 18].Two typical shots are shown in figure 2.In these two shots,the plasma current is the same at 400 kA,and the toroidal magnetic field is 1.6 T.A 1 MW 4.6 GHz lower hybrid wave(LHW) is injected into the plasma at about 1.8 s and NBI is launched into the plasma from about 2.5 s.For shot #71320,four beams of NBI are used with four steps;their sequences are 1L (co-direction), 1R (co-direction), 2R (ctr-direction) and 2L(ctr-direction).In shot#71321,NBI 1L injects first at 2.5 s,and 1R injects at 3 s for about 0.35 s.After 0.15 s, NBI 2R starts a long-term injection from 3.5 s.In both shots, all NBI injection powers are same.A central channel density measurement of POINT serves as density feedback control; the line-integrated densities are both about 2.5×10¹⁹m-2.Due to the difference in heating power,different confinement qualities in the two shots
are presented.As shown in figure 2(b), a higher value of βNin shot #71320 could be attributed to the formation of ITB in channels of electron density, electron temperature and ion temperature [18].Confinement quality H98is shown in figure 2(d); the values of H98are greater than 1 in both shots.Moreover, edge-localized modes and clear density and temperature pedestals(figure 7 below)have been observed in these two shots, indicating that both of them are H mode discharges.
In both shots, with fishbone observed, electron density ITB has been observed.The spectrum of shot #71320 is shown in figure 3(a).Fishbone first appears with the second NBI injection; with NBI power increasing step by step, the magnitude of each burst of fishbone becomes larger and the burst frequency becomes higher.The second harmonic frequency indicates a very flat central q profile in this shot.The evolution of the density gradient is shown in figure 3(d); a sharp gradient is formed inside the position of ρ~0.2,which is in good agreement with the location of the fishbone.It is a similar situation for figure 4;the spectrum in figure 4(a)shows that the burst of fishbone frequency gradually becomes higher which leads to a stable electron density ITB formation.In these two shots, although with different heating powers, the formation of an electron density ITB is clear in both conditions.Comparing the gradients in figures 3(b) and 4(b), the magnitude of the density gradient is the same.Obviously,the power threshold required for ITB formation is not so high;compared with the discharges reported in[17,18],two beams of NBI are not required to generate the electron density ITB,and the power does not have a significant effect on the strength of the formed ITBs.The density profile evolution with a 3D plot is shown in figure 5;the similar profiles verify the low effect of heating power.Relative to the toroidal rotation velocity, fishbone is more correlated to electron density ITB formation.
In these two shots, the effects of Shafranov shift (α) and toroidal rotation on density ITB formation are not obvious.To verify the view, the toroidal rotation and Shafranov shift are shown in figures 2(h) and (i).As shown in figures 3 and 4, in both shots the input sequences of NBI are first in the codirection and then the counter-direction.Thus the toroidal velocity shown in figure 2(h) is continuously decreasing.In past studies, the toroidal rotation effect on density ITB formation is through increasing E×B flow,while the decreasing vtin figure 2(h) leads to decreasing E×B flow which is contrary to the increasing density gradient shown in figures 3 and 4.Therefore, we exclude toroidal rotation as the possible effect.For the Shafranov shift, the two shots are the same before 3.4 s at the same heating power and configuration,while with the difference in heating power from 3.4 s,the Shafranov shifts become different.α is proportional to (βp+li/2), thus the increase in α could be a result of increasing βp.Comparing these two shots,as shown in figure 5,they have similar density profiles,while the Shafranov shifts vary greatly.Moreover,for shot #71321, the value of the Shafranov shift at 4 s with a deeper density gradient is much smaller than that at 3.3 s, so the Shafranov shift is not suitable to be seen as the reason for density ITB formation.
In general, fishbone and other energetic particle modes could flatten fast ion pressure[21,34,35].In this process,due to the redistribution of fast ions, a local enhanced Erprofile can be inferred.Thus, turbulence like ion temperature gradient mode (ITG) and TEM could be suppressed; as a result,local anomalous transport reduces and density ITB could be formed.In figures 3 and 4, a typical increase in density gradient has a good correspondence with fishbone burst.Several isolated fishbone modes are selected in figures 3 and 4 which are marked by vertical dashed lines.In order to prove that this gradient change is not due to the particle discharge effect caused by fishbone, but from the better confinement of electron density,density profiles before and after the fishbone are shown in figure 6.Obviously,a little increase in density in the core verifies the positive effect of fishbone in particle confinement.
With the change in fishbone characteristics,shot#71320 is a good candidate shot for understanding transport induced by fishbone.Figure 7 shows profiles of three typical time slices in shot#71320 which correspond to different fishbone modes.In these three time slices, the q profiles are similar with characteristics including a central flat part in the core region and q0is about 1 as shown in figure 7(a).Density profiles in figure 7(b) are from inversion of the POINT system, and the boundary density coincides well with that from reflectometry.From 3.3 s to 4.6 s, as the fishbone frequency becomes higher,a stable electron density ITB gradually forms and is sustained.As seen in figure 7,Tiis higher than Te,and NBI in this shot is more efficient at ion heating.Thus,the ion temperature rises with each step of NBI injection and the gradient shows no big change.As studied in other works,electron temperature ITB in high-βNexperiments on EAST is related to q profiles and electron heating efficiency.Similar q profiles and electron heating make little difference to the electron temperature profiles.
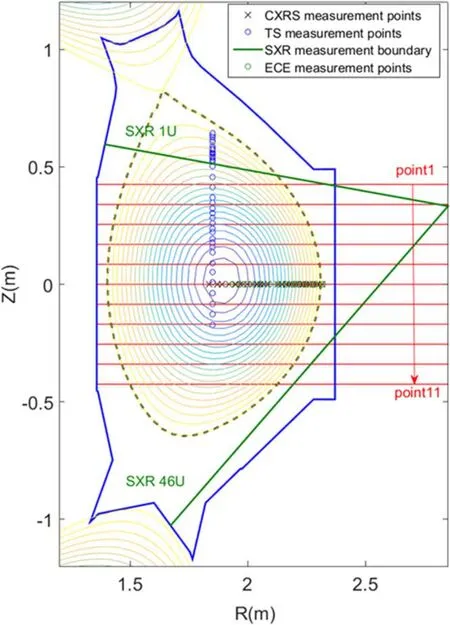
Figure 1.Poloidal view of main diagnostics for data analysis.
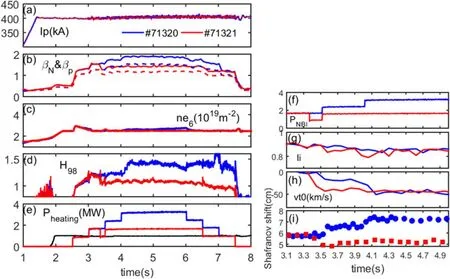
Figure 2.Basic parameters of shot #71320 and shot #71321.(a) Plasma current.(b) Normalized beta (full line) and poloidal beta (dotted line).(c) Line-integrated density of the sixth chord of POINT; in these two shots, plasma density measured by the sixth chord serves as a density feedback signal.(d)Confinement quality H98.(e)Auxiliary heating power;black line is 4.6 GHz LHW power which stays the same in two shots.Enlargement of the time window from 3.1 s to 5 s is shown on the right-hand side.(f)NBI heating power.(g)Plasma internal induction li.(h) Plasma toroidal rotation velocity.(i) Shafranov shift.
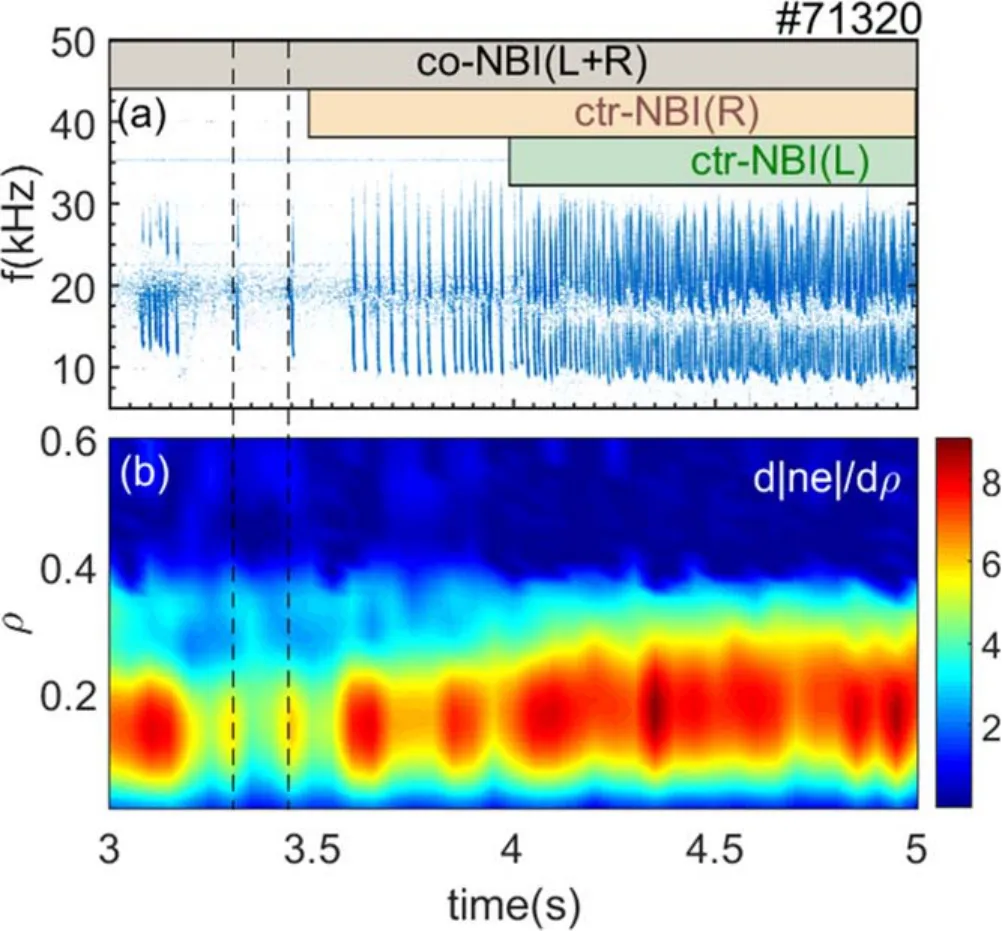
Figure 3.(a)Spectrum of fishbone behavior in shot#71320;square frames represent the duration of each NBI beam.(b) Evolution of density gradient by POINT data.

Figure 4.(a)Spectrum of fishbone behavior in shot#71321;square frames represent the duration of each NBI beam.(b) Evolution of density gradient by POINT data.

Figure 5.3D plots of evolutions of density profiles in (a) shot #71320, (b) shot #71321.

Figure 6.Density profile before (3.25 s) and after (3.3 s) a single fishbone burst.
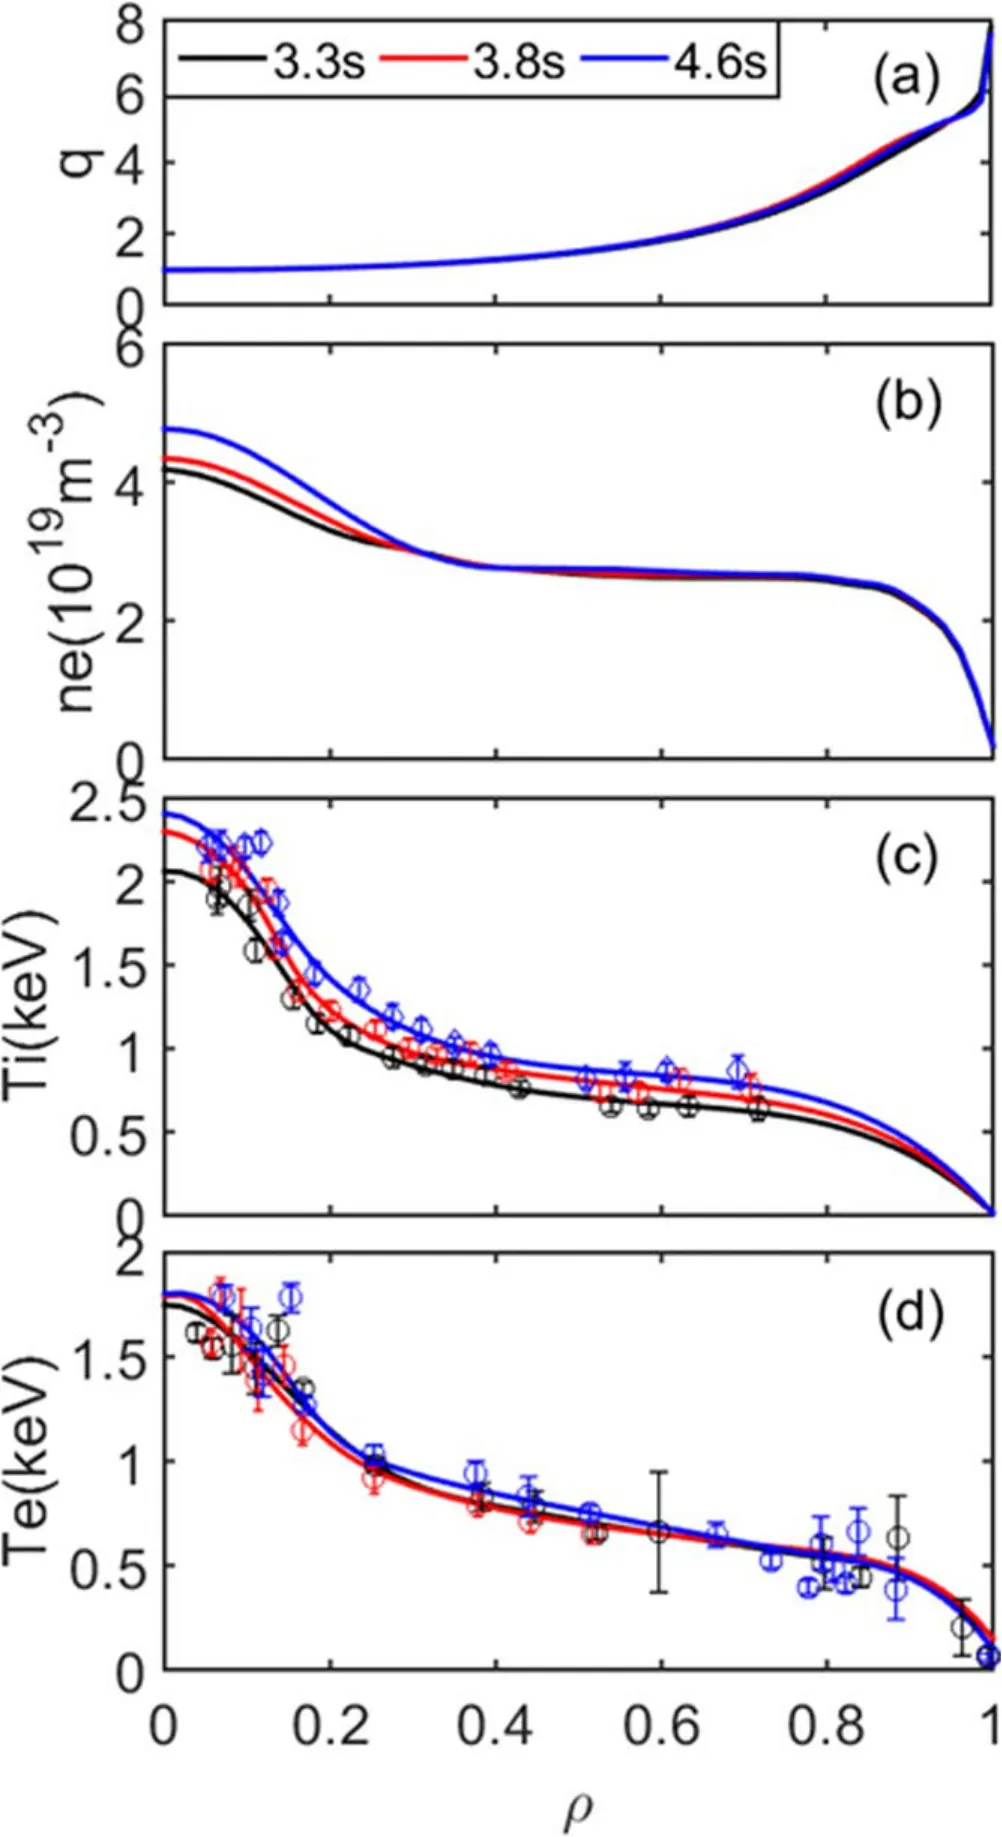
Figure 7.Profiles of three typical time slices: (a) q profiles, (b)density profiles,(c)ion temperature profiles,(d)electron temperature profiles.
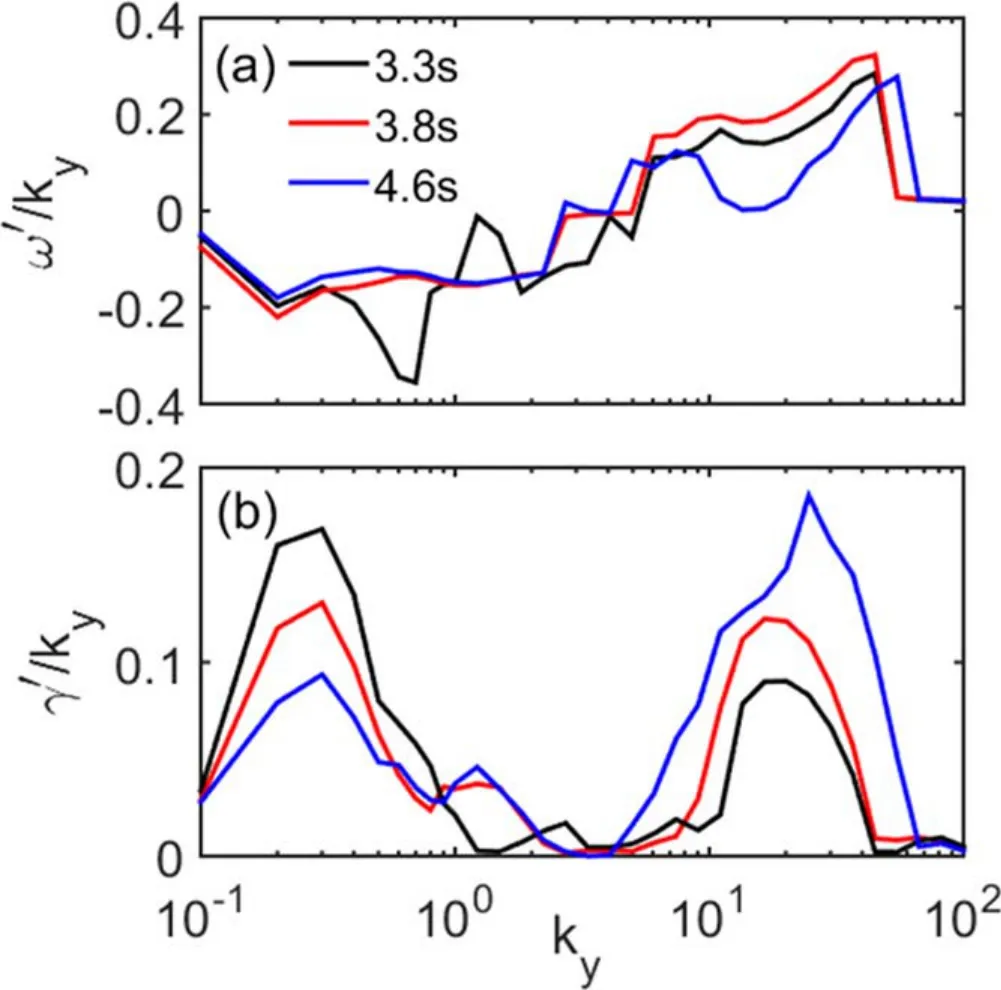
Figure 8.Comparison of(a)frequency spectrum and(b)growth rate with same position(ρ~0.2)at different time slices for shot#71320 from TGLF.In this simulation,the direction of ion gyration is set as negative,the corresponding ITG frequency is expressed as negative,and the frequencies of TEM and ETG are expressed as positive.
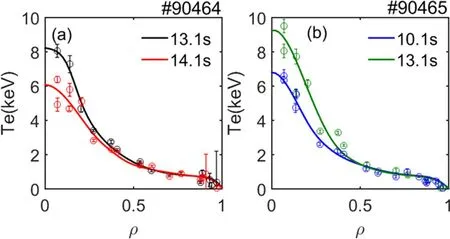
Figure 9.Electron temperature profiles in (a) shot #90464, (b) shot #90465.

Figure 10.Spectrum of MHD behaviors in shot #90464.

Figure 11.Spectrum of MHD behaviors in shot #90465.
TGLF [36–39] code is used in gyrokinetic analysis by computing a linearly unstable eigenmode from the fluid moments equation.The most unstable mode in the selected region could be given.The calculation is based on the reconstructed equilibrium from EFIT code with additional constraint by the POINT system.The basic input data of plasma profiles come from figure 7.The k spectra of the linear growth rate and frequency from TGLF are shown in figure 8.Growth rate,frequency and poloidal wave number are normalized in form of γ′= γ(a/cs), ω′= ω(a/cs) and ky=ρskθ, respectively.In which,and length scale a is the circular equivalent minor radius of the last closed flux surface.TGLF simulation is a program that combines multiple mode calculations simultaneously, in which the electron gyration direction is positive, so the direction of ion gyration is negative, the corresponding ITG frequency is expressed in the negative direction and the frequency of TEM and electron temperature mode (ETG) are expressed in the positive direction.In these time slices,it is found that the ITG modes dominate in the low-k region where ky<1 and ETG modes dominate in the high-k region(ky>1).The growth rate of ETG is elevated;considering the increasing NBI power,the unchanging Teprofiles could be from the increase in ETGinduced anomalous electron heating transport.Unlike the highk modes,the growth rate of ITG shows a significant decreasing trend in the low-k region.The higher Tiand NBI power do not bring a higher ITG growth rate;frequently burst fishbone shows an effect of suppressing the ITG and then leads to the state of sustainment of electron density and ion temperature ITB.
4.Kink mode effect on electron temperature ITB
The kink mode is common in MHD on EAST in high-confinement experiments.In past works, the appearance of an internal kink at the ITB foot gives a prospection of the relationship between ITB formation and the internal kink.Direct measurement of turbulence in the core region has been difficult in past high-confinement experiments.Here, high-Teexperiments with a kink mode in the core are presented.In these shots, the plasma current is 500 kA and the toroidal magnetic field is 2.5 T.Pre-setting the plasma density at about 2×10¹⁹m-3, pure radiofrequency heating with LHW and electron cyclotron waves (ECWs) is utilized to get a high Te.In these two shots #90464 and #90465 mentioned here, the LHW and ECW powers are the same,in which the 2.45 GHz LHW is 0.5 MW, the 4.6 GHz LHW is 2 MW and the total ECW power is about 0.9 MW.Therefore, a high electron temperature can be seen in figure 9.A Teprofile transition can be observed in these two shots, corresponding with a mode transition phenomenon as shown in figures 10 and 11.In figure 10, transition from a 1/1 kink mode to a 3/2 mode is shown;the core electron temperature collapses from 8 keV to 6 keV.In contrast,in shot#90465,from 10.1 s to 13.1 s,a 3/2 mode transferring to a 1/1 kink occurs at about 11 s, and leads to about 2 keV elevation of the core Te.Figure 12 shows the q profiles in shot#90464;in these two time slices,10.27 s is with the 1/1 kink mode and 14.117 s is with the 3/2 mode.The kink mode is resonating at ρ~0.25 where q is about 1 and the steep gradient region is here.The similar q profiles infer that electron temperature change is not from the q profiles.This infers that there could be a relationship between the kink and high Tegradient.

Figure 12.q profiles in two time slices in shot #90464.

Figure 13.Power of the signal of SXR and turbulence measured by DBS with frequency range from 20 kHz to 200 kHz.
Measurement of turbulence is performed by Doppler reflectometry (DBS) [40] with poloidal wavenumber kθabout 6 cm-1.The measured position of turbulence is near the q=1 surface.The power of the turbulence signal is shown in figure 13 by the pink line.The blue line is the power of the filtered SXR signal, and the band-pass range is determined by the MHD frequency.As seen, both the amplitude and frequency of the turbulence are higher when the 3/2 mode appears.To understand the detailed process of the mechanism of the kink mode in suppressing the turbulence, an expansion from 10.2 s to 10.4 s is shown in figure 14(a).Figure 14(b) is the normalized electron temperature gradient(R/LTe).Here it is given by ECE which has been calibrated by the TS system.In figure 14(a),a high turbulence could be observed between two kink modes.As the source of turbulence,the increase in the Tegradient concurs with the increased turbulence.Obviously,the kink mode lags behind the appearance of the turbulence by tens of milliseconds, and the appearance of the MHD is accompanied by a reduction in the magnitude of the turbulence.

Figure 14.(a)Expansion of turbulence and SXR signal in figure 13.(b) Normalized electron temperature gradient at 1/1 surface.
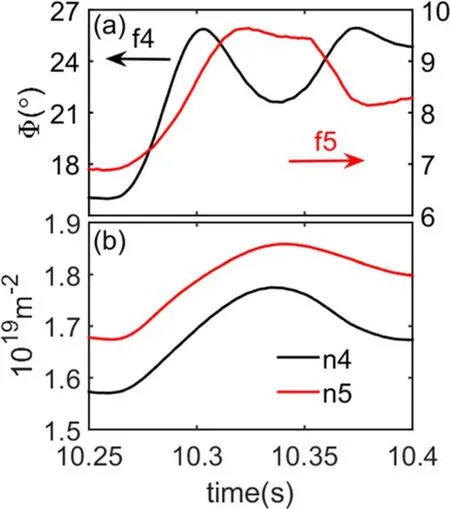
Figure 15.(a)Faraday angle signals of the fourth and fifth chords of POINT, which are two chords just outside and inside the 1/1 surface, respectively.(b) Line-integrated density of the fourth and fifth chords of POINT.

Figure 16.Total current perturbation at the 1/1 surface in a period of increasing turbulence and suppressed by the kink mode.
The current perturbation has been observed in this process.Figure 15(a)shows Faraday angle signals of the fourth(f4)and fifth(f5)chords of POINT,which are outside and inside the 1/1 surface, respectively.Here, these signals are corrected by the method in [41] which can reduce the error from stray light.Line-integrated densities of these two chords are shown in figure 15(b).The density and Faraday angle of the POINT system are expressed by ne=2.82×10⁻¹⁵λ∫nedl and φ=2.62×10⁻¹³λ2∫neB||dl, where λ is the diagnostic wavelength and B||is the poloidal magnetic field parallel to the diagnostic chords.In general,the Faraday angle increases with increasing density, while at 10.3 s with turbulence sharply growing, f4 shows a reduction even though the density is increasing and at 10.34 s f4 returns to increasing,but the density is decreasing at this time.The special change in the fourth Faraday signal is due to the local change of the poloidal magnetic field.Considering the adjacent chords of the fourth and fifth and plasma boundary between them as a loop,using Ampere’s law ∮LBθ·dl=μ0Iφ,whereBθis the poloidal magnetic field andφIis the toroidal current.The fluctuation of toroidal current between the chords could be speculated by the relative variation of their Faraday rotation angle.Application of Ampere’s law is based on the fact that the portion of the loop along the plasma edge is short and the contribution of the magnetic field is small[42].Therefore,a reduction of the current induced by the turbulence and recovery of current corresponding to the kink mode could be inferred.Figure 16 is the total current perturbation at the 1/1 surface during a period.The current is calculated by EFIT code with POINT constraints.Each change in current is relative to 10.27 s.Perturbation of current originally shows an increasing trend which is related to the increasing bootstrap current perturbation proportional to the electron temperature gradient.With the peak of the turbulence at 10.3 s,a counter-direction current leads to the negative current perturbation.Soon,the kink mode is excited and the current recovers.This feedback loop could be one of the reasons which qualify the plasma in high-electron temperature sustainment.
5.Discussion and summary
A series of experiments with the purpose of exploring high plasma parameters have been done on the EAST tokamak.In most of these experiments, ITBs are observed and confinement is improved.Although the effect of q profiles cannot be neglected, MHD behaviors also play an important role in many experiments.The mechanisms of the fishbone and kink mode are studied in this work.We find that with fishbone observed, the power threshold in forming a density ITB in EAST high-βNexperiments is reduced.The intensity of electron density ITB is not only determined by the heating power, but also decided by the characteristics of fishbone.Simulation of TGLF indicates that a higher burst frequency of fishbone could be a reason behind reducing the growth rate of ITG at the ITB foot position.ITG-dominated particle anomalous transport reduction then contributes to the electron density ITB sustainment.The inference that fishbone leads to better electron density confinement is verified by observation of the density gradient increasing with each fishbone burst.However, the detailed process of energetic particle redistribution [21] is still not detected directly.Moreover, modes induced by other energetic particles like the Alfvén eigenmode should have the same effect [34], but there is no experimental result observed on EAST even with several modes reported [43].The difference is worthy of study.By setting the DBS in an inner region, it is shown that the kink mode is related to the reduction of turbulence which is regarded as TEM and therefore sustains a high electron temperature operation.With a high electron temperature gradient formed, turbulence is driven and it brings a counterdirection current perturbation [44].Excitation of the kink mode eliminates the perturbation and reduces turbulence intensity.The feedback loop of the multi-scale interaction could be one of the reasons to sustain the high-electrontemperature long-pulse operation.The above study of the MHD effect will help in exploring high-parameter long-pulse operation on EAST.
Acknowledgments
This work is supported by the National Key R&D Program of China (No.2017YFE0301705).This work is also supported in part by the Key Program of Research and Development of Hefei Science Center, CAS (No.2019HSC-KPRD001).This work is also supported by National Natural Science Foundation of China (Nos.11975271 and 11675211).This work was partly supported by the Collaborative Research Program of the Research Institute for Applied Mechanics,Kyushu University.
ORCID iDs
杂志排行

Plasma Science and Technology的其它文章
- Design and preliminary test of a 105/140 GHz dual-frequency MW-level gyrotron
- Competitive effect between roughness and mask pattern on charging phenomena during plasma etching
- Reliability improvement of gas discharge tube by suppressing the formation of shortcircuit pathways
- A novel flexible plasma array for large-area uniform treatment of an irregular surface
- Pulsed high-current discharge in water:adiabatic model of expanding plasma channel and acoustic wave
- Comparison of double layer in argon helicon plasma and magnetized DC discharge plasma