A new deep-reading look-ahead method in electromagnetic loggingwhile-drilling using the scattered electric field from magnetic dipole antennas
2022-03-30LeiWangShaoGuiDengGuanBaoXieShanJunLiZhenGuanWuYiRenFan
Lei Wang ,Shao-Gui Deng ,* ,Guan-Bao Xie ,Shan-Jun Li ,Zhen-Guan Wu ,Yi-Ren Fan
aSchool of Geosciences,China University of Petroleum (East China),Qingdao,Shandong 266580,China
b Laboratory for Marine Mineral Resources,Qingdao National Laboratory for Marine Science and Technology,Qingdao,Shandong 266071,China
cState Key Laboratory of Shale Oil and Gas Enrichment Mechanisms and Effective Development,Beijing,100083,China
d Beyond Bits Technoogy,Inc.,Houston,78741,USA
Keywords:Electromagnetic logging-while-drilling look-ahead Deep reading Scattered electric field Short spacing
ABSTRACT This paper presents a new deep-reading logging-while-drilling electromagnetic(EM)logging method to detect bed boundaries ahead of bit.Unlike all existing EM logging approaches,the new method is based on the scattered electric field radiated by a magnetic dipole antenna.By analyzing the characteristics of electric tensor responses in layered formations,optimal look-ahead electric component is selected.The selected scattered field contributes to a large portion of the total field and is strongly sensitive to the boundary position.The measured voltage from the scattered electric component can be tens of times larger than that from the scattered magnetic fields and it attenuates slower.Thus,the detection capability improves significantly.A coaxial open-loop half-circle antenna is then proposed to measure the electric field in logging while drilling environment.A practical tool implementation equipped with two tilted close-loop antennas and two open-loop antennas is further developed for look-ahead application.Numerical results demonstrate that the detection depth of the new look-ahead tool can be up to 40 m under favorable conditions.Compared with current look-ahead logging tools,the new method not only significantly shortens the tool size,but also can recognize the boundary position and azimuth.
1.Introduction
Look-ahead and look-around technologies are of great importance in accurate geosteering,precise geo-stopping as well as geoscoping while drilling(Bittar et al.,2009;Liu et al.,2015;Antonsen et al.,2018;Nejadi et al.,2020;Wang et al.,2021a).Taking advantage of extra-deep azimuthal resistivity measurements,the drilling operators are now capable of extracting remote boundaries around the wellbore in real-time(Wei et al.,2010;Rabinovich et al.,2012;Seydoux et al.,2014;Hartmann et al.,2014;Wang and Fan,2019;Wu et al.,2020).These measurements can also see the boundaries ahead of the bit in simple geological scenarios such as the folding structure (Upchurch et al.,2015;Puzyrev et al.,2018;Thiel and Omeragic,2019).However,their look-ahead capability reduces rapidly with the decreasing relative dipping angles.To solve this challenge,the Electro Magnetic Look Ahead (EMLA) deep directional resistivity service has been introduced lately(Constable et al.,2016;Guo et al.,2020).EMLA can provide a large look-ahead scope ranging from several meters to tens of meters (Khalil et al.,2018).Unfortunately,the deep-reading capability is achieved at the expense of overlong tool spacing which adds to the difficulty in the signal synchronization between transmitter(T)and receiver(R).In addition,the interpretation of EMLA data relies heavily on the prior information of the formation behind the transmitter sub.Therefore,it is mandatory to develop a new deep look-ahead method that not only has tool size as short as possible but also shows less dependency on the prior information.
To date,almost all current logging-while-drilling (LWD) electromagnetic (EM) logging tools are composed of closed-loop coils,namely the magnetic dipole (MD) type antenna (Hagiwara et al.,2005;Lee et al.,2012;Hong et al.,2013;Li,2014).Theoretically,the essence of these logging methods is utilization of the magnetic fields from the MD source (Mallan and Torres-Verdin,2007;Hong and Yang,2011;Hu et al.,2017).To detect the formations ahead of bit,EMLA mainly uses the coaxial and coplanar magnetic components (Larsen et al.,2018).However,these components lack enough azimuthal sensitivity and their detection depth is dictated by the T-R spacing.Consequently,short-size look-ahead tool using the magnetic fields is almost intractable.
The electrical field radiated by an MD source can be a good complement and may even be a potential alternative to current detection method due to its strong amplitude and slow attenuation(Li,2016).By using they-direction electric field from the axial MD transmitter,Wang et al.(2020) proposed a new ultra-deep boundary detection method with short tool size.The new method was most suitable for horizontal wells and lost look-ahead capability in vertical wells.Recently,Hagiwara (2018) found that the transverse electric field from a horizontal MD can look-ahead of the tool much more deeply than the existing magnetic field based method.However,only the total electric field is considered.Overall,the electric field has rarely been systematically discussed,and its look-ahead capability needs to be further investigated.
In this paper,a new look-ahead method based on the scattered electric fields from the MD source is developed.The optimal electric component is selected and a practical antenna implementation is proposed.The rest of this paper is organized as follows:the optimal look-ahead electric component is derived first,followed by the investigation of the scattered fields for boundary detection.Then,a new and practical look-ahead tool is proposed by using the openloop antennas and tilted MD antennas.The spatial sensitivity distributions and look-ahead performance of the new tool in vertical or deviated wells are also investigated.
2.Look-ahead method based on the scattered electric field
In this section,the optimal electric component radiated by an MD antenna is determined for the look-ahead application.The characteristics of the scattered electric field are also investigated with special emphasis on the attenuation property and azimuthal sensitivity.To demonstrate the advantages of the electric field based look-ahead method,the basic components of current EMLA tool,i.e.the coplanar and coaxial magnetic components (HxxandHzz),are also considered and analyzed.
2.1.Selection of optimal look-ahead electric component
Considering a triaxial MD source with three mutually orthogonal antennas oriented atx,yandzdirections (Wang et al.,2016),the electric field tensor(E) can be measured at the receiver,
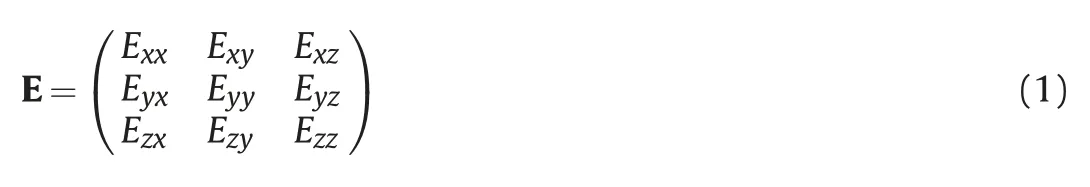
whereEijsignifies thej-oriented electric fields emitted by anioriented MD antenna.Among the nine components,only some of them are suitable for boundary detection.To get optimal lookahead component,a two-layered model is established.As shown in Fig.1a,the upper and lower beds are with resistivities 10 Ω·m and 1 Ω·m,respectively.
Assuming the EM logging tool penetrates the interface with relative dipping angles of 0°,30°,60°and 89°,Fig.1b to e presents the electric tensor responses as a function of the recording points.Obviously,Exx,Exz,Eyy,EzxandEzzread zeros at all recording positions.Hence,these components will be ignored hereafter.The rest four components can be divided into two types:Type I-EyzandEzyand Type II -ExyandEyx.The former achieves best boundary detection performance in horizontal wells,while it will be uninformative to the existence of the approaching interface in vertical wells.By contrast,the latter becomes abnormal near the boundary and the abnormal area enlarges slightly with decreasing dipping angle.ExyandEyxhave almost identical abnormal zone,giving rise to similar detection scopes.However,Eyxencountered discontinuities at the boundary,which will inevitably add difficulty to the data interpretation.As a result,Exyis the best choice for look-ahead application.
2.2.Strength and attenuation of look-ahead component
Theoretically,the scattered electric or magnetic field is the key of boundary detection,thus only the scattered field is considered in this subsection.The magnetic field can be readily achieved by using an MD antenna with radiusa.The measured voltage forHxxandHzzcan be written asVxxandVzz(Xiao et al.,2013;Wang et al.,2021b),

where ω and μ are the angular frequency and magnetic permeability,respectively.To measure the electric field,one usually uses the electric dipole (ED) antenna,i.e.a straight wire.Assuming the electric field along the wire is almost invariant,the measured voltage (Vxy) forExycan be calculated as

wherelis the length of ED antenna.For the logging instrument,it is natural to setlto be the tool diameter,l=2a.In what follows,ais set to 5 cm which approximates to the tool radius.
To demonstrate the advantages of the electric fields,the important factors (strength and attenuation) dominating the detection performance are investigated.For simplicity,the relative dipping is set to zero,simulating a vertical well.Taking a two layered formation for example,Fig.2 shows the relationship between the voltage strength and the recording positions.Here,the operating frequency is fixed to 100 kHz and the T-R spacings are set to 1.0 m,5.0 m and 15.0 m,respectively.As we can see,the measured voltage decays much slower in the resistive bed than in the conductive one.The voltage from the electric field is tens of times larger than that from the magnetic fields.Therefore,one turn of the antenna is enough for the ED receiver to guarantee the signal strength.Moreover,the strength ofVxyenlarges with decreasing TR spacing,which further favors the boundary detection with short spacing.
Fig.3 further displays the strength ratio between the scattered and incident fields.Since the scattered and incident fields are the effective information and useless signal for boundary detection,the strength ratio can be treated as the signal to noise ratio (SNR).For short tool size,the SNR of the magnetic field is usually very small,which means the incident fields contribute most to the measured signal.Consequently,it is difficult to accurately extract the effective information.By contrast,the scatteredExycan be up to 20 percent of the incident field,and the corresponding SNR is 7 times of the magnetic field.As the T-R spacing enlarges,the SNR of the EM fields increases rapidly and the SNR separation between three measurements narrows.When the spacing is 15 m and the transmitter lies within the resistive layer,the electric field and the coplanar magnetic component have almost identical SNR.

Fig.1.The electric tensor responses in a two-layered formation:(a)formation model;(b)Exy and Eyx;(c)Eyz and Ezy;(d)Exx,Eyy and Ezz;(e)Exz and Ezx.The T-R spacing and operating frequency are 2.0 m and 100 kHz,respectively.
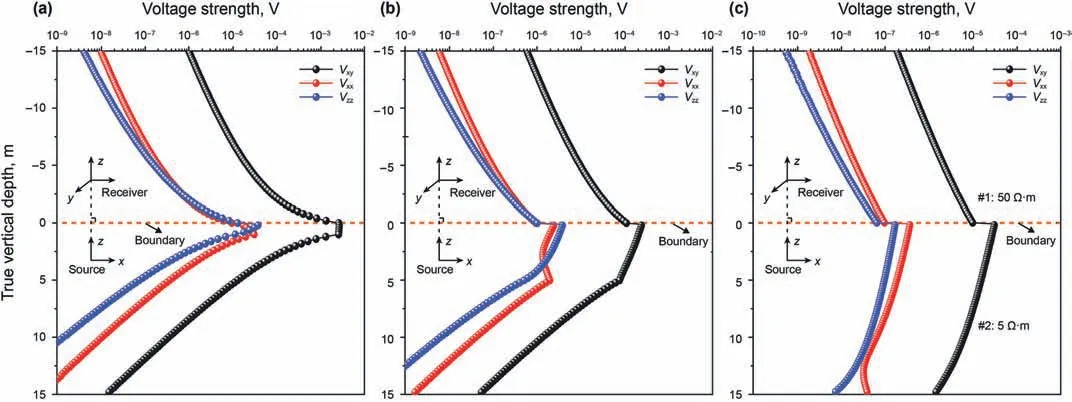
Fig.2.The voltage strength from the scattered electric and magnetic fields as a function of the recording points,when the T-R spacing is (a)1.0 m;(b) 5.0 m;and (c)15.0 m.The operating frequency is 100 kHz and the recording point is at the transmitter.
2.3.Azimuthal sensitivity of the look-ahead EM fields
The sensitivity to formation azimuth is another important feature dominating the detection performance.To this end,Fig.4 compares the responses of scattered electric and magnetic fields when the transmitter vertically penetrates a two layered formation from top to bottom.The resistivities of upper and lower beds are 50 Ω·m and 5 Ω·m,respectively.Here,the T-R spacing is set to 5 m.It is clear that the magnetic responses become nonlinear nearby the bed boundary.This curve complexity inevitably adds to the difficulty in formation interpretation and data processing.What's worse,the azimuthal sensitivity of theHxxandHzzcomponents is weak.For example,no matter the transmitter approaches a resistive or conductive bed,the observed values in the first layer will always be positive.By contrast,the scatteredExyshows opposite value signs,indicting strong azimuthal sensitivity to boundaries above or below.In addition,the scattered electric response is monotonous in either bed,which enables an“eyeball”or qualitative evaluation of the formation property ahead of the bit.From the perspective of the simplicity and sensitivity of the measurement,the scattered electric component exceeds over the magnetic fields.
3.Look-ahead tool based on the scattered electric field
3.1.Antenna configuration of a new look-ahead measurement

Fig.3.Strength ratio between the scattered and incident fields as a function of the recording points,when the spacing is(a)2.0 m;(b)6.0 m;(c)15.0 m.The operating frequency is 100 kHz and the recording point is at the transmitter.

Fig.4.Azimuthal sensitivity of the scattered electric and magnetic fields:(a)a two-layered formation model;(b)Exy;(c)Hxx and Hzz.Here,the operating frequency and T-R spacing are set to 100 kHz and 5.0 m,respectively.

Fig.5.(a) Antenna configuration of the new look-ahead tool which consists of two 45° tilted MD transmitters and two ME antennas;(b) schematic of the ME antenna.
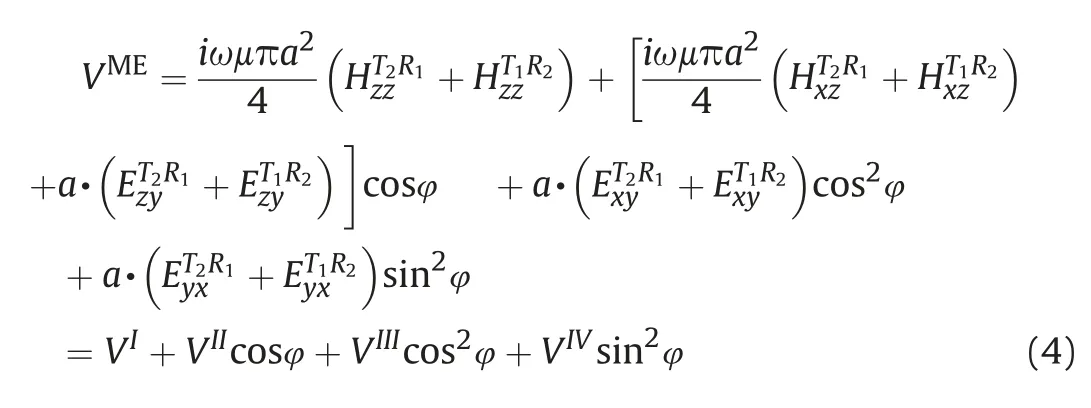
Fig.5a presents a practical implementation of a new look-ahead tool which is composed of two 45°tilted MD antennas (T1andT2)and two receivers (R1andR2).Each receiver is an open-loop halfcircle antenna,also known as the ME antenna (Li et al.,2018).Theoretically,the ME antenna can be equivalent as the superposition of a half MD antenna and an ED antenna,as shown in Fig.5b.T2R1andT1R2are combined to directly eliminate the primary electric field.Assuming the radius of the MD or ME antenna isa,the measured signalVMEat the receiver can be expressed as
The wolf pulled the bobbin, and the door opened, and then he immediately fell upon the good woman and ate her up in a moment,6 for it been more than three days since he had eaten. He then shut the door and got into the grandmother s bed, expecting Little Red Riding Hood, who came some time afterwards and knocked at the door: tap, tap.
where φ is the tool rotation angle and the superscriptTiRjsignifies the EM field atRjradiated byTi.VI-VIVcan be readily separated by fitting the azimuth-dependent signal to a Fourier series.The measured voltages are then converted to the attenuation(Att)and phase shift (PS) geosignals,

3.2.Spatial sensitivity distribution
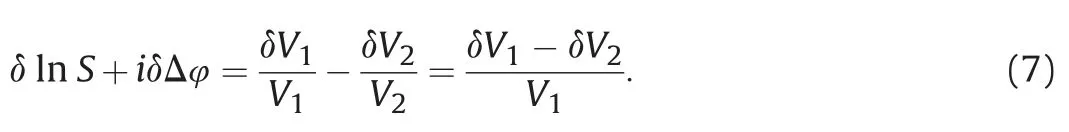
The geometrical factor (GF) is an effective tool to showcase the spatial contributions to measured signals (Habashy et al.,1993).LettingV1=VI+VIII,V2=VI-VIIIand assuming the transmitter and the receiver are located at rt(0,0,L/2)and rR(0,0,-L/2),V1/V2can be formulated as

whereSis the amplitude ratio and Δφ signifies the phase shift.Differentiating Eq.(6) yields
Using linear approximation,the attenuation and phase shift GFs,gAttandgPS,can be expressed as (Wang et al.,2019)

δσ(r’)depicts the conductivity difference between the formation and background medium.
Fig.6 shows the GFs of the new look-ahead tool operated at 10 kHz in a 10 Ω·m formation.Obviously,gAttandgPShave the strongest sensitivity nearby the transmitter/receiver,and they are anti-symmetric with respect to the transverse plane at the tool middle point.The new tool is sensitive to formations ahead,behind and around the tool,corresponding to three different zones.For the look-around zone,the positive and negative contributions will cancel with each other,resulting in a zero tool response.This means the new measurement is less affected by the formation units between the T/R antennas.By contrast,the contributions of lookahead and look behind zones are opposite,indicating the azimuthal sensitivity to the boundary ahead of or behind the tool.
3.3.The look-ahead capability in vertical well
To demonstrate the detection performance of the new tool,we consider a two-layered medium,where the resistivities of the resistive and conductive beds are set to 100 Ω·m and 10 Ω·m,respectively.When the tool vertically penetrates the boundary from top to bottom,the simulated geosignals are displayed in Fig.7.The tool reads almost zero far away from boundaries.By contrast,the geosignals becomes nonzero when the boundary is within the tool's detection scope.The large abnormal area indicates the strong look-ahead scope of the new measurement.Assuming 0.25 dB and 1.5 deg are the thresholds forAttandPSgeosignals,the maximum depths of detection (DoD) in the resistive bed can be up to 16.1 m and 24.1 m,whereas they are 12.1 m and 9.7 m in conductive formation.Another good feature of the new measurement is the azimuthal sensitivity to boundaries ahead of the tool.Taking the geosignals in resistive bed for example,the response value with the boundary ahead is opposite to that with the boundary behind.
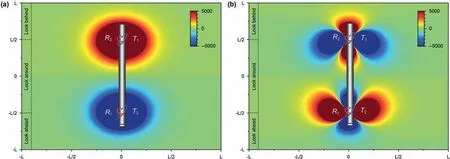
Fig.6.Sensitivity distributions of the new look-ahead tool(a)at xoz plane;and(b)at yoz plane.The blue/red color of each pixel depicts the negative/positive contribution to overall response.
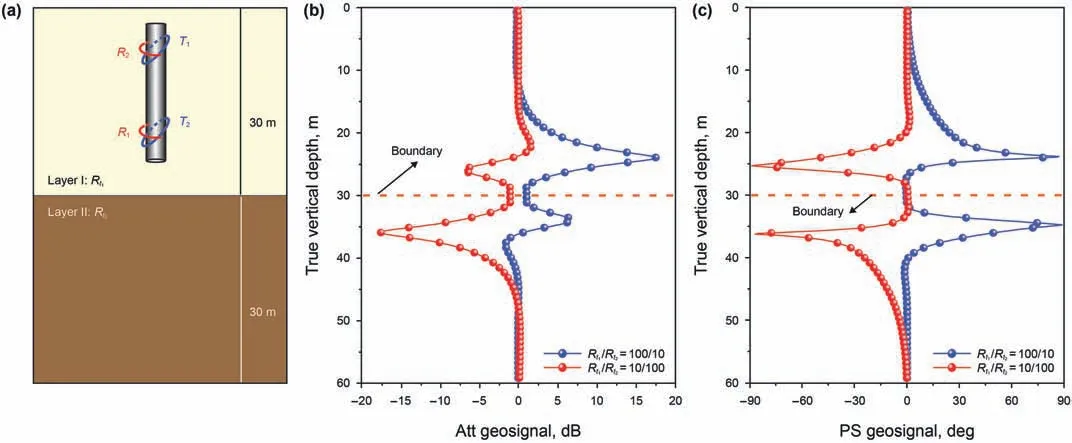
Fig.7.Responses of the new in a two-layered medium:(a) formation model;(b) Att geosignal;(c) PS geosignal.The operating frequency and spacing are 100 kHz and 3.0 m,respectively.

Fig.8.“Picasso Plot” showing the look-ahead capability:(a) Att geosignal;(b) PS geosignal.The operating frequency and spacing are 100 kHz and 3.0 m,respectively.
3.4.Effects of tool spacing and operating frequency on the DoD
Theoretically,the tool's detection performance is not only a function of the formation resistivity,but also is dominated by tool spacing and operating frequency.To quantify the latter two factors,we build a two-layered model(Fig.9a)where the upper and lower beds are with resistivity 10 Ω·m and 1 Ω·m,respectively.When the spacing is set to 0.5 m,2.0 m and 5.0 m,the corresponding simulated attenuation geosignals are shown in Fig.9b.It is clear that the scope of nonzero zone enlarges with increasing T-R spacing,indicating the improved DoD.However,when the tool crosses the bed boundary,theAttresponses of the large tool spacing are close to zero and the length of this area almost equals the T-R spacing.The existence of the large zero-platform nearby the boundary will inevitably result in the interpretation difficulty of the observed data.Fig.9c also showsAttgeosignals when the operating frequency ranges from 5 kHz to 500 kHz.Obviously,the tool's detection scope is inversely proportional to the operating frequency.In addition,when the operating frequency decreases,the signal strength increases significantly,whereas the shape ofAttcurves keeps almost unchanged.

Fig.9.Att geosignals in a two-layered medium:(a) a two-layered formation model;(b) geosignals with different spacing;(c) geosignals with different frequency.

Fig.10.2D map illustrating the relationship between tool spacing,operating frequency and DoD.Here,the resistivities of tool formation and shoulder bed are 10 Ω·m and 1 Ω·m,respectively.
Assuming the tool is located at the resistive layer,the relationship between the maximum DoD,T-R spacing and the operating frequency is then simulated and displayed in terms of a 2D map,as shown in Fig.10.Here,the resistivities of tool layer and surrounding bed are 10 Ω·m and 1 Ω·m,respectively.The tool axis is perpendicular to the formation boundary.Obviously,longer T-R spacing and lower operating frequency will give rise to a large detection scope,while shorter spacing and higher frequency correspond to a small DoD.When the T-R spacing exceeds 1.0 m,the DoD is normally bigger than 8 m.The DoD values keep almost unchanged when the spacing is larger than 5.0 m.Therefore,the T-R spacing of the new tool is better within 1.0-5.0 m.For the selection of operating frequency,we recommend using the frequency band between 5 and 500 kHz.This is reasonable because the tool with high operating frequency gives a shallow DoD and the over-low frequency may result in the weak signal of the scattered electric field.
3.5.Detection performance in deviated wells
After quantifying the detection performance in vertical well,it is natural to ask how the tool response changes with the relative dipping and what the look-ahead tool performs in deviated or horizontal wells.Fig.11 compares theAttandPSgeosignals with different dipping angles.The predefined formation model,shown in Fig.11a,is composed of a 10 Ω·m resistive bed and 1 Ω·m conductive bed.The new look-ahead tool is operated at 100 kHz and its spacing is set to 2.0 m.The tool response keeps almost unchanged when the relative dipping is less than 30°.Compared with the response from low deviated wells,much simpler responses are observed in horizontal wells,indicating the reduced nonlinearity and complexity.
When the tool layer resistivity is changing and the resistivity of surrounding bed is fixed to 1 Ω·m,the relationship between the DoD,relative dipping angle and tool formation resistivity is shown in Fig.12.In this case,the operating frequency and T-R spacing are identical to that used in Fig.11.It is obvious that the look-ahead scope of the new tool is almost independent on the relative dipping angle when α is less than 30°.As the dipping angle further goes up,the DoD reduces slightly and it will reach the lowest value in horizontal well.
4.Conclusion
A new deep-reading look-ahead method based on the electric field has been developed.The kernel of the new method is employing they-direction scattered electric field radiated byxdirection MD antennas.The scattered electric field has two main advantages:(a)the voltage from the electric field has strong signal strength and slow attenuation;and(b)the scattered electric field is able to recognize the boundary azimuth.Using the exceptional properties of the electric field in combination with MD transmitters and ME receivers,the proposed look-ahead tool is able to see the remote boundary ahead.In favorable conditions,the new tool's DoD can be up to 40 m,ten times larger than the T-R spacing.Moreover,the new tool will achieve maximum look-ahead capability in vertical wells.The numerical results demonstrate that the new method has great potential in realizing ultra-deep boundary detection with short offset and it may be a promising alternative to current look-ahead technology.
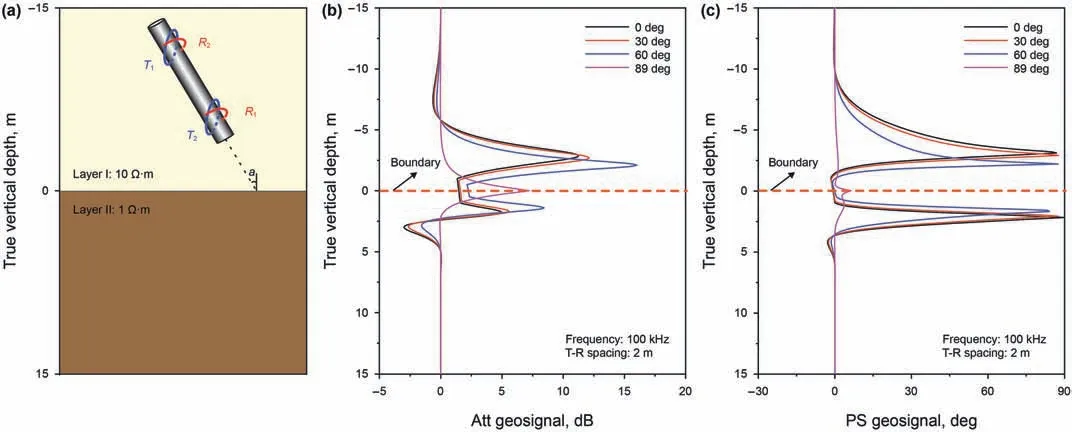
Fig.11.Tool responses with different dipping angels:(a) a two-layered formation model (b) Att geosignal;(c) PS geosignal.The spacing and operating frequency are 2.0 m and 100 kHz,respectively.
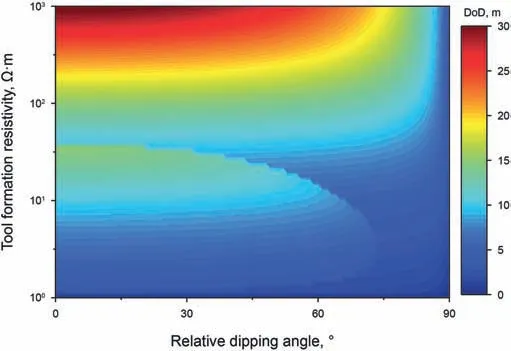
Fig.12.Look-ahead capability as a function of tool formation resistivity and relative dipping angle.Here,the resistivity of the remote surrounding bed is 1 Ω·m.
Despite of the good performance of this method,there are also problems worthy of discussion.It is a valuable research subject that how to measure electric field within a borehole and to analyze the environmental effects,e.g.mud conductivity,eccentricity and drill collar.Besides,fast and robust inversion method is also mandatory to interpret the complicated tool responses and to accurately derive the boundaries ahead of bit.
Acknowledgements
This research has been co-funded by the National Natural Science Foundation of China (41904109,41974146,42074134),State Key Laboratory of Shale Oil and Gas Enrichment Mechanisms and Effective Development Projects (No.20-YYGZ-KF-GC-11),National Key Laboratory of Electromagnetic Environment Projects (No.6142403200307),PetroChina Innovation Foundation (No.2020D-5007-0304) and the Fundamental Research Funds for the Central Universities (No.21CX06005A).
杂志排行

Petroleum Science的其它文章
- Reduction of global natural gas hydrate (NGH) resource estimation and implications for the NGH development in the South China Sea
- Evaluation of natural gas hydrate resources in the South China Sea by combining volumetric and trend-analysis methods
- The influence of water level changes on sand bodies at riverdominated delta fronts:The Gubei Sag,Bohai Bay Basin
- Source of silica and its implications for organic matter enrichment in the Upper Ordovician-Lower Silurian black shale in western Hubei Province,China:Insights from geochemical and petrological analysis
- Influence of structural damage on evaluation of microscopic pore structure in marine continental transitional shale of the Southern North China Basin:A method based on the low-temperature N2 adsorption experiment
- Application of multi-attribute matching technology based on geological models for sedimentary facies:A case study of the 3rd member in the Lower Jurassic Badaowan Formation,Hongshanzui area,Junggar Basin,China