Reduction of global natural gas hydrate (NGH) resource estimation and implications for the NGH development in the South China Sea
2022-03-30XiongQiPangChngZaoJiaZhangXingChnShngShiZhuoHngChnTaoHuTongWangZhiXuXiaoHanLiuXingWnZhangEnWangZhuoYaWuBoPang
Xiong-Qi Pang ,Chng-Zao Jia ,Zhang-Xing Chn ,H-Shng Shi ,Zhuo-Hng Chn ,Tao Hu ,Tong Wang ,Zhi Xu ,Xiao-Han Liu ,Xing-Wn Zhang ,En-Z Wang ,Zhuo-Ya Wu ,Bo Pang
a State Key Laboratory of Petroleum Resources and Prospecting,Beijing,102249,China
b College of Geosciences,China University of Petroleum (Beijing),Beijing,102249,China
c China National Petroleum Corporation,Beijing,100007,China
d Chemical and Petroleum Engineering,Schulich School of Engineering,University of Calgary,Calgary,T2N 1N4,Canada
e Shenzhen Branch of China National Offshore Oil Corporation Ltd.,Guangzhou,Guangdong 510240,China
f Geological Survey of Canada,Natural Resources Canada,Calgary,T2L 2A7,Canada
g School of Earth & Space Sciences,Peking University,Beijing,100871,China
Keywords:Natural gas hydrate Resource evaluation South China Sea Global NGH resource Reduction trend in NGH resource
ABSTRACT There have been at least 29 groups of estimates on the global natural gas hydrate (NGH) resource since 1973,varying greatly with up to 10,000 times and showing a decreasing trend with time.For the South China Sea (SCS),35 groups of estimations were conducted on NGH resource potential since 2000,while these estimates kept almost the same with time,varying between 60 and 90 billion tons of oil equivalent(toe).What are the key factors controlling the variation trend? What are the implications of these variations for the NGH development in the world and the SCS? By analyzing the investigation characteristics of NGH resources in the world,this study divided the evaluation process into six stages and confirmed four essential factors for controlling the variations of estimates.Results indicated that the reduction trend reflects an improved understanding of the NGH formation mechanism and advancement in the resource evaluation methods,and promoted more objective evaluation results.Furthermore,the analysis process and improved evaluation method was applied to evaluate the NGH resources in the SCS,showing the similar decreasing trend of NGH resources with time.By utilizing the decreasing trend model,the predicted recoverable resources in the world and the SCS are (205-500) × 1012m3 and (0.8-6.5) × 1012m3,respectively,accounting for 20% of the total conventional oil and gas resources.Recoverable NGH resource in the SCS is only about 4%-6%of the previous estimates of 60-90 billion toe.If extracted completely,it only can support the sustainable development of China for 7 years at the current annual consumption level of oil and gas.NGH cannot be the main energy resource in future due to its low resource potential and lack of advantages in recovery.
1.Introduction
Since the first assessment of global natural gas hydrate (NGH)resource was performed and the estimate was as high as 3×10¹⁸m3(Trofimuk et al.,1973),they have been honored as a new energy source to replace traditional oil and gas in the future (Wood and Jung,2008;Arthur,2011;Wadham et al.,2012;Senger et al.,2016).The NGH has received great attentions from many governments,such as USA (Booth et al.,1996),Canada (Dallimore et al.,2005),Japan (Konno et al.,2017),India (Sain and Gupta,2012;Holland et al.,2019),South Korea (Ning et al.,2012),and China(Yang et al.,2015).Currently,there have been at least 29 studies were conducted on the global NGH resource evaluation since 1973,while these estimates vary greatly,with a maximum difference up to 10,000 times.There are two completely different opinions for these results.One is that the 29 estimates show a promising NGH development potential (Fig.1a),and the other is that they show a limited development potential(Fig.1b).More recently,by utilizing a variation trend model,the global NGH resource was predicted to be 41.46 × 10¹²m3in 2050,less than 5% of the total global conventional oil and gas resources (Pang et al.,2021a).
What are the key factors controlling the decreasing trend of NGH resources? What are the implications of these variations for the NGH development in the world and the SCS? These are important issues concerned with researchers and governments and will be addressed in this study.
2.Methods and techniques
This study was conducted with five steps.First,defining the relevant concepts of NGH resources for convenience in discussion;Second,analyzing the characteristics of the evaluation process of global NGH resources so as to figure out essential advancements in theoretical researches and exploration practices,and then divide the evaluation process into six stages;Third,investigating the methods and principles for NGH resource evaluation in every stages to determine the key factors controlling evaluation results;Fourth,evaluating NGH resources in these stages in the SCS with the same methodology and principles;Fifth,assessing the technical and commercial recoverable NGH resources by using the result trends in the above six stages,and finally predicting NGH development direction in the future for the globe as well as SCS.
2.1.NGH concept
Following the definition of petroleum resources (SPE/AAPG/WPC/SPEE,2007),the NGH resource is defined as “a natural concentration or occurrence of the NGH of economic interest in or on the earth's crust in such form,grade or quality and quantity that there are reasonable prospects for eventual economic extraction”.According to this,the NGH that are dispersed in source rocks or difficult to exploit,and accumulated in reservoirs with too small area,too thin thickness or too low saturation,are all excluded from the resources.The NGH resources are further divided into realistic,successive,and prospective resources.What we are evaluating in this study are realistic NGH resources that can be extracted and are worth extracting under current technological conditions,since there have not NGH reservoir was exploited commercially yet,which also refers to recoverable NGH resources.
2.2.Principles for NGH resource evaluation
This study selects the SCS as a case to show how the resource estimates changing with research progress on NGH and key parameters about resources evaluation,which is mainly due to a relatively high degree of NGH exploration of the SCS,such as lots of NGH well drilling and the longest time for trial production tests.In this study,volumetric method and Monte Carlo simulation were utilized in resource evaluation.This is because that 67% of the 29 estimates in the world and 94% of the 35 estimates in the SCS adopted the volumetric method,and the Monte Carlo simulation is able to characterize the distribution and probability of estimates.The principles are shown in Eqs.(1)-(4):

where HGC refers to NGH content;Ais favorable area for the NGH formation;Kareais area ratio of NGH confirmed by well drilling;HandKthickrefer to favorable thickness and thickness ratio of NGH confirmed by well drilling,respectively;φ is porosity of NGHbearing strata;Sghrefers to NGH saturation;Kvolumerefers to NGH volume coefficient at surface condition;GIP is in-situ NGH resource;RR refers to resource ratio of enriched NGH confirmed by well drilling;TRR is technical recoverable resources;TRF refers to the technical recovery factor;CRR is commercial recoverable resources;CRF refers to commercial recoverable factor.
2.3.Important progress of hydrate study and stage division of global NGH resource evaluation
According to ten advancements in hydrate investigation and theoretical research progress,the evaluation procedures of the NGH resources were divided into seven stages (Table 1).The estimates of NGH resources in the first three stages are of low level and high uncertainty,which are not “resources” but respective gas content,and termed as the expected gas content(I),estimated gas content (II),and predicted gas content (III),respectively.The estimate calculated in stage four is the actual hydrate gas content(IV)by practical data,and the results in the final three stages are of high level and low uncertainty,termed as the GIP(V),TRR(VI),and CRR(VII),respectively.

Fig.1.Distribution characteristics of scale series and time series of 29 groups of NGH resources potential estimations in the world.a.Scale sequence from small to large scales.b.Time series from early to later,showing a decreasing trend (Pang et al.,2021).
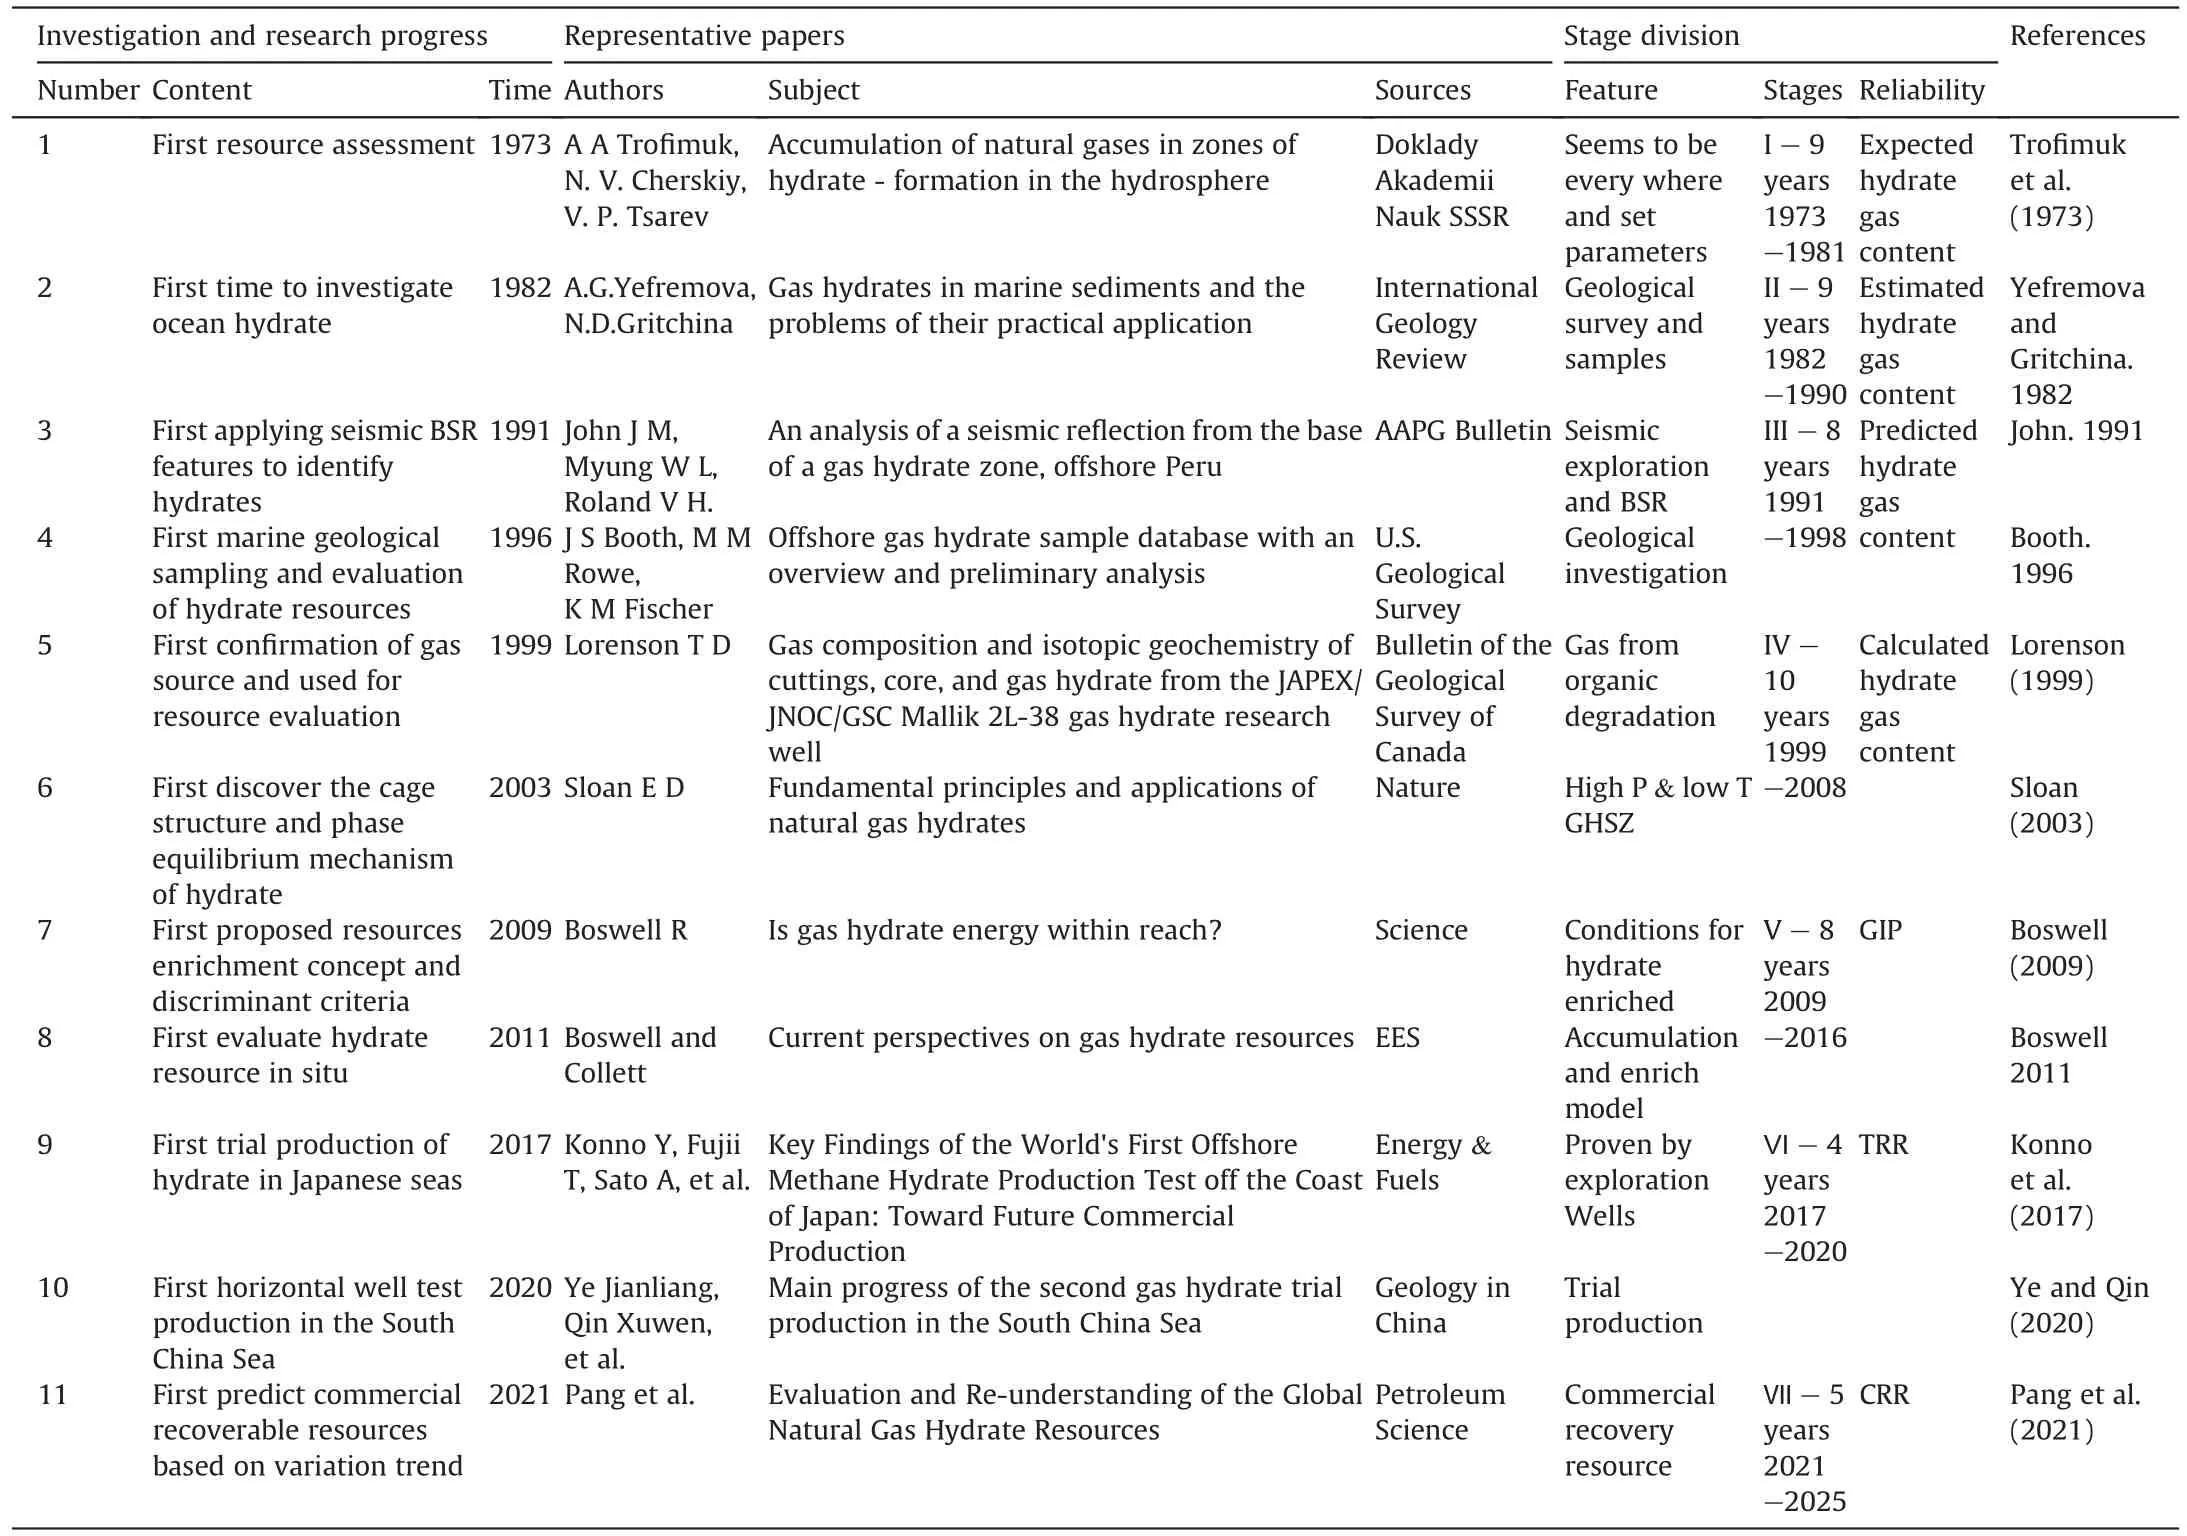
Table 1 The research progress and stage division of NGH resources potential evaluation.
3.Key factors controlling reduction of global NGH resource estimation
In the past 30 years,many important achievements have been made in NGH researches around the world,which have profoundly changed our understanding of NGH resources.In the primary stage,the NGH was considered to develop at everywhere,and people was optimistic about its resource potential.For example,the SCS was firstly assumed to be favorable to NGH formation,and the estimated result is the maximum one.Various factors controlling NGH resource estimation but the following four are the most important,because they are closely related to the ten key parameters in Eq.(1)to Eq.(4).
3.1.Revealing of NGH formation mechanism leads to reduction in NGH resource estimation
Analyses of carbon and hydrogen isotopes of natural gas in 13 proven global NGH reservoirs (Liu et al.,2015;Dai et al.,2017)indicate that,the gas was derived from the degradation of sedimentary organic matter.Guiding by it,the available areas for NGH formation are limited to sedimentary basins,and then the favorable areas are reduced by 2.8 times from 350 × 104km2(Fig.2a) to 125×104km2(Fig.2b).Uncovering the NGH formation mechanism(Sloan Jr,2003) delineates its distribution within Gas Hydrate Stable Zone (GHSZ) in the earth's poles,plateau,and deep sea with high pressure and low temperature (Chong et al.,2016).With this principle,the favorable areas in the SCS was predicted to be 55×104km2(Fig.2c),reduced by 2.3 times compared with the area of sedimentary basins (Fig.2b).
In many versions of the tale, Cinderella is transformed back into her ball gown once both shoes are on her feet. The Prince and/or his servants are not required to recognize Cinderella in her rags. The implication is that she is in her natural and rightful state when dressed in the better clothing.
3.2.Exploration and well drilling lead to reduction in NGH resource estimation
Geological surveys discover that,the NGH cannot be formed in the marine with a water depth less than 500 m,and then the favorable area in the SCS is reduced by 1.9 times from 350 × 104km2to 183 × 104km2.Seismic exploration shows that the NGH do not always exist in areas with bottom simulating reflector (BSR) characteristics,even in the theoretically predicted favorable areas in a gas hydrate stability zone (GHSZ).China had conducted lots of seismic exploration of NGH in the Shenhu Area,with an area of 3000×104km2(Zhang et al.,2003;Zeng and Zhou,2003;Zhu,2004;Wang et al.,2004),confirmed that the favorable area ratio is about 24.2% and NGH thickness ratio is less than 50%(Fig.3a).China had drilled 19 exploration wells in the Shenhu Area(Yang et al.2007,2017;Yao et al.,2008;Qian and Zhu,2008;Lu et al.,2008;Wang et al.,2010),and further proved that the NGH thickness is much smaller than previously studies,accounting for only 1%-11% with an average less than 5% of the GHSZ thickness(Fig.3b).Seismic exploration and well drilling results have reduced the NGH reservoir volume by 159 times compared with the rock volume of GHSZ.

Fig.2.Variation of favorable areas and thickness for NGH formation in the SCS with understanding improvement (Liu et al.,2021;Wang et al.,2021).(a) Whole area of the SCS(350×104 km2),KQ=100%.(b)Major sedimentary basin distribution in the SCS(Area of sedimentary basin in the SCS is 125×104 km2),KQ=35.7%.(c)Thickness distribution of GHSZ (Area of GHSZ in sedimentary basin is 55 × 104 km2,H=0-800 m,with an average of 350 m),KQ=15.7%.

Fig.3.Variation of favorable areas for NGH and statistics of drilling results in Shenhu Area,Pearl River Mouth Basin,SCS.(a) Variation of plane distribution of NGH-bearing formation (Zhang et al.,2003;Zeng and Zhou,2003;Zhu,2004;Wang et al.,2004).(a1) Location of Shenhu Area and favorable area for NGH-bearing shown by BSR.(a2) Areas with remarkable BSR and tectonic framework.(a3)Drilling results of NGH in areas with remarkable BSR.(B)Statistical analysis of drilling results from 19 wells(Yang et al.,2007;Yao et al.,2008;Qian and Zhu,2008;Lu et al.,2008;Yang et al.,2017;Wang et al.,2010).(b1).GHSZ thickness.(b2).Thickness ratio of NGH-bearing layers to the thickness of GHSZ.(b3).Reservoir porosity.(b4).NGH saturation.(b5).NGH volume ratio.(b6) NGH resource ratio.
3.3.Establishment of NGH resources concept leads to reduction in NGH resource estimation
(1) By investigating the drilling results in different areas over the world,researchers from US proposed a new concept of NGH resource and advocated to limit the in-situ NGH resource to that migrated and accumulated in sandstone and mudstone fractures with high porosity and permeability.The estimated results about the global NGH resource varied from(300-600) × 1012m3(Boswell,2009;Boswell and Collett,2011),indicating that the resource ratio is less than 6%-12% and reducing by 8.3-16.7 times.
(2) NGH resource is a component of the whole petroleum system,and it can only exist in a GHSZ in sedimentary basins with high pressure and low temperature by the mass balance law.The total amount of the NGH is controlled by the total conventional oil and gas resources amount and the rock volume ratio of GHSZ to sedimentary rock volume in free hydrocarbon dynamic field(F-HDF,Pang et al.,2021),which is above the Buoyancy-driven Hydrocarbon Accumulation Depth (BHAD,Pang et al.,2021).Under the same gas source conditions,the larger the volume ratio of GHSZ in the F-HDF and total conventional oil and gas resources are,the greater the NGH resources are.Two mass balance equations were established to calculate NGH resources,as shown in Eq.(5)and Eq.(6).Results show that the global NGH resources are estimated to be (44-135) × 1012m3,and the estimate is reduced by about 4 times than the NGH amount in the previous stage (Trofimuk et al.,1973;Pang et al.,2021a).

whereQNGHrefers to NGH resource amount;VGHSZis rock volume of GHSZ in F-HDF;VF-HDFis rock volume of F-HDF;RNGHis rock volume ratio of GHSZ to F-HDF.
3.4.Technology level leads to reduction in NGH resource estimation
Trial production success of the NGH shows capability to exploit it under current technical conditions.However,how much NGH can be exploited and whether the NGH can be exploited commercially depend on geological conditions of the NGH and the current technical levels.Simulation experiments showed that the recovery factor of the NGH varied from 15% to 70%,with an average of 30%(Konno et al.,2014),indicating that most of NGH resource cannot be extracted with current techniques.Based on it,the global TRR of NGH was predicted to be 22×1012m3-63×1012m3,and further reduced by 3.3 times.
3.5.Reduction trend indicates the NGH estimates are getting closer to the reality
Variation of global NGH resource estimates is controlled by advancements of NGH researches and exploration,which results in smaller estimates but with a more accuracy(Fig.4).The reduction trend indicates improved understandings of NGH formation and distribution mechanisms and also the improved resource evaluation methods,and the NGH estimates are getting closer to the reality.Based on the evaluation results in the first six stages,a global NGH resource variation model with time was established(Eq.(7)).
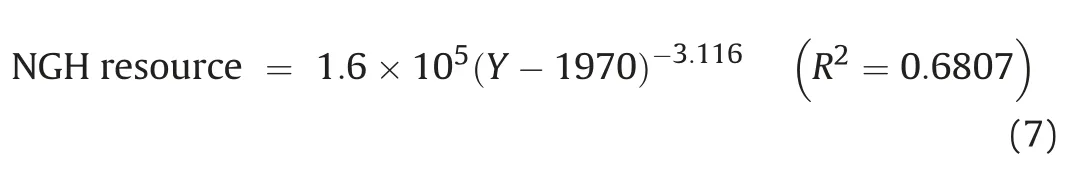
where NGH resource is the resource potential in different stages,1012m3;Yis time,year.
NGH resource evaluation results are decreasing over time,but their grade level and reliability are increasing.The reliability can be expressed by a difference between the estimates in two adjacent stages,and the smaller the bias is,the closer their values and the more reliable the results are.The estimates correspond to a difference of less than 3% between two years are defined as a minimum commercial NGH resource of CRRmini,the corresponding time is defined as the earliest time (Tcomm)for a large-scale commercial NGH exploitation,and the ratio of CRR to TRR is defined as CRF.By Eq.(7),the maximum commercial recoverable resources of CRRmaxin stage VII are predicted to be 700 × 1012m3,and the minimum commercial recoverable resources of CRRminiin the next stage(i.e.,stage VIII)are predicted to be less than 190×1012m3by a similar asymptote of NGH resources.Tcommis predicted to be after 2050,and the deduced CRF is about 31.3%.
Trend analysis method does not only take the estimate decrease brought by the scientific and technological progress and understanding improvement into account,but also considered increasing grade level and reliability.Results showed that the global NGH recoverable resource is 190×1012m3at 2050,which is closer to the actual reality than that obtained by trend analysis earlier.The previous trend analyses only took the reduction of the number of evaluation results caused by technological progress into account,but failed to consider the grade level increase of estimates.Therefore,the RR was multiplied in the GIP evaluation,and the RF was further multiplied in the evaluation of TRR (Pang et al.,2021).The global NGH TRR at 2050 by trend analysis showed that the mode value is 41.5 × 10¹²m3and the average is 91.0 × 10¹²m3,respectively.
4.NGH resource evaluation of six exploration stages in the SCS
4.1.NGH surveys in the SCS
The SCS locates in the western Pacific Ocean (Fig.5a) and is considered conducive to NGH formation and distribution (Yao,1998;Wang et al.,2017).In the past 20 years,China has completed lots of investigations and studies on NGH geological engineering and trial exploitation tests,and made abundant achievements (Fig.5b).In 2007,2013,two voyages of drilling projects in the Shenhu Area and the east of the Pearl River Estuary were carried out,respectively.During these two periods,26 stations were arranged,a multi-channel seismic survey with high resolution of 167,000 km was conducted,4244 geological sampling stations were located,and more than 80 evaluation wells were drilled (Zhang et al.2014a,2014b;Wu and Wang,2018).In 2017,2020,the NGH trial production tests with world's longest time were obtained successfully by vertical and horizontal wells respectively in the Shenhu Area,Pearl River Mouth Basin(Fig.5c),breaking the first technical bottleneck for large-scale utilization of NGH (Zhang et al.,2018;Xinhua Net,2020).Meanwhile,35 groups of estimates were conducted on NGH resource potential since 2000,and these estimates kept almost the same with time with ranging between 60 and 90 billion tons of oil equivalent (toe),showing a distinct difference with the reduction trend of the global NGH resource estimates(Pang et al.,2021).Important achievements and major challenges in the NGH resource evaluation in the SCS have been discussed in previous study (Xu et al.,2021).
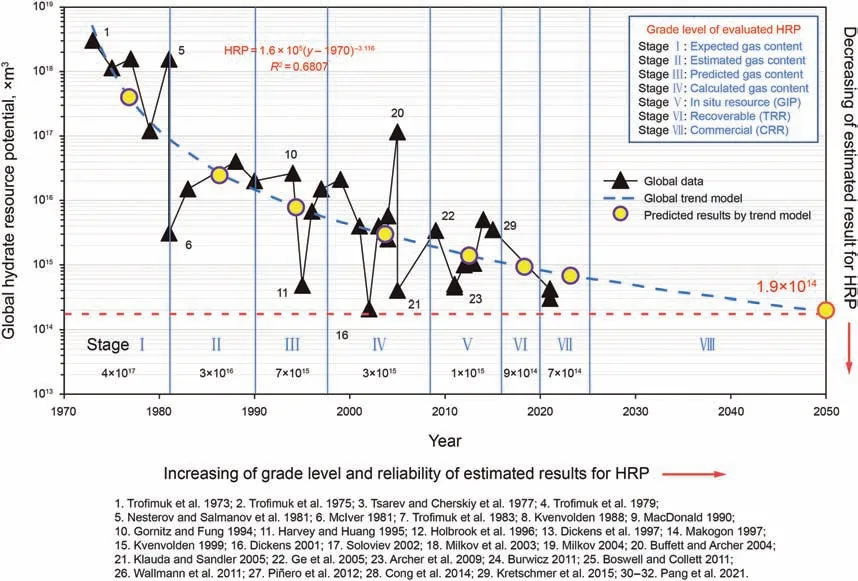
Fig.4.Variation of global 29 estimates of NGH resource with time (modified from Pang et al.,2021).A trend model was established to predict the NGH TRR at seventh stages(2021-2025) and CRR in 2050 according to the lower red asymptote.The values of NGH resource estimates decrease but the grade level and reliability increase.

Fig.5.Results of NGH geological survey and trial production in the SCS.All data of seabed geomorphologic features,sedimentary basin distribution,and main geological survey in the SCS were cited from the literatures (Zhang et al.2014a,2014b;Wu and Wang,2018).(a) Seabed geomorphologic features and sedimentary basin distribution and major geological survey locations.(b)The well location map of the drilling area in Shenhu Area of the first drilling project in 2007.(c)Well location distribution map of Dongsha area of the second drilling project in 2013.(d) The 35 evaluation results of NGH resource for the SCS.
Why do the 35 evaluation results of NGH resource in the SCS show a distinct variation trend with time compared to the global estimates? By investigating the ten key parameters closely related to these estimates,the following reasons were figured out.
First,the estimates in the SCS are the prospective gas content of NGH,with a low grade level and high uncertainty.For example,the key parameter for resource evaluation remains almost the same,such as the area favorable for NGH formation varied between 11.2 km2and 93 km2from 2000 to 2004,12.6-60 km2from 2005 to 2008,and 12.6-300 km2from 2009 to 2020.Second,the estimates include the NGH resources in all forms and do not separate the enriched resources from the dispersed NGH resources in mudstones.For example,the key parameter of NGH saturation varies from 1.0% to 14%,with an average of 3.5%.Third,the principles for resource estimates are too simple,which do not take the global advancements of NGH studies into account,including the phaseequilibrium model,drilling data,new resource concept,and current technical limitations.For example,the area ratio and thickness ratio of the NGH confirmed by well drilling were not utilized in the NGH resource evaluation.Fourth,among the 35 resource estimates,34 estimates were obtained by volumetric methods or the like,which are illogically larger than the total gas content obtained by the genetic method (yellow points in Fig.5d),confirming these estimates are “expected gas content”,just like the global NGH estimates in stage I with a low grade level and great uncertainty.
4.2.NGH resource estimates and their variation trend in different stages
To figure out why do the 35 estimates of NGH resource in the SCS show a distinct variation trend compared to the global estimates,evaluation history of the NGH resource in the SCS was divided into seven stages with reference to the characteristics of the global seven different stages for NGH studies.Through geological and geophysical surveys,improved understandings,and drilling data,the nine key parameters in Eqs.(1)-(3) were obtained and the NGH resource in every stages were evaluated by combing Eq.(1)to Eq.(3)and Monde Carlo simulation technique(Table 2).The results show three features:(1)The NGH resource in the first six stages are continuously decreased with time;(2)The grade level and reliability of the NGH resource estimates increase from the prospective gas contents(I-III)to the realistic gas content(IV),then to GIP(V)and TRR(VI);(3)The five key parameters play an important role in calibrating the NGH resource estimates,includingVGHSZ,Karea,Kthick,RR,and RF,as their values are smaller than 100%.The NGH resource estimates with higher grade levels are always smaller than that with lower grade levels,resulting in decreasing estimates in the first six stages.
4.3.CRR evaluation in seventh stages and the possible earliest time for commercial exploitation
The NGH resource estimates in the first six stages show a reduction trend over time(Fig.6),and a variation trend model(Eq.(8)) was established by these six estimates,so as to predict the CRR in stage VII and stage VIII.

where HRP refers to resource potential in different stages,1012m3;Yis time,year.
Utilizing the Eq.(8),the CRRmaxin stage VII(2021-2025) was predicted to be 1.28 × 10¹²m3,the CRRminimarked by a similar asymptote of NGH resources and the earliest time for a large-scale commercial development were predicted to be about 0.8 × 10¹²m3and after 2050,the deduced CRF is about 62.5%.

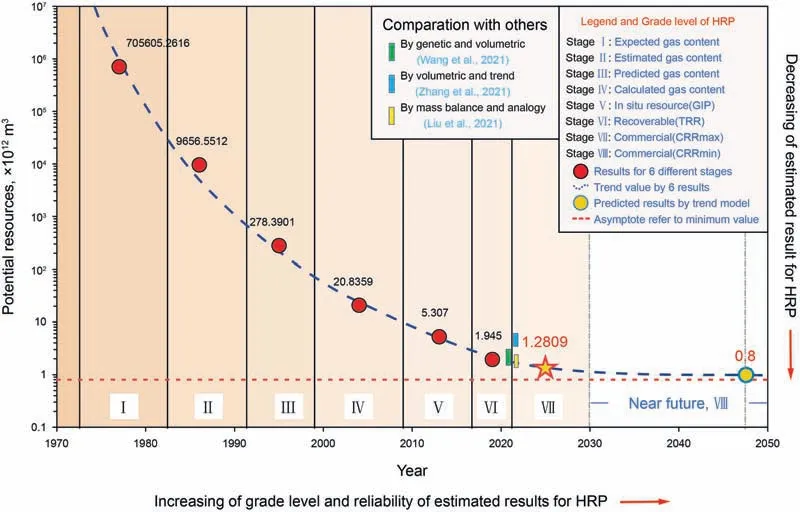
Fig.6.Resource estimates,variation characteristics,and deviation ratio between two years of NGH resource calculated by the trend model at different exploration stages based on global NGH research progress in the SCS.The red points are resource estimates in six stages,the yellow circle is the resource estimate in seventh stage,and the yellow point is the starting time for a large-scale commercial exploitation according to reliable commercially recoverable resources with deviation ratio <3%.
The recoverable gas resource estimate(0.80-1.95×10¹²m3)in the SCS assessed by research progress of the global NGH is consistent with the estimates obtained by the other three methods,showing the feasibility and reliability of this method.The first method is to predict the distribution characteristics of GHSZ in the SCS according to the NGH equilibrium mechanism and the distribution characteristics of temperature and pressure in sedimentary basins.The area ratio,thickness ratio,and resource ratio are determined by statistics of NGH drilling data in the Shenhu Area,Pearl River Mouth Basin.Finally,the volume analogy method and key parameters such as recovery efficiency (30%)were used to evaluate the recoverable resources of the NGH in the SCS (TRR),which was 1.0-4.5 × 10¹²m3(Wang et al.,2021).The second method is that,according to the progress and characteristics of the NGH exploration in the SCS,divided the resource evaluation history into six stages,evaluated the resource in each stage by the volume method,and predicted the NGH resource by a changing trend in estimates and the quantitative model,which was between 4.0 and 6.5×10¹²m3(Zhang et al.,2021).The third method was first to evaluate the total amount (Qcon) of conventional oil and gas resources in the SCS,then to calculate the ratioRGHSZof GHSZ to the rock volume of an F-HDF in the sedimentary basins,and to multiply theQconbyRGHSZto obtain NGH GIP.Finally,by multiplying the GIP with RF of 30%to get the NGH TRR,which was 1.34-1.80×10¹²m3(Liu et al.,2021).The recoverable NGH resources in the SCS obtained by the four methods ranges from 0.8 × 10¹²m3to 6.5 × 10¹²m3,with a mean of 3.33 × 10¹²m3.
5.Implications for NGH resource development in the SCS
5.1.The NGH TRR is too less to support a long-term sustainable development
Global recoverable NGH resources vary from 190 × 1012m3-700 × 1012m3,consistent with the estimates of 300 × 1012m3-600 × 1012m3evaluated by researchers from US and China(Boswell,2009;Boswell and Collett,2011;Pang et al.,2021),but less than 20%of the total conventional oil and gas resource amount.The recoverable NGH resources in the SCS vary from 0.8×10¹²m3-6.5 ×10¹²m3,averagely account for 20.7% of total conventional oil and gas resources (176.83 × 10⁸toe) and about 4%-6% of the previous estimates of 60-90 billion toe,and can only support China for seven years if extracted completely for continuous use at the current annual consumption level of 1.03 × 10¹²m3gas equivalent.
5.2.It is difficult to develop NGH resource duo to complicated geological conditions
NGH resources are mainly distributed in the earth's poles,plateau,and deep sea with harsh climate and complex geological conditions (Boswell,2009).Large-scale exploration is likely to cause geological disasters and environmental pollution (Hope,2006;Knittel and Boetius,2009;Biastoch et al.,2011).The NGH resources in the SCS mainly distribute in the Quaternary soft sedimentary strata on the continental slope(Fig.5),and their water depth ranges from 500 m to 4200 m,with an average of over 1500 m.All these indicate that the large-scale development and utilization of NGH resources in the SCS needs much higher-level technologies to prevent geological disasters and ensure environmental safety.
5.3.Commercial exploitation is too late to compete with other energy sources
NGH is a type of low-carbon,green,high density,and highquality energy,seemly meeting requirements of human society for future energy.However,after entering a commercial market,it will face a fierce competition with renewable energy and other unconventional oil and gas resources.Previous studies showed that the global ratio of renewable energy was 15.2% in 2017 and was expected to exceed 30% by 2050,and the unconventional oil and gas are also growing rapidly,with 45%in 2017 and over 65%by 2050(British Petroleum,2016;Zou et al.,2015).Although some studies proposed that the earliest time for commercial exploitation of the NGH resource would be 2030 or 2036 (Bouhaya,2018),most scholars,including the authors,hold that it should be after 2050(Cheng,2001;Boswell and Collett,2006;Kerr,2004).At that time,its role as an energy alternative will be marginalized or completely abandoned.
6.Conclusions
(1) The 29 estimates of the global NGH resource from 1973 to 2020 represent a reduction trend,indicating improved understandings of NGH formation and distribution mechanisms and also the improved resource evaluation methods,and the estimates are getting closer to the reality.
(2) Four key factors lead to reduction of NGH resource estimates,including uncovering of NGH formation mechanisms,exploration and well drilling,NGH resource concept establishment,and technology limitations,which reduce the estimates by 6.4,158,10,and 3 times,respectively.
(3) Recoverable NGH resources in the SCS and the world were predicted by a decreasing trend model,accounting for less than 20% of their total conventional oil and gas resources.
(4) NGH resource is incapable of being the major energy in future in China or the world,due to its low resource potential and a lack of advantages in competition with other renewable energy and unconventional oil and gas.
Author's contribution
Chengzao Jia introduced the issue and organized authors to discuss relative problems and their significance as well as giving his guidance in research work;Xiongqi Pang proposed new methods and workflow of the volumetric approach,statistical trend analysis,mass balance simulation,and conducted them with Tao Hu,Tong Wang,Xu Zhi,Xiaohan Liu,Xingwen Zhang,Enze Wang,Zhuoya Wu,and Bo Pang;Zhangxing Chen reviewed the original results and guided the prediction of future NGH resources potential and commercial production time of NGH resources in the SCS and the world;Zhuoheng Chen reviewed the original manuscript and made a revision by adding some essential data from Canada and the world;Hesheng Shi investigated a NGH distribution in the SCS and studied its drilling results.
Acknowledgements
This study was financially supported by the CAS consultation project (2019-ZW11-Z-035),the National Basic Research Program of China (973) (2006CB202300,2011CB201100),China High-Tech R&D (863) Program Project (2013AA092600).The manuscript was reviewed and revised under the guidance of Professor Deli Gao,an academician of the Chinese Academy of Sciences.
杂志排行

Petroleum Science的其它文章
- Evaluation of natural gas hydrate resources in the South China Sea by combining volumetric and trend-analysis methods
- The influence of water level changes on sand bodies at riverdominated delta fronts:The Gubei Sag,Bohai Bay Basin
- Source of silica and its implications for organic matter enrichment in the Upper Ordovician-Lower Silurian black shale in western Hubei Province,China:Insights from geochemical and petrological analysis
- Influence of structural damage on evaluation of microscopic pore structure in marine continental transitional shale of the Southern North China Basin:A method based on the low-temperature N2 adsorption experiment
- Application of multi-attribute matching technology based on geological models for sedimentary facies:A case study of the 3rd member in the Lower Jurassic Badaowan Formation,Hongshanzui area,Junggar Basin,China
- Research progress on seismic imaging technology