Evaluation of natural gas hydrate resources in the South China Sea by combining volumetric and trend-analysis methods
2022-03-30XingWnZhangTaoHuXiongQiPangYaoHuTongWangEnWangZhiXuXiaoHanLiuZhuoYaWu
Xing-Wn Zhang ,Tao Hu ,Xiong-Qi Pang * ,Yao Hu ,Tong Wang ,En-Z Wang ,Zhi Xu ,Xiao-Han Liu ,Zhuo-Ya Wu
a Laboratory of Petroleum Resources and Prospecting,China University of Petroleum (Beijing),Beijing 102249,China
b College of Geosciences,China University of Petroleum (Beijing),Beijing 102249,China
c CNOOC International Limited,Beijing 100029,China
d School of Earth & Space Sciences,Peking University,Beijing 100871,China
e Research Institute of Petroleum Exploration and Development,PetroChina Company Limited,Beijing 100083,China
Keywords:Resource evaluation Natural gas hydrates The South China Sea Volumetric method Trend-analysis method
ABSTRACT Natural gas hydrate (NGH),considered as a type of premium energy alternative to conventional hydrocarbons,has been broadly studied.The estimate of the total NGH resources in the world has decreased by more than 90%since the first evaluation in 1973.Geographic and geophysical conditions of the South China Sea (SCS) are favorable for the formation of NGH,which has been proved by drilling results up to date.The recoverability of the NGH in the SCS has been confirmed by the production tests using both vertical and horizontal wells.Since 2001,35 estimates of NGH resources in the SCS have been made,with relatively stable results varying between 600 and 900 × 109 ton oil equivalent.In these estimations,the volumetric method was commonly adopted,but the geological conditions,the migration-accumulation mechanisms of NGH,and the practical recoverability were not considered.These estimates cannot be regarded as evaluated resources according to the international resource evaluation standards,but are at most about prospective gas content of NGH,thus inefficient for guiding explorations and developments.To solve these problems,this study divides the past NGH surveys in the SCS into seven stages,acquires key geological parameters of every stage based on previous studies and analogy with other areas,evaluates the NGH resources of these seven stages by using the volumetric method,then adopts a new trend-analysis method to simulate the downward trend of these estimates,and finally predicts the NGH resources in the SCS at 2025 and 2030.The downward trend is because of the continuous improvement of NGH understanding over time,which is consistent with the trend of global NGH estimates.At the present stage (from 2019 to 2021),the average technically recoverable resource (ATRR) is 7.0 × 10¹² m3,and the estimates of 2025 and 2030 ATRR are 6.46 × 10¹² m3 and 4.01×10¹² m3 respectively,with a difference of less than 40%.Therefore,it can be inferred that the ATRR of NGH in the SCS is between 4.0 and 6.5 × 10¹² m3,with an average of 5.25 × 10¹² m3.
1.Introduction
Natural gas hydrate (NGH) is a solid and combustible mineral present under the permafrost,marine sediment layers and plateau ice covers,and formed by the combination of methane and water molecules in low-temperature and high-pressure environments(Collett,2002).Like other unconventional resources,such as shale oil,which gained increasing attention recently(Hu et al.,2021a,b),NGH has been considered as a premium form of energy for the future and its earliest assessment result was up to 3.1 × 10¹⁸m3(Trofimuk et al.,1973),which could support the global use for 0.4 million years at the current energy consumption level if completely recovered.However,as indicated by many later studies,the potential resources of global NGH are likely much lower than the earliest assessment.The 29 estimates in the past 40 years show a pattern of stable decrease over time with the latest evaluation result less than 1/10000 of the initial estimate (Fig.1).A recent study reveals the global recoverable resources of NGH is less than 5%of the conventional petroleum,and therefore it is hard for NGH to substitute the latter in the future(Pang et al.,2021a).
Resource evaluation of NGH mostly depends on the geological theories,methods,and parameters used in the evaluation.Currently,there are three methods to assess NGH resources,i.e.,the volumetric method,the genetic method and the trend-analysis method.
Principle of the volumetric method:The method was first adopted by Trofimuk et al.,at 1973 and then widely used in the 1970s and 1980s.19 out of the previous 29 global NGH resource estimations used this method.Its principle is relatively simple,mainly considering the distribution and characteristics of NGH within reservoirs and can be expressed quantitatively as Eq.(1).

WhereQis the potential NGH resources;SNGHis the hydrate distribution area;HNGHis the average thickness;φ is porosity;Sghis the gas hydrate saturation;Kgasis the gas volume conversion coefficient.
However,this method does not consider the source of natural gas.Most importantly,the difficulty of accurately determining the values of the parameter in Eq.(1)also impacts the efficiency of this method,especially in the 1970s and 1980s when only a few NGH reservoirs were discovered around the world.Even though some parameter values could be acquired through wells,the representativeness still needs to be checked with more samples.
Principle of the genetic method:This method takes the source of natural gas and the amount of gas in NGH into consideration and can be further improved based on gas features(Archer et al.,2002;Buffett and Archer,2004).Pang et al.(2021a,b)and Liu et al.(2021)considered both NGH and conventional hydrocarbon resources as the products of global petroleum systems,connected their formations based on the mass balance law,and analogically calculated their resources according to the differences of their formation conditions,which is shown in Eqs.(2) and (3):

whereQNGHis the total potential NGH resources;Qconis the conventional oil and gas resource,including normal trapped oil and gas resources,reformed heavy oil and bitumen resources,and solid NGH resources;RNGHis the ratio of total NGH resources to the total oil and gas resources in the free dynamic field(F-HDF);VGHSZis the stratigraphic volume of gas hydrate stable zone (GHSZ);VF-HDFis the stratigraphic volume of free hydrocarbon dynamic field above the Buoyance-driven Hydrocarbon Accumulation Depth (BHAD);SGHSZis the average area of GHSZ;HGHSZis the average thickness of GHSZ;SF-HDFis the average area of F-HDF;HF-HDFis the average thickness of F-HDF.
This method has solid theoretical basis,but needs precise estimates of conventional hydrocarbon resources or other data related to gas generation mechanisms and amount.

Fig.1. Evaluation results of global hydrate resources by trend-analysis method (Pang et al.,2021a).
Principle of the trend-analysis method:The understanding of NGH characteristics improves with the advances in research and accumulation of more practical data,thus leading to more objective and accurate results in the following studies.Therefore,the changing trend presented by the results obtained from the past studies across the last 40 years reflects the increasingly mature cognition process and it is useful to analyze this trend for establishing a fitting model and predicting future results.The decreasing trend of the global NGH resource estimate reflects that the early evaluation results were too optimistic (Pang et al.,2021a).In comparison with the above two methods,the trend-analysis method bridges the gap caused by the adoption of different evaluation methods and techniques at different periods.If researchers in different periods did not timely apply new theories or update evaluation parameters,the evaluation results and understanding of NGH resources would have stagnated.
Current problems of resource evaluation of NGH in the South China Sea (SCS):a 60-day vertical-well production test was conducted successfully in the Shenhu Area of the SCS at 2017(Xu et al.,2017).A second round of 30-day test from a horizontal well in 2020 has totally produced gas of 861.4×10³m3(Ye et al.,2020).Success of these tests suggests the technical recoverability of NGH and paves the way for the larger-scale development of NGH in China.However,in the last 30 years,there have been 35 assessments on potential resources of NGH in the SCS and all of their results fall into the range of 60 to 90 × 1012m3(Xu et al.,2021).The volumetric method has been the primary method used to evaluate the NGH resources in the SCS (Wang et al.,2021;Pang et al.,2021c).The influences of the NGH formation conditions and migrationaccumulation factors within gas hydrate stable zones (GHSZ)were not considered in these studies,and also not considered was the NGH recoverability.Therefore,these estimates only correspond to the prospective gas content of NGH.It needs to mention that the China government has been focusing on the drilling and exploration engineering for NGH and neglected the resource estimations,indicated by the fact that none of the 24 initiated nation-level projects involves the evaluation of NGH resources,which is completely different from the situation in some developed countries where 8 of the 10 key projects focus on resource evaluation.Therefore,it is necessary to systematically assess NGH resources in SCS,and to determine the in-place and technically recoverable resources,which is critical for the formulation of strategies of comprehensive exploration and development of NGH and the relieving of energy supply stress in China.
2.Geological background and methodology
2.1.Geological characteristics of the SCS and NGH formation conditions
Passive continental slopes develop in the northern and southern regions in the SCS,providing favorable areas for NGH formation and accumulation.Through rifting and shear subsidence,a series of medium and large sedimentary basins were formed in the northern region.In the eastern region,the SCS plate subducted eastwards at the Manila trench,with the formation of imbricated accretionary wedges.The southern part experienced three stages of subduction,convergence and compressional subsidence,forming a series of composite sedimentary basins (Wei et al.,2012).Many structural elements in favor of the NGH accumulation,such as mud diapirs,accretionary wedges,polygonal faults and tectonic slope-breaks,have developed in these areas.Especially,the development of diapirs is a great advantage for the gas migration.Deep gas can migrate to sea beds along the conducting systems formed by diapirs and then deposit as NGH.Some diapirs do not thrust overlying formations,but fissures resulted from the deformation of the overlying formations are also favorable for hydrocarbon migration(Zhang et al.,2007;Liu et al.,2017;Li et al.,2018;Cai et al.,2020),which is demonstrated by the deep petroleum systems in the Gulf of Mexico Basin as well (Zhang et al.,2021).
Quaternary sediments developed at the slopes in the SCS include clay silts and silty clays,with the sand content of less than 5% in general.The lithological characteristics are similar to sediments deposited in other NGH-bearing basins in the world(Li et al.,2021).Since Paleogene,there have been three rapid subsidence in the SCS,resulting in the supplement of more sediments and higher deposition rates,which has positive impacts on the NGH formation,migration and accumulation.Through the studies of shallowdeposited samples,it has been found that the Xisha Trough,Zhongjiannan Area,Wanan Basin and Zengmu Basin in the SCS are featured with high sedimentation rates(Su et al.,2005).In addition,there are many large and medium Cenozoic sedimentary basins and uplifts in the SCS,with thicknesses of 2 to 11 km,which are rich in organic matters.In general,the continental shelf areas in the SCS have the lowest organic carbon (OC) content,the deep-sea basins have medium-level OC content,and the continental slopes have the highest OC content that varies from 0.36% to 1.88%.The Qiongdongnan Basin,Dongsha Basin and western continental slope are featured with medium OC content (Su et al.,2005).Kvenvolden(1985) suggests that the biogenic gas required for NGH formation can be formed in a basin as long as its deposition rate is more than 3 cm/Ka and the OC content is more than 0.5%.
Specific temperature-pressure conditions are required for the formation of NGH.Within the depth range of 300 to 4000 m and the pressure of 3 to10 MPa,the conditions of NGH formation are satisfied (Zhang and Chen,2000).In the SCS Slopes,the bottom water temperature is between 7°C and 10°C when the water depth is 500 m.At a water depth of 1000 m,the temperature is around 5°C,whereas at depth greater than 2800 m,the bottom water temperature is around 2°C (Jin and Wang,2010).The heat flow in the crust of the SCS is relatively high in the whole region and varies in different sea areas.Generally,the heat flow values in the Nansha Trough,Qiongdongnan Basin,Chaoshan Basin,Taixinan Basin,northern Bijianan Basin and Nansha Trough are less than 70 mW/m2(Jin et al.,2004).The average geothermal gradient is 3 to 4°C/hm in the Pearl River Mouth Basin,and is 3.76°C/hm in northwestern slope,and is between 2.4 and 8.5°C/hm in the northern region (Kvenvolden,1985).Although the geothermal gradient in the SCS is relatively high,it is found that it still meets the temperature-pressure conditions for the formation and accumulation of NGH.
2.2.Methodology
In view of the above problems and the current situation of oil and gas exploration in the SCS,both the volumetric and the trendanalysis methods are used to evaluate the in-place and recoverable NGH resources in the SCS.This study is conducted by the following three steps:
(1)Dividing the NGH research history in the SCS into seven stages.The time span of NGH research in the SCS is over 50 years.According to the basic geological theories and comprehensive data sources,the studies in the whole time span can be grouped into seven stages :(I) Stage of global hydrate discovery;(II) Stage of revealing organic genesis of global NGH;(III) Stage of revealing the formation mechanisms of global NGH under high-pressure and lowtemperature conditions;(IV) Stage of NGH geophysical survey in the SCS;(V) Stage of NGH drilling and verification in the SCS;(VI)Stage of NGH drilling and production testing in the SCS;(VII) Stage of NGH drilling and development in the SCS,respectively.
(2)Acquiring key parameters from past seismic,drilling and experimental results in the SCS and other regions and evaluating NGH resources.The volumetric method is utilized for every stage,and key parameters are shown in Eq.(1).Research at different stages show different understandings about the distribution and properties of NGH,thus the obtained parameter values changed over time.These parameter values ranged within specific intervals and can be represented by their minimums,maximums,means and modes.In this situation,the Monte Carlo simulation is adopted to calculate the NGH resources of every stage,and corresponding results are characterized by cumulativeprobability and statistic values,includingQ10,Q50,Q90(corresponding toP10,P50andP90of Monte Carlo simulation),Qmode andQaverage.
(3)Analyzing the changing trend of estimates of the seven stages and establishing quantitative models to predict future theoretical values and determine thefinal NGH resources.The results obtained by the volumetric method are not same in each stage,showing the changing understanding of NGH over time.To eliminate the effect of different understandings and get more objective results,all the estimates in the seven stages need to be considered together and the analysis of their trend is a proper way.A fitting model can be established through this analysis.The goodness of fit is checked.When theR2is close to 1,it means the changing trend of the resource estimates is well represented by this model.Then the model can be used to predict future estimates,such as in 2025 and 2030.Projecting the trend into the future time can provide insights for more objective NGH evaluation results.When the values yielded by the model become stable or show small change (<50%)from 2025 to 2030,their average is viewed as the objective NGH resource estimate.
3.Results and discussion
3.1.Advances and stages of NGH surveys in the SCS
China has conducted many geological surveys of NGH in the SCS.In 2007,2013,2015 and 2016,China Geological Survey(CGS)carried out four NGH drilling projects,and obtained NGH samples in the Dongsha Basin,Shenhu Area and Qiongdongnan Basin (Cui et al.,2009;Yang et al.,2017a,b;Cui et al.2021).Most of the NGH found up to date are concentrated in the northern SCS.Bottom Simulating Reflector (BSR) evidence indicates the possible existence of NGH accumulation in the central and northern parts of the Taixinan Basin,central and southern parts of the Pearl River Mouth Basin,north-western part of the Xisha Trough and central part of the Qiongdongnan Basin.For the southern SCS,due to technical and political factors,NGH explorations are relatively scarce.However,by considering the temperature and pressure conditions in this region,the effective distribution area of NGH can be roughly drawn and the minimum seawater depth for hydrate formation is 528 m(Wang et al.,2021).
The past NGH surveys and explorations in the SCS can be roughly divided into seven stages (Table 1).Herein,this study names the results in the seven stages as expected gas content of NGH,predicted gas content of NGH,approximated gas content of NGH,estimated gas content of NGH,in-place gas content of NGH,in-place NGH resources,and technically recoverable NGH resources.
The evaluation results in the first five stages are of low accuracy and high uncertainty,and cannot be regarded as resources but rather the gas content of NGH.The results in the latter two stages are of much higher accuracy,and the estimated values belong to the category of resources and can be used to guide NGH exploration and development and the making of policies.
3.2.The first stage-NGH resource assessment based on key parameters such as the water area of the SCS
From 1973 when the global NGH was first assessed to 1978 before the earliest NGH research in the SCS,NGH had been found in sea areas,plateaus and polar ice sheets around the world(Hitchon,1974).At this stage,no specific research targeted the NGH in the SCS(Milton,1977),and the whole water area of the SCS is viewed as the favorable NGH distribution area when its resources is evaluated(Fig.2a).Therefore,SNGHis approximately 350 × 104km2at this period.By analogy with parameters of other similar areas used by the studies at the same period,the favorable NGH thicknessHNGHof the SCS is determined as 300 to 900 m,with an average of 600 m,the reservoir porosity φ is 80%,the NGH saturationSgis 100%,and the gas volume conversion coefficientKgasis 150 to 180,with a mode of 180(Trofimuk et al.1973,1975;Cherskiy and Tsarev,1977).According to these parameters,the evaluation results of potential resourcesareQ10=298721.33×1012m3,Q90=262272.73 × 1012m3,andQaverage=281461.97 × 1012m3(Fig.2b).The results have the lowest level of certainty,which is only equivalent to the expected gas content of NGH(I in Table 1).

Table 1 Investigation stages,key parameter sources and result reliability of gas hydrates in SCS.
3.3.The second stage-NGH resource assessment based on key parameters such as the sedimentary basin area of the SCS
In this period from 1979 to 1997,the genetic mechanism that NGH was generated from sedimentary organic materials was recognized (Kvenvolden,1993),and research at this stage focused on the basic geological characteristics of the SCS(Yao and He,1982).Some projects conducted by overseas institutes concentrated on the tectonic and sedimentary evolution of the SCS using geophysical methods,and produced a series of geological atlas(Gong and Li,1998).NGH was not viewed as a key point of research during this stage and only some sparse NGH occurrences were discovered.In this stage,the whole area of sedimentary basins in the SCS can be defined as the NGH-bearing area,thusSNGHis 120 to 126×104km2(Fig.3a).The NGH thicknessHNGHis assigned to the thicknesses in similar basins measured in the same period that is 277 to 500 m with a mode of 450 m.Compared with the global NGH resource evaluation in the same period,the reservoir porosity φ can be assigned as 30%to 50%with a mode of 50%,saturationSgis 10%to 100%with a mode of 40%,and the volume conversion factorKgasis 140 to 180 with a mode of 170 (Kvenvolden,1988).Using these parameters and Monte Carlo simulation,NGH resources are calculated asQ10=20984.21×1012m3,Q90=16754.71×1012m3,andQaverage=18999.92×1012m3(Fig.3b).These values are still of low certainty,which is only equivalent to the predicted gas content of NGH(II).
3.4.The third stage-NGH resource assessment based on key parameters such as the area of GHSZ in the SCS
In the third stage from 1998 to 2002,the formation mechanisms of NGH in high pressure-low temperature GHSZ was broadly recognized (Sloan,1998),which initiated research about NGH resource evaluation in the SCS.At this time,China officially joined the Ocean Drilling Program (ODP) and began to study NGH in the SCS.The aim of the program was to determine whether there were abundant NGH resources in this area,so as to point out the working direction for the next stage.Research at this stage mainly used the seismic data,and the study area covered several major basins in the SCS,such as the Xisha Trough,Bijianan Basin and Zengmu Basin,and so on(Zhang and Chen,2000).Because of the low accuracy of the seismic data and the lack of detailed studies,the determination of the NGH-bearing area at this stage was based on the distribution of the high pressure-low temperature stable zones.In this view,superimposed areas of stable zones and basins were regarded asthe main distribution area of NGH (Fig.4a),corresponding to the slopes and ocean uplifts with water depth greater than 400 and 500 m,thus theSGHSZis 90 to 118 × 104km2with a mode of 93×104km2(Yao,1998;Zhang and Chen,2000;Yao,2001).Based on seismic data analysis and contemporary studies,other key parameters can also be obtained,includingHGHSZranging from 350 to 500 m,with an average of 400 m,φ equals to 50%,Sgto 5%andKgasto 155(Yao,2001;Zhang et al.,2002).The evaluated resources areQ10=10580.47 × 1012m3,Q90=1982.83 × 1012m3andQaverage=5803.28 × 1012m3(Fig.4b).These values are only equivalent to the approximated gas content of NGH(III).
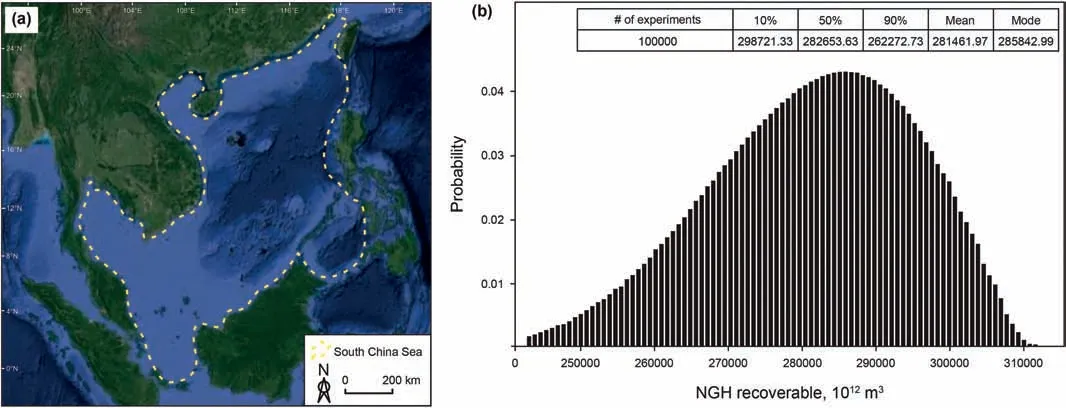
Fig.2.Distribution characteristics and the evaluation results of NGH resources in the SCS at the first stage.a Water area and submarine geographic features of SCS.b Monte Carlo simulation of expected gas content of NGH in the SCS.

Fig.3.Distribution characteristics and the evaluation results of NGH resources in the SCS at the second stage.a Area of sedimentary basins in the SCS.b Monte Carlo simulation of projected gas content of NGH in the SCS.
3.5.The fourth stage-NGH resource assessment based on the BSR distribution in GHSZ
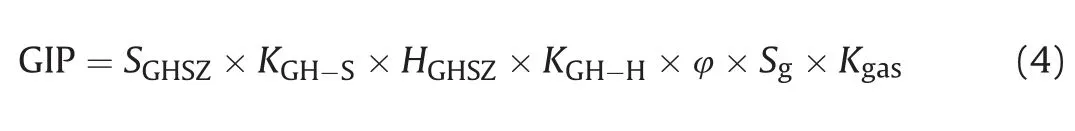
The fourth stage is from 2003 to 2006.At this stage,with the improved understanding of NGH formation and accumulation mechanisms,the distribution of NGH in the SCS could be more accurately predicted by the data of bottom water temperature,geothermal gradient and water depth.In the Shenhu Area,the NGH distribution was delineated by seismic methods(Zhang et al.,2003;Zeng and Zhou,2003;Wang et al.,2004;Zhu,2004).The area of the Shenhu Area is 3000 km2,and the BSR area is 727 km2(Fig.5a1),so the area ratioKGH-Sis 0.242(Fig.5a).Due to the low resolution of seismic data,the thickness of NGH in the Shenhu BSR area is approximated to the thickness of the carrier beds(KGH-H=1),which has an average value of 400 m,the same thickness value used for the last stage.Other data collected in this period revealed that average porosity of NGH bearing beds(φ)is 45%,Sgis 5% andKgasis 121.5 to 160.5,with a mode of 150 (Ge et al.,2006;Liang et al.,2006;Zeng et al.,2006).According to Eq.(4),which has both area and thickness coefficients added compared to Eq.(1),NGH potential resources are evaluated asQ10=318.24 × 10¹²m3,Q90=238.85 × 10¹²m3andQaverage=279.42 × 10¹²m3(Fig.5b).These values are the estimated gas content of NGH(IV).
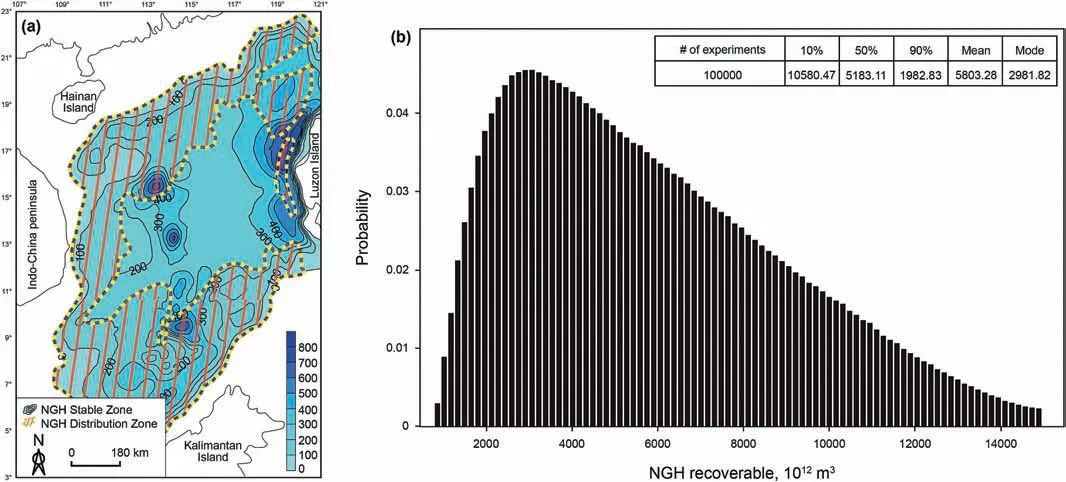
Fig.4.Distribution characteristics and the evaluation results of NGH resources in the SCS at the third stage.a Area of NGH in the SCS(modified from Yao,2001;Zhang et al.,2002;Xu et al.,2010).b Monte Carlo simulation of approximated gas content of NGH in the SCS.
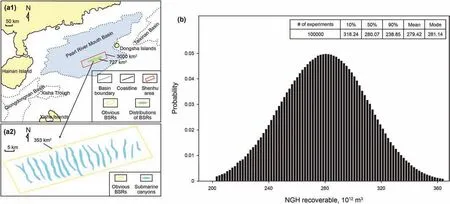
Fig.5.Distribution characteristics and the evaluation results of NGH resources in the SCS at the fourth stage.a BSR area in the Shenhu Block of SCS (modified from Wang et al.,2010).b Monte Carlo simulation of the estimated gas content of NGH in the SCS.
3.6.The fifth stage-NGH resource assessment based on drilling results in the BSR distribution area
Research on NGH in the SCS focused on the Shenhu Area at the fifth stage from 2007 to 2012,which promoted the drilling of NGH in this area (five wells totally) and increased NGH data (Yang et al.,2007;Lu et al.,2008;Qian and Zhu,2008;Yao et al.,2008;Wang et al.,2010).These data were complementary to the previous seismic data,and helped increasing the exploration precision(Huang and Zhang,2009;Nguyen,2012).At this stage,the NGH area in the Shenhu Area decreases to 353 km2(Fig.5a2),indicating a decline ofKGH-Sto 0.12.Moreover,based on the well data,KGH-His revised to 0.01-0.11,with a mode of 0.05 (Fig.6a,b),the porosity is 45%,the saturation is changed to 25%,and the gas volume conversion coefficientKgasto 140-170,with a mode of 164(Fig.6c)(Lu et al.,2008;Boswell,2009;Wang et al.,2010;Boswell and Collett,2011).Based on Eq.(4),the evaluation results areQ10=65.68 × 10¹²m3,Q90=41.85 × 10¹²m3,Qaverage=53.46 × 10¹²m3(Fig.6d).These estimates are still not resources in the real sense,only equivalent to in-place gas content of NGH proved by drilling(V).

Fig.6.Statistical analysis of the three key parameters and Monte Carlo simulation of in-place gas content of NGH in the SCS at the fifth stage.a Thickness of gas hydrate stability zone.b Hydrate-containing thickness ratio.c Volume ratio of hydrate.d Gas content in place of NGH.
3.7.The sixth stage-NGH resource assessment based on key parameters such as the resource coefficient of NGH
NGH studies in the Shenhu Area continued to advance in the sixth stage from 2013 to 2018(Sun et al.,2013;Gong et al.,2014;Su et al.,2014;Zhang,2014).During this period,the first 60-days production test was completed,with a total of 19 wells drilled and an average daily gas production of 5151 m3(Xu et al.,2017).Systematically analysis of the well data improved the understanding of NGH occurrence mode that enriched NGH did not occur in a continuous state but in different layers and plays,with the porosity of 23%to 51%(mode 40%),saturation of 10%to 34%(mode 28%)(Fig.7a,b) (Yang et al.,2017a,b;Wang et al.,2018).Statistical results of NGH drilling in the Shenhu Area further showed that the resource coefficient(RGH),which is the ratio of the amount of NGH satisfying the resource enrichment boundary (accumulated thickness >2 m,porosity >12%,saturation >20%)to the total amount of NGH,was in a wide range of 0.1 to 0.9 with the mode value at 0.4(Fig.7c).The in-place resources of NGH(VI)in the SCS(Fig.7b)are evaluated asQ10=30.96 × 10¹²m3,Q90=7.72 × 10¹²m3,Qaverage=16.55×10¹²m3(Fig.7d)on the basis of Eq.(5),which has the resource coefficientRGHadded compared to Eq.(4):

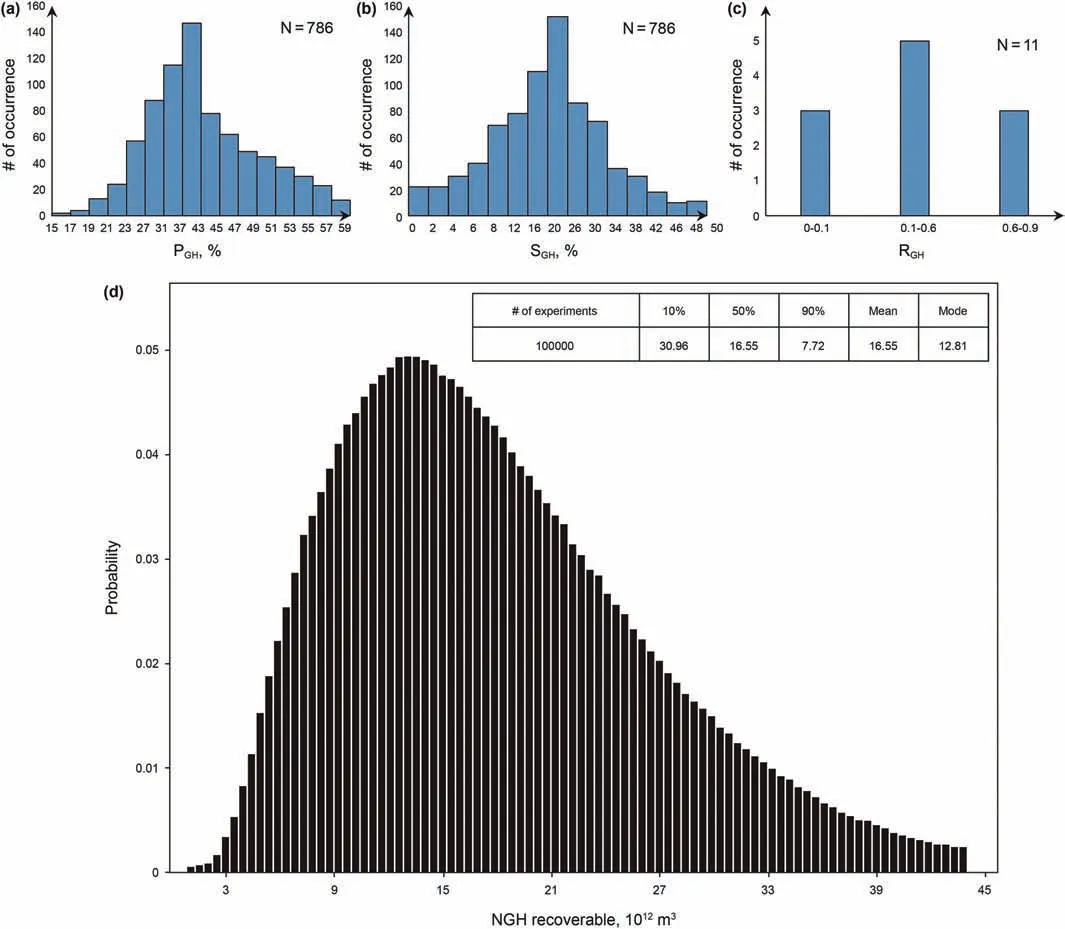
Fig.7.Statistical analysis of the three key parameters and Monte Carlo simulation of in-place resources of NGH in the SCS at the sixth stage.a Reservoir porosity.b Hydrate saturation in reservoirs.c Ratio of hydrate resources.d Resources in place of NGH.
3.8.The seventh stage-NGH resource assessment based on key parameters such as the recovery factor of NGH
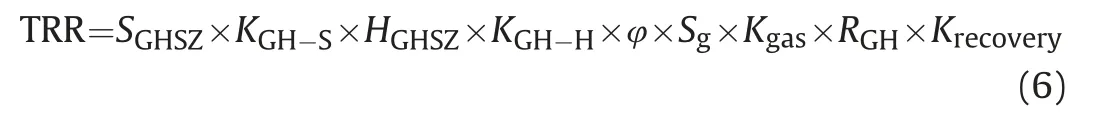
The seventh stage is from 2019 to present.The second test production was conducted in this period and the accumulated gas production was 861.4×10⁴m3,confirming the possibility of largescale exploration of NGH as the potential energy(Yu et al.,2019;Ye et al.,2020;Shaibu et al.,2021).From a practical point of view,the part able to be recovered under current technical level needs to be evaluated.At present,there are no commercial NGH exploitation globally and the actual NGH recovery factor data cannot be obtained by reference to any exploitations in the past,so the NGH recovery factorKrecoveryobtained through physical and numerical simulations is used in this study.Krecoveryfrom different simulations varied from 15%to 70%,with an average of about 30%(Fig.8a,b).By applying Eq.(6)with the additional recovery factor,it can be obtained that the technically recoverable resources of NGH in the SCS areQ10=13.43 × 10¹²m3,Q90=2.07 × 10¹²m3,Qaverage=7.0 × 10¹²m3(Fig.8c).
3.9.The trend of NGH resource evaluation results and the evaluation of objective recoverable resources
The potential resources of NGH in the SCS at the seven stages are evaluated by combining volumetric method and Monte Carlo simulation (Table 2;Fig.9).
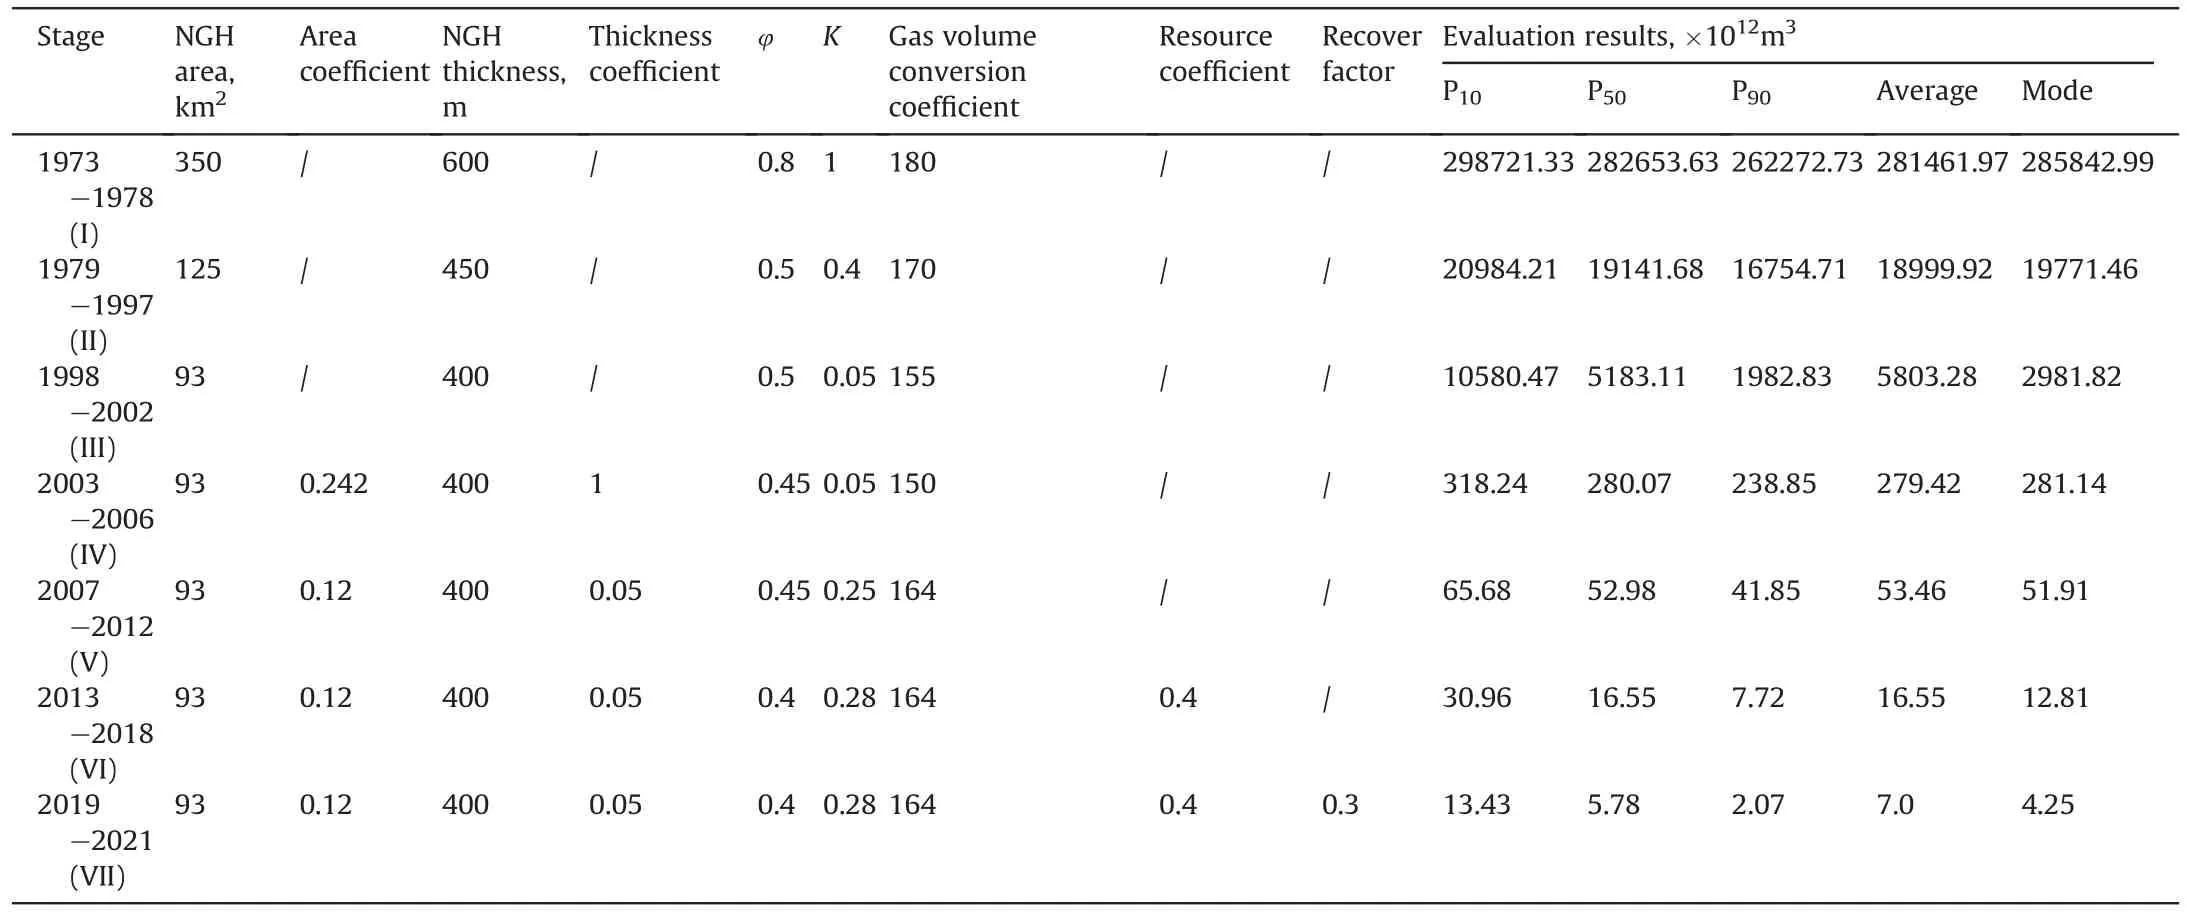
Table 2 Parameters(mode or average)and assessment results of NGH in SCS at seven stages.

Fig.8.a Results of the simulation on the recoverable coefficient of NGH(modified from Konno et al.,2014),b the enrichment model of global NGH resources(modified from Boswell and Collett,2011;Pang et al.,2021a),and c Monte Carlo simulation of technically recoverable resources of NGH in the SCS at the seventh stage.
These results clearly show a decreasing trend from stage (I) to stage (VII),reflecting the continuous improvement in the understanding and evaluation parameters of NGH.The estimate results decrease from the original average of 281461.97 × 1012m3to the current average of 7.0 × 10¹²m3(Table 2),reducing by over 99%.Especially after obtaining the drilling data from specific areas,the evaluation parameters have been more comprehensively revised.
Moreover,the accuracy levels of the results obtained at different stages vary significantly.The early results are only equivalent to prospective gas contents of NGH,and are not within the resources categories in the USGS classification,and thus could not be used to guide NGH exploration and development.On the contrary,the amounts of in-place and recoverable resources obtained in the most recent evaluations more precisely reflect the potential of NGH in the SCS.These recent evaluations may still be biased,due to the fact that thin-layer and small-scale NGH are not deducted and the recovery data are only obtained from physical and numerical simulations.
In this study,a prediction model is established based on the trend of the results over time (Eq.(7),R2=0.91).Based on it,the average values of NGH recoverable resources estimated in 2025 and 2030 are predicted to beQ2025=6.46 × 10¹²m3andQ2030=4.01 × 10¹²m3,which are considerably close,with a variation of less than 40%.Therefore,it can be inferred that the recoverable resources of NGH in the SCS is 4.0 to 6.5×10¹²m3,with an average of 5.25 × 10¹²m3.

Fig.9.Trend of resource assessments of NGH in SCS and its comparison with predictive results.

4.Conclusion
This study systematically analyzes the history of evaluating NGH resources in the SCS and divides it into seven stages.The evaluation results at the seven stages show an overall decreasing trend,with the estimate at the seventh stage about 1/40000 of that at the first stage.The trend reflects the continuous improvement of understanding on NGH resources,and also indicates the increasing objectivity and accuracy of the estimates due to more NGH geological seismic data and drilling well data in the SCS.A quantitative model tracking the decreasing trend predicts that the potentially recoverable NGH resources at 2025 and 2030 will be 6.46×10¹²m3and 4.01 × 10¹²m3respectively,with a decrease of 40% from 2025 to 2030,much smaller than the 400% drop between the first and the second stage.Therefore,the predicated recoverable NGH resources in the SCS range from 4.0 to 6.5 × 10¹²m3,with an average of 5.25 × 10¹²m3.
Acknowledgment
This research was financially supported by the CAS consultation project“South China Sea Oil and Gas Comprehensive Development Strategy”(2019-ZW11-Z-035),the National Basic Research Program of China (973 Program) (2006CB202300,2011CB201100) and the National High-Tech R&D Program of China (863 Program)(2013AA092600).We would like to thank Jia Chengzao and Gao Deli,academicians of Chinese Academy of Sciences,for their insightful comments and specific and feasible suggestions to our manuscript revision.
杂志排行

Petroleum Science的其它文章
- Reduction of global natural gas hydrate (NGH) resource estimation and implications for the NGH development in the South China Sea
- The influence of water level changes on sand bodies at riverdominated delta fronts:The Gubei Sag,Bohai Bay Basin
- Source of silica and its implications for organic matter enrichment in the Upper Ordovician-Lower Silurian black shale in western Hubei Province,China:Insights from geochemical and petrological analysis
- Influence of structural damage on evaluation of microscopic pore structure in marine continental transitional shale of the Southern North China Basin:A method based on the low-temperature N2 adsorption experiment
- Application of multi-attribute matching technology based on geological models for sedimentary facies:A case study of the 3rd member in the Lower Jurassic Badaowan Formation,Hongshanzui area,Junggar Basin,China
- Research progress on seismic imaging technology