Source of silica and its implications for organic matter enrichment in the Upper Ordovician-Lower Silurian black shale in western Hubei Province,China:Insights from geochemical and petrological analysis
2022-03-30QunShngCiMingYiHuBoMinZhngNgongNgiAnLiuRuiQunLioOumrKnHiLiZhongGuiHuQingJiDngJunJunShn
Qun-Shng Ci ,Ming-Yi Hu ,Bo-Min Zhng ,Ngong Ngi ,An Liu ,Rui-Qun Lio ,Oumr Kn ,Hi Li ,Zhong-Gui Hu ,Qing-Ji Dng ,Jun-Jun Shn
aSchool of Geosciences,Yangtze University,Wuhan,Hubei 430100,China
b Key Laboratory of Tectonics and Petroleum Resources of Ministry of Education (China University of Geosciences),Wuhan,Hubei 430074,China
cWuhan Center of China Geological Survey,Wuhan,Hubei 430205,China
d Department of Geology,University of Buea,P.O.Box 63,Buea,Southwest,Cameroon
e School of Petroleum Engineering,Yangtze University,Wuhan,Hubei 430100,China
Keywords:Biogenic silica Terrigenous siliciclastic input Organic matter enrichment Black shale Continental shelf Sea-level change Wufeng-Longmaxi formations
ABSTRACT To improve the understanding of the relationship between silica source and organic matter accumulation,the origin of silica and its implications for organic matter enrichment in the Upper Ordovician-Lower Silurian (O3w-S1l) black shale in western Hubei Province in the middle Yangtze area,were investigated through geochemical and petrological analyses.The results show that the O3w-S1l black shale is mainly composed of five lithofacies with varying graptolite abundance,total organic carbon(TOC),and silica contents.Biogenic silica and terrigenous siliciclastic input constitute the main silica sources in O3w-S1l black shale and they exhibit an upward inverse variation trend interpreted to be related to sea-level changes.Moreover,with the increase in biogenic silica content or decrease in terrigenous siliciclastic input,TOC values in black shale initially rise and then fall,which is different from originally expected simple linear relationship.We infer that organic matter enrichment and the distribution of silica from different origins are controlled by sea-level changes and variations in terrigenous input in a continental shelf with little hydrothermal influence.An environment with appropriate sea level and terrigenous input should be most favorable for organic matter accumulation,rather than one with excessive high sea level and less terrigenous input.
1.Introduction
Siliceous minerals are the primary components of marine organic-rich shale and play an important role in evaluating shale reservoir quality (Dean et al.,1985;Murray et al.,1994;Schieber et al.,2000;Kennedy et al.,2002;Li et al.2013,2018;Keil and Mayer,2014;Wang et al.,2014;Han et al.2016,2018;Milliken et al.,2017;Zhao et al.2017a,2017b;Dong et al.,2019;Xi et al.,2019;Ma et al.,2020;Pan et al.,2020).However,there are multiple sources for silica in marine deposits,including terrigenous,hydrothermal,and biogenic silica (Bio-Si) (Bostrm,1973;Adachi et al.,1986;Murray et al.,1994;Harris et al.,2011;Milliken et al.,2016;Yang et al.,2018;Zhang et al.,2018;Jiang et al.,2019;Khan et al.,2019;Li et al.,2019;Liu et al.,2019;Cai et al.,2020).Different silica sources have various implications for marine environments and shale reservoir characteristics.Siliceous materials with biogenic origins are more enriched along continental margins(Khan et al.,2019;Liu et al.,2019),hydrothermal silica is common in ocean basins and ocean rift environments (Olivarez et al.,1989;Murray et al.,1994;Chen et al.,2006;Zhou et al.,2006;Qiu et al.,2011;Zhang et al.,2018),and proximal sediments contain large amounts of terrigenous silica(Qiu et al.,2018;Yang et al.,2018;Wu et al.,2020).Most siliceous minerals can improve the shale brittleness index,but Bio-Si enrichment is more favorable to forming natural and artificial fractures than other forms of silica(Zeng et al.,2013;Zhao et al.,2017a;Han et al.,2018;Xi et al.,2019).Moreover,in previous researches,Bio-Si content of marine black shale has demonstrated a good linear correlation with total organic carbon(TOC),and can be used to infer paleoproductivity (Nelson et al.,1995;Zhang et al.,2018;Khan et al.,2019;Li et al.,2019;Wang et al.,2019).Unlike Bio-Si,terrigenous silica is usually considered to play a negative role in organic matter accumulation due to dilution and the negative relationship with TOC (Murphy et al.,2000;Sageman et al.,2003;Ji et al.,2020).However,our new research shows that organic matter in marine shale with the highest Bio-Si content or least terrigenous siliciclastic input is not the most enriched,indicating that there may be a more complex relationship between different-origin silica and organic matter accumulation,rather than a simple linear correlation.
To improve the understanding of the relationship between silica sources and organic matter enrichment,three sections (including two drilling cores and one field outcrop section)mainly composed of the Upper Ordovician Wufeng Formation (O3w) and Lower Silurian Longmaxi Formation (S1l) black shale located in western Hubei Province,South China were examined.The main goals of this study are:(1)to systematically analyze the different origins of silica in the O3w-S1lblack shale and their relationships to organic matter enrichment utilizing petrological and geochemical data and (2) to discuss the distribution pattern of different-origin silica and organic matter in a continental shelf environment to improve the understanding of organic matter enrichment mechanisms.
2.Geological background
The study area is located in the western Hubei Province and belongs to the western portion of the Middle Yangtze Platform adjacent to the Sichuan Basin (Fig.1a).As a part of the eastern slope of the ancient Huangling Uplift,the Pre-Cambrian Nanhua-Early Paleozoic Silurian strata in the study area are exposed and the Global Stratotype Section and Point(GSSP)for the base Hirnantian has been established(Fig.1b).In recent years,the O3w-S1lblack shale in the study area has become a hotspot for shale gas exploration in South China due to its immature faults and relatively stable tectonic environment(Li et al.,2012;Chen et al.,2018;Zhang et al.,2019).
From the Late Ordovician to the Early Silurian,the Yangtze Platform underwent non-uniform subsidence and evolved into a semi-enclosed continental shelf surrounded by the Qianzhong,Xuefeng and Chuanzhong uplifts,with gradually intensifying compression and collision between the Cathaysia and Yangtze blocks during the Kwangsian Orogeny (Fig.1a) (Chen et al.,2004;Su et al.2007,2009;Yang et al.,2020).From the beginning of the late Katian to the early Aeronian,the Yangtze Sea experienced several significant sea-level variations related to tectonic subsidence and continental glaciation (Yan et al.,2010;Gorjan et al.,2012;Liu et al.2016,2017),which resulted in the widespread organic-rich black shale deposits of the O3wand lower part of the S1l(Chen et al.,2004;Su et al.,2007;Fan et al.,2011;Xiao et al.,2015).The O3w-S1lblack rock series in the study area is approximately 20 m thick and is primarily composed of carbonaceous shale with ubiquitous siliceous minerals,graptolites,and radiolarians,while the middle and upper S1lare dominated by greyish-green mudstone and siltstone formed in a shallow marine shelf environment caused by sea-level fall resulting from continuous tectonic uplift (Chen et al.,2004;Huang et al.,2018).
3.Samples and methods
One hundred and two (102) samples were collected from the O3w-S1lblack rock series in three sections,including 20 samples from the lower S1lin the Hengshi section,28 samples from Well Yy2,and 54 samples from Well Yy3 (Fig.2).Among them,60 samples were analyzed for element concentration,and a subset of 57 samples was analyzed for TOC.Mineral composition was analyzed in 63 samples,and the graptolite abundance in 54 samples from Well Yy3 was also counted.Samples were sent to the Zhongnan Mineral Resources Supervision and Test Center,Wuhan Center of China Geological Survey (WHCGS) for geochemical analysis,and the mineral analysis was completed at Irock Technology Co.,Ltd.

Fig.1.(a)Paleogeographic map of the Yangzte Block during the Late Ordovician-Early Silurian transition(Modified from Chen et al.,2004 and Zhang et al.,2018).(b)Geological map of the study area showing sampling locations.

Fig.2.Stratigraphic columns of the O3w-S1l series in wells Yy3 and Yy2,and in the Hengshi section showing the sample location.Hir=Hirnantian,O=Ordovician,and WF Fm=Wufeng Formation.
At the WHCGS,all samples were powdered to 200 mesh for geochemical analysis.Samples were analyzed for TOC using a CS844-3250 carbon and sulfur analyzer with an analytical uncertainty of <0.5%.For major element analysis,the major oxides were measured using a Philips PW2404 spectrometer following the Chinese national standard GB/T 14506.Trace and rare elements were analyzed using an Element XR ICP-MS with an analytical uncertainty of <0.5%,following operational procedures detailed by Li et al.(2015).
In IROCK Technology Co.,Ltd,mineral compositions were measured using a Bruker D8 advanced automated powder diffractometer.Powdered samples were scanned from 5°to 90°at 2°/min with a step size of 0.02°.Minerals were identified from the diffractograms and their contents were obtained by using EVA Software.Additionally,a high-resolution field emission scanning electron microscope(FE-SEM)equipped with an energy dispersive spectrometer(EDS) was also used to identify minerals.
The O3w-S1lblack shale cores of Well Yy3 are 7.5 cm in diameter.Hence,it is possible to estimate the graptolite abundance using the number of graptolites on a bedding surface (NGC) and the ratio between total graptolite surface area and core bedding surface area(RGC).Here,the variations in core bedding surface area can be overlooked because of the low stratigraphic dip.
For analyzing silica sources,excess silica (Siexcess) content is adopted to represent the total silica content excluding normal terrigenous silica deposits (Murray and Leinen,1996;Zhang et al.,2018),which can be calculated as follows:where Sisand Alsrefer to the silicon and aluminum contents in samples,respectively.(Si/Al)paasis the average ratio of Si/Al in the Post-Archean Australian Shale (PAAS),which is 3.11 (Taylor and Mcclennans,1985).

The chemical index of alteration (CIA) is often used to evaluate terrigenous detrital input and weathering conditions (Nesbitt and Young,1982;Price and Velbel,2003;Liu et al.,2017),which can be calculated by the following formula:

Here,CaO* only represents the CaO in silicate minerals,which can be amended by CaO*=min[X(CaO)-X(P2O5)×10/3,X(Na2O)] (Nesbitt and Young,1982;Mclennan,1993),whereXrefers to the corresponding oxide content.
4.Results
4.1.Mineral composition
Petrographic observations showed that the O3wand lower S1lin the study area were primarily dominated by organic-rich black shale with locally interbedded dark-gray shale,thin-bedded siltstone,and argillaceous limestone.Analytical data from 63 samples from the Yy2 and Yy3 wells,as well as the Hengshi section revealed that the black shale consists primarily of quartz and clay minerals with secondary carbonate minerals,feldspar,and pyrite(Table 1).
In the black shale samples,quartz content ranged from 27.5%to 91.2%(with an average of 46.7%),and the average quartz content of samples in the O3wand the lower S1lwas 51.8% and 45.8%,respectively.In thin sections,ubiquitous angular quartz was found(Fig.3a and b),as well as biological-related quartz(Fig.3c,d,e).Clay minerals were mainly composed of illite and a mixture of illite/smectite ranging from 5.3% to 65.13% with an average of 39.14%(Fig.3f),showing a gradually increasing upward trend.Feldspar dominated by plagioclase and K-feldspar presented values ranging from 0%to 22.1%,with an average of 7.65%(Fig.3f and g).Carbonate minerals dominated by ferrodolomite and some calcite were primarily distributed in the lower part of the O3w-S1lblack shale(Fig.3h).Dispersed pyrite was widely distributed in all samples,and pyrite framboids were common in SEM images(Fig.3i).
The collected samples were classified into five lithofacies based on mineral composition:siliceous shale,mixed siliceous shale,mixed shale,mixed argillaceous shale,and argillaceous shale(Fig.4).The lithofacies showed significant upward variations throughout the studied profiles.Siliceous shale and mixed siliceous shale were primarily present in the Katian to Rhuddanian sections,while mixed shale was primarily developed in the Hirnantian section.Mixed argillaceous shale and argillaceous shale were widely distributed in the Aeronian section(Fig.4).In addition,the shale color in each profile gradually changed from black to gray vertically.
4.2.Biological fossils
The O3w-S1lblack shale in the study area contains abundant fossils,including graptolites and radiolarians,as well as some spongy spicules and shells (Fig.5).Graptolites,dominated by planktonic graptolites,are primarily distributed in the mixed siliceous shale (Fig.5c),while are less common in siliceous and argillaceous shales(Fig.5a,e).Statistical data from 54 samples from well Yy3 showed that NGC ranged from 0 to 90,and RGC ranged from 0 to 70%.Graptolite abundance in the O3w-S1lblack shale gradually decreases upward(Fig.4),and shell fossils are common in the middle O3wto lower S1l(Fig.5f).The argillaceous limestone with abundant Hirnantia fauna(known as the Guanyinqiao bed)in the black shale is commonly used as a lithological marker to distinguish O3wand S1l(Rong et al.,2002;Chen et al.,2004;Zhan et al.,2010;Fan et al.,2011).Siliceous radiolarians are visible in the black shale with high silica content (Fig.5g),whereas radiolarians are rare in the clay-rich argillaceous shale (Fig.5h and i).
4.3.Total organic carbon
According to the analyzed data from the 57 collected samples,the TOC values varied from 0.36%to 6.38%with an average of 2.47%,and most TOC values ranged from 1% to 4% (Fig.6a).In the three studied sections,the black shale TOC decreased gradually from bottom to top.In addition,different lithofacies showed significant variations in TOC values (Fig.6b).The TOC of mixed argillaceous shale ranged from 0.36% to 3.32% (averaging 1.09%),TOC of mixed siliceous shale ranged from 0.98%to 5.53%with an average of 2.74%,and siliceous shale had a relatively higher TOC content ranging from 1.28% to 6.38% with an average of 3.16%.In general,the TOC value showed an apparent increase from clay-rich shale to silicarich shale;however,some shale samples with the highest silica content had low TOC values (Fig.6b).
4.4.Major elements
Major element analysis indicated that SiO2and Al2O3are the primary constituents in the O3w-S1lblack shale.SiO2ranged from 28.27%to 88.69%and averaged 65.91%(Table 2),showing a gradual upward decrease.Shale samples with high SiO2content were primarily distributed in the Katian and Rhuddanian sections.As an effective proxy for estimating terrigenous input,Al2O3concentrations varied from 2.16%to 18.4%with an average of 12.6%,showing an increasing upward trend (Table 2).Fe2O3,FeO,MgO,and K2O were the second most abundant oxides with average contents of 2.51%,2.46%,1.97%,and 3.16%,respectively.CaO contents in most samples were <1%,as were Na2O and P2O5.
According to the formula for excess silica (Siexcess) content,the calculated Siexcessin samples ranged from 0% to 33.35% with an average of 9.89% and showed an abrupt upward decrease in the three study profiles.The CIA values,which are commonly used to analyze paleoclimate changes and weathering intensity,showed an increase upward and ranged from 66.57 to 77.53 with an average of 73.43 (Table 2).
4.5.Trace and rare elements
Geochemical proxies,including sensitive trace element concentrations and their ratios,are widely used for paleo-marine condition reconstruction (Jones and Manning,1994;Algeo and Maynard,2004;Tribovillard et al.,2006).In this research,we chose U/Th and V/Cr to identify paleo-marine redox environment,and the geochemical proxies Ni/Al and P/Al ratios were used as paleoproductivity indicators (Table 2).

Table 1 Mineral composition of the O3w-S1l black shale from the Yy2 and Yy3 wells,as well as the Hengshi Section.
U/Th and V/Cr are redox-sensitive indicators (Lewan and Maynard,1982;Jones and Manning,1994;Ross and Bustin,2009).For anoxic conditions,the U/Th and V/Cr ratios are usually >1.25 and 4.25.For dysoxic environments,the U/Th ratios range from 0.75 to 1.25 and V/Cr ratios generally range from 2.0 to 4.25.U/Th ratios<0.75 and V/Cr ratios <2.0 indicate oxic conditions (Wignall and Myers,1988;Jones and Manning,1994).U/Th and V/Cr ratios of the samples from O3w-S1lblack shale had similar variation trends,ranging from 0.21 to 3.14 (average of 0.99) and 1.07 to 14.18(average of 3.44),respectively.Ni/Al ranged from 1.7 × 10⁻⁴to 62.64 × 10⁻⁴showing an upward decrease and P/Al ranged from 23.09 × 10⁻⁴to 177.96 × 10⁻⁴,which are considered as effective parameters for evaluating marine paleoproductivity (Lewan and Maynard,1982;Poter et al.,2014;Khan et al.,2019).
The total rare earth element(ΣREE)content varied from 138.68 to 221.78 with an average of 189.63(Table 3).The ratio of light rare earth element to heavy earth elements (LREE/HREE) ranged from 6.72 to 10.64 (average of 8.56).Eu/Eu*values exhibited significant negative anomalies and had an average value of 0.66 and the mean value of Ce/Ce* is 0.96 with a range of 0.91-0.96.

Fig.3.Micrographs of minerals from the O3w-S1l black shale.(a)Terrigenous detrital quartz along lamina in S1l black shale,Well Yy2;(b)Scattered detrital quartz in S1l black shale,Well Yy2;(c) Massive siliceous radiolarians in O3w black shale,Well Yy2;(d) Siliceous radiolarians and syn-sedimentary laminae in S1l black shale,Hengshi section;(e) Siliceous radiolarian and its Si element content reaches 69%in S1l black shale,Well Yy2;(f)Plagioclase,illite and mixed layer illite/smectite in S1l black shale,Well Yy2;(g)K-feldspar in S1l black shale,Well Yy2;(h) Ferrodolomite in S1l black shale,Well Yy2;and (i) Pyrite framboid in O3w black shale,Well Yy2.Arrows in each photo refer to corresponding minerals.
5.Discussion
5.1.Origin of silica
Biogenic,terrigenous detrital,and hydrothermal are the three primary sources for silica in marine deposits.Marine shale containing silica from different origins commonly has distinctive petrological,geochemical,and paleo-biological characteristics that can be used to identify silica sources (Adachi et al.,1986;Murray et al.,1994;Chen et al.,2006;Zhou et al.,2006;Harris et al.,2011;Qiu et al.,2018;Khan et al.,2019;Liu et al.,2019).Terrigenous silica,primarily from silicate and aluminosilicate minerals,has a close relationship with terrigenous input(Liu et al.,2017;Li et al.,2019).Detrital quartz is resistant to weathering and can be deposited after long-distance transport,and it is one of the primary forms of terrigenous silica in marine shale(Wright,2001;Schieber,2016;Zhao et al.,2016;Dong et al.,2019).Abundant terrigenous detrital quartz and feldspar are observed in the O3w-S1lblack shale,and the detrital quartz usually has an angular shape with a diameter of 10-25 μm(Fig.3a and b and 5i).Meanwhile,sandy layers are widely distributed in the S1lblack shale(Figs.3a and 4),indicating that the terrigenous detrital source is an important origin of silica in the study area,which is consistent with widely developed sandy gravity flows in the upper Rhuddanian (Wang et al.,2015).
TiO2and Al2O3are useful proxies for terrigenous input and the variations in their content can reflect the intensity of terrigenous silica influence on marine deposits(Milliken et al.,2016;Liu et al.,2017;Li et al.,2019).TiO2and Al2O3concentrations show a longterm increasing upward trend in three studied sections,indicating the gradually increasing influence of terrigenous input(Fig.7).However,the average TiO2and Al2O3contents in the black shale are only 0.65% and 13.11%,which are less than that of PAAS(0.99%for TiO2and 15.9%for Al2O3)(Taylor and Mcclennans,1985),showing a relatively minor influence of terrigenous input on black shale except shale during the Aeronian(Fig.7).Significant negative correlations between SiO2versus TiO2and SiO2versus Al2O3indicate that there are additional silica sources in the O3w-S1lblack shale besides normal terrigenous silica deposits (Siexcessin section 2).Meanwhile,the Katian-Rhuddanian black shale with less TiO2and Al2O3usually has higher SiO2content,indicating that the additional silica source makes an important contribution to the total silica (Fig.7).
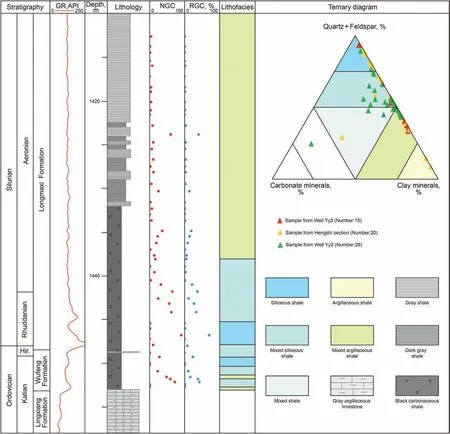
Fig.4.Shale lithofacies of the O3w-S1l black shale and its vertical variations in Well Yy3.The ternary diagram is modified from Wang et al.(2019).Changes in graptolite abundance are marked as NGC and RGC.Hir=Hirnantian,NGC=number of graptolites on the core bedding surface,and RGC=ratio between total graptolite surface area and core bedding surface area.
The ratios of Si/(Si+Al+Fe)and Al/(Al+Fe+Mn),and the Eu anomalies are effective parameters for identifying the origin of Siexcessin marine shale (Adachi et al.,1986;Yamamoto,1987;Murray,1994;Qiu et al.2011,2018;Zhang et al.,2018;Jiang et al.,2019;Khan et al.,2019;Li et al.,2019).Previous studies have shown that Si/(Si+AL+Fe) for biogenic silicalite is commonly higher than 0.90,Al/(Al+Fe+Mn) is higher than 0.6,and Eu anomalies are negative (Adachi et al.,1986;Yamamoto,1987;Qiu et al.,2018;Khan et al.,2019;Li et al.,2019).For hydrothermal silicalite,Al/(Al+Fe+Mn) is less than 0.3,Eu anomalies are positive,and shale with a lower Al/(Al+Fe+Mn)ratio and higher Eu/Eu* ratio generally reflect stronger hydrothermal activity(Adachi et al.,1986;Murray,1994;Qiu et al.,2011;Zhang et al.,2018).In the study area,samples from the O3w-S1lblack rock series have Si/(Si+Al+Fe)and Al/(Al+Fe+Mn)values ranging from 0.65 to 3.52 (averaging 1.17) and 0.39 to 0.85 (averaging 0.66)(Table 2),respectively,and the average Eu/Eu* value is 0.66(Table 3).These results are most like the parameters for biogenic silicalite,indicating that Siexcessmay be biogenic.Moreover,according to the Al-Fe-Mn ternary chart,the majority of samples plot in the bio-origin zone (Adachi et al.,1986) (Fig.8).Therefore,we infer that the excess silica in the O3w-S1lblack shale is biogenic rather than hydrothermal in origin.This inference coincides with the semi-restricted continental shelf environment of the O3w-S1l,where the average Ce/Ce*of samples is 0.96(Table 3),greater than that of sediments at mid-oceanic ridges(averaging 0.3)and oceanic basins (with an average of 0.6) (Murrayet al.,1991;Murray,1994).

Table 3 REE concentrations (ppm) and selected parameters of the O3w-S1l black shale from Well Yy2.
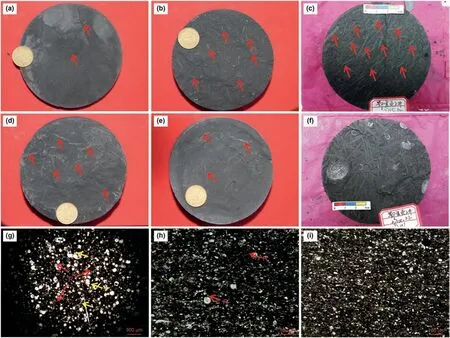
Fig.5.Fossils in the O3w-S1l black shale.Arrows point to graptolites in (a) Siliceous shale;(b-d) Mixed siliceous shale;(e) Mixed argillaceous shale;(f) Hirnantia fauna and abundant graptolites in mixed siliceous shale;(g)Massive radiolarians and some sponge spicules in siliceous shale;(h)Several radiolarians in mixed siliceous shale;and(i)Mixed argillaceous shale without siliceous fossils.S=sponge spicule;R=radiolarian.
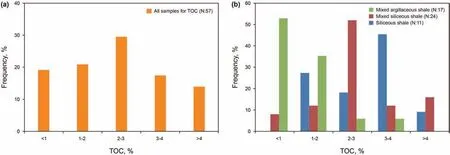
Fig.6.(a) TOC histogram for the O3w-S1l black shale.(b) TOC histogram for different black shale lithofacies in the O3w-S1l black shale.
Furthermore,the paleoproductivity and petrology also provide strong evidence for excess silica that are biogenic.High Siexcesscontent is primarily present in siliceous shale and mixed siliceous shale,while mixed argillaceous shale and argillaceous shale have little Siexcesscontent,and these features coincide with the numbers of observed siliceous organisms in different lithofacies (Fig.3).In the O3w-S1lsiliceous shale,siliceous radiolarians are widely distributed (Figs.3c and 5g),and few radiolarians are found in mixed argillaceous shale (Figs.3a and 5i).Moreover,the Siexcessvalue shows good linear correlations with paleoproductivity proxies (Ni/Al and P/Al) except for some samples with higher Siexcesscontent (Fig.9),indicating the O3w-S1lblack shale Siexcessorigin is biogenic(Bio-Si).Therefore,it can be concluded that Bio-Si and terrigenous siliciclastic input are the main O3w-S1lblack shale silica sources.
5.2.Relationships between origins of silica and organic matter accumulation
Terrigenous detrital input has an important influence on marine organic matter accumulation(Murphy et al.,2000;Sageman et al.,2003;Li et al.,2017;Khan et al.,2019).Generally,high terrigenous influx will promote organic matter burial and diminish its exposure time while substantially diluting its abundance,resulting in lower TOC values in marine shales with abundant terrigenous materials(Ibach,1980;Rimmer,2004;Lu et al.,2019;Wang et al.,2019).Hence,terrigenous detritus input is generally considered a negative factor for organic matter accumulation.
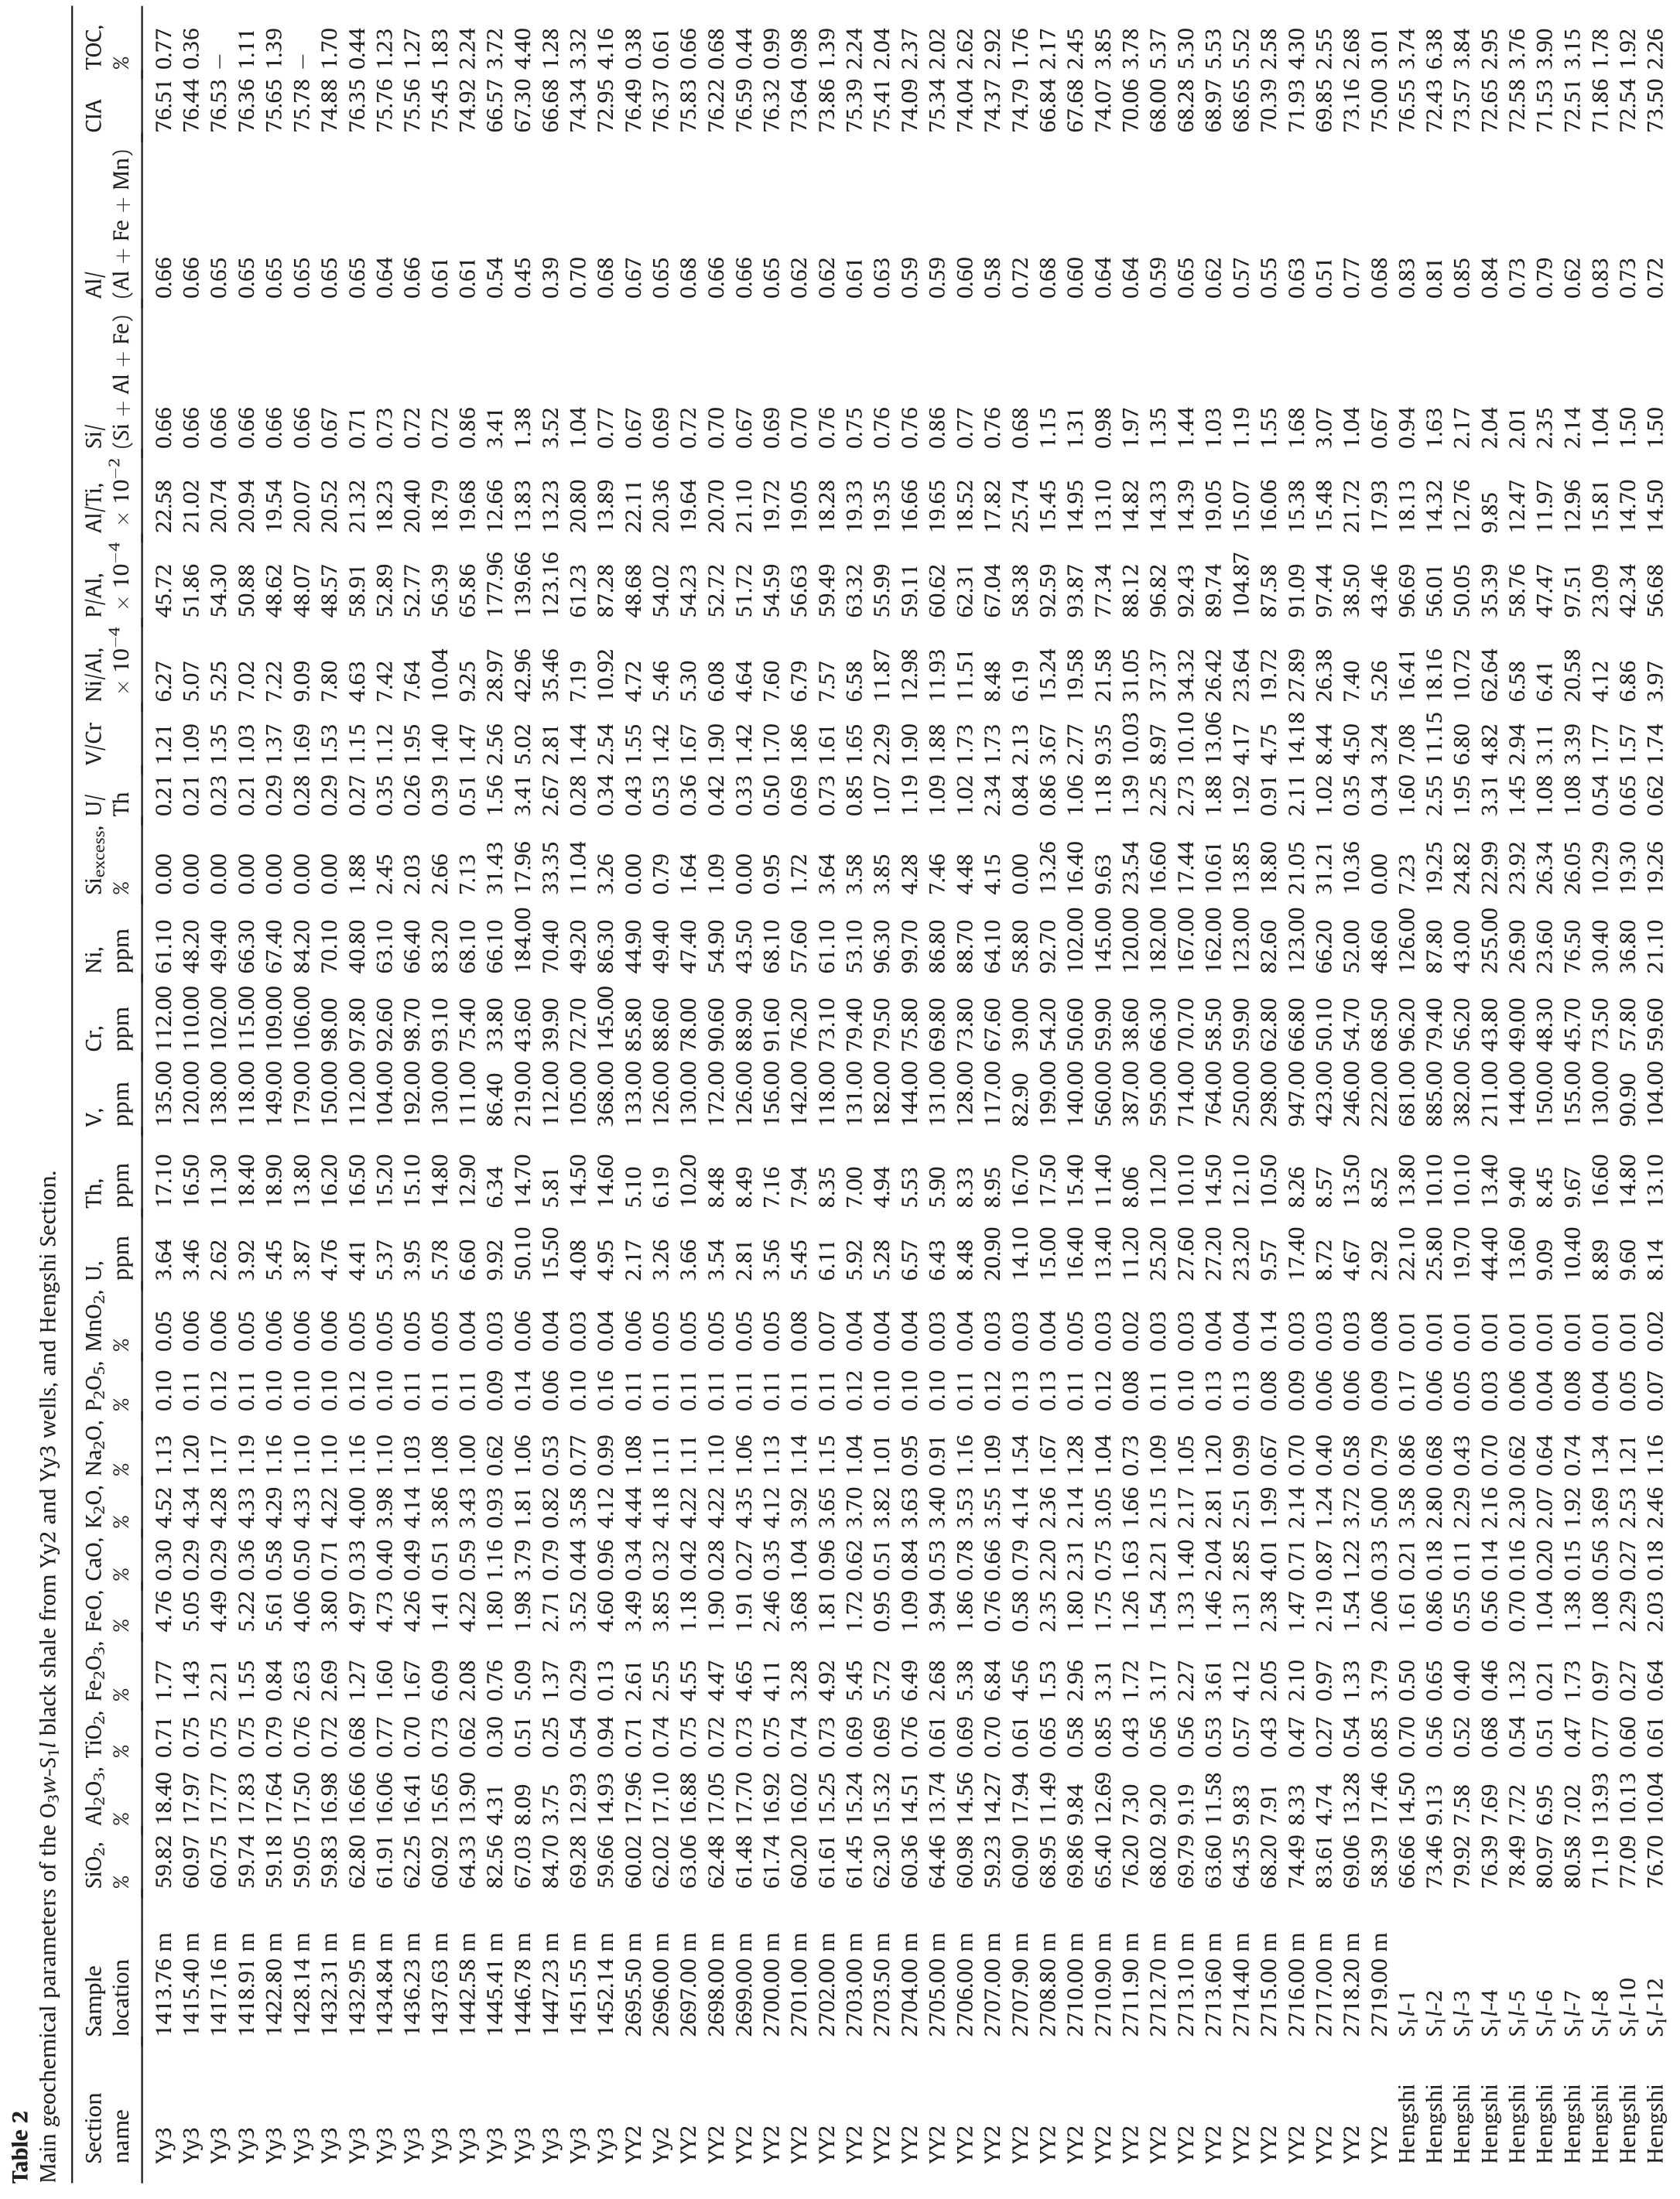

In marine black shale,Al2O3is a direct proxy for terrigenous siliciclastic input,and the CIA can also help in analyzing the provenance weathering intensity of marine siliciclastic sediments(Milliken et al.,2016;Liu et al.,2017;Li et al.,2019;Wang et al.,2019).Despite the long-term increasing upward trend of CIA and Al2O3in the O3w-S1lshale within the study area,indicating gradually increasing terrigenous detritus input and weathering intensity,the CIA value and Al2O3content of samples show complex correlations with TOC(Fig.10).CIA values >73 have strong negative correlations with TOC,showing that weak weathering conditions may favor organic matter enrichment,but the negative correlations abruptly deteriorate when the CIA value is <73,indicating that weak weathering conditions may not always be beneficial for organic matter accumulation(Fig.10a).The Al2O3and TOC contents exhibit a similar relationship(Fig.10);Al2O3content in black shale>12% has a strong negative correlation with TOC,indicating less terrigenous siliciclastic input will benefit the organic matter accumulation.However,it should be noted that the correlation is poor when the Al2O3content is <12%,and Al2O3content <8% shows a positive correlation with TOC,indicating that too little or too much terrigenous siliciclastic input are not favorable for the organic matter enrichment either.Sufficient terrigenous detrital supply will benefit organic matter preservation by diminishing exposure time,but it will substantially dilute organic matter abundance (Murphy et al.,2000;Sageman et al.,2003;Rimmer,2004;Khan et al.,2019;Li et al.,2019;Lu et al.,2019).Too little terrigenous input will lead to the decrease in aluminosilicates,which function as effective organic matter absorbents(Rimmer,2004),and the lack of aluminosilicates will slow organic matter burial rate and lead to widespread oxidation of organic matter in the water column(Ibach,1980;Wang et al.,2019),resulting in low TOC in the black shale.Consequently,we infer that a certain amount of terrigenous siliciclastic input and appropriate weathering conditions should be most favorable for the organic matter accumulation in marine black shale.In other words,too much or too little terrigenous silica input will negatively influence marine organic matter enrichment.
In previous researches,Bio-Si content was regarded as an important paleoproductivity proxy,and linear relationships were usually utilized to describe the correlations between TOC and Bio-Si (Dong et al.,2019;Li et al.,2019;Lu et al.,2019;Khan et al.,2019).However,Bio-Si content (equal to Siexcess) and TOC of samples from the O3w-S1lblack shale in the study area exhibit complex relationships (Fig.11a and b).Black shale samples with 10%-20% Bio-Si contents usually have the maximum TOC.Furthermore,the Bio-Si contents show strong positive linear correlations with TOC when Bio-Si content remains below a certain threshold value (10%),and negative correlations to some extent when Bio-Si content exceeds 20% (Fig.11a).These correlation characteristics are also consistent with published data(Dong et al.,2019;Khan et al.,2019;Liu et al.,2019).For example,although Khan et al.(2019) used a positive linear correlation to describe the relationship between TOC and Bio-SiO2,it can be found that the relationship between TOC and Bio-SiO2is not linear;TOC in black shale gradually decreases with the increase in Bio-SiO2content when the Bio-SiO2content in black shale is greater than approximately 40% (equivalent to 18.6% of Bio-Si content) (Fig.11b).The relationship between Bio-Si and TOC is also consistent with the variations in graptolite abundance in different lithofacies.Graptolites,as a kind of organic matter (Luo et al.,2016),are rare in siliceous shale and argillaceous shale(Fig.5a,e),but are easily found in mixed siliceous shale (Fig.5c).

Fig.7.Cross-plots of SiO2 versus TiO2 and Al2O3 of shale samples from the O3w-S1l black shale showing strong negative correlations.

Fig.8.Al-Fe-Mn ternary plot showing the siliceous origin of shale samples from the O3w-S1l black shale (Base map is modified from Adachi et al.,1986).
Therefore,it can be found that the O3W-S1l black shale with a specific content of Bio-Si or terrigenous siliciclastic input will have higher TOC values (Figs.10 and 11),not the black shale with the highest Bio-Si content or the least terrigenous silica input.The relationship between graptolite abundance and silica from different origins can also illustrate the nonlinear correlations described above,in which shale with higher or lower Bio-Si content and terrigenous siliciclastic input reflected by Al2O3usually have low graptolite abundance (Figs.4,5 and 12).Hence,a black shale with too much or too little Bio-Si content or terrigenous silica input indicates that there may be a decrease in TOC and graptolite abundance.These features also demonstrate that siliceous organisms with some hydrocarbon generation materials are not the primary organic source in the O3w-S1lblack shale and using Bio-Si content to evaluate the organic matter enrichment of siliceous shale should,therefore,be evaluated carefully.
5.3.Sedimentary model for siliceous materials and organic matter
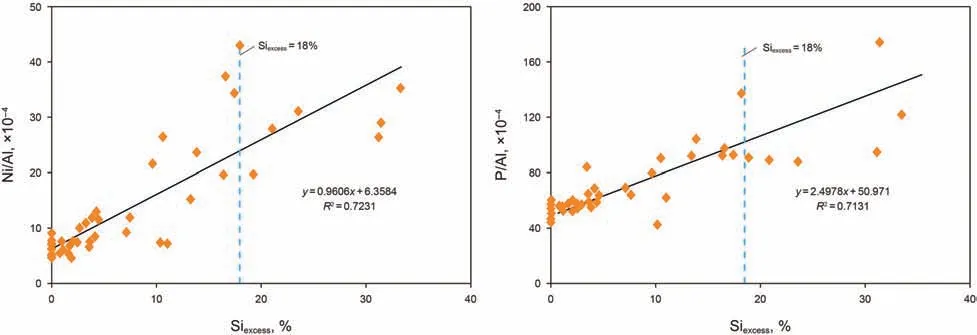
Fig.9.Cross plots of Ni/Al and P/Al versus Siexcess for shale samples from the O3w-S1l black shale in wells Yy3 and Yy2.

Fig.10.Cross-plots of TOC versus CIA and Al2O3 of the O3w-S1l shale samples showing a complex correlation between terrigenous siliciclastic input and organic matter enrichment.
Based on the above geochemical and petrological analysis,terrigenous siliciclastic input and Bio-Si constitute the main sources of silica in the O3w-S1lblack shale (Fig.13).In the Well Yy2 profile,the normal terrigenous siliciclastic deposits represented by Al2O3show a long-term increasing trend,whereas the Bio-Si content decreases upward.Meanwhile,the geochemical proxies such as U/Th and V/Cr exhibit a long-term decreasing trend and CIA values show gradual increase,indicating a gradually oxidizing environment with sea-level fall and an intensifying weathering condition during the depositional stage of the O3w-S1lblack shale(Fig.13).Shale samples with high Bio-Si and TOC contents only occur in the O3W and the lower S1l,in which the U/Th and V/Cr ratios are higher than 0.75 and 2,respectively (Fig.13).These variations in geochemical proxies indicate that Bio-Si prefers reducing environments and terrigenous silica prefers oxidizing environments,and a strong reducing environment with relatively high sea level and productivity may be beneficial for organic matter accumulation(Liu et al.2016,2019;Dong et al.,2018;Zhang et al.2018,2019;Lu et al.,2019;Yan et al.,2019).
However,the cross-plots of TOC versus V/Cr and U/Th in the O3w-S1lblack shale exhibit nonlinear correlations rather than a simple linear relationship when the V/Cr and U/Th ratios are >5.0 and 2.0,respectively (Fig.14).Meanwhile,graptolites are rare in siliceous shale formed in a strongly reducing environment and argillaceous shale formed in an oxidizing environment (Fig.5a,e),but are very common in mixed siliceous shale formed in a relatively reducing environment (Fig.5c).These characteristics indicate that an appropriate redox condition should be more favorable for organic matter accumulation,rather than the strongest reducing environment.
Organic matter enrichment is primarily controlled by the supply and preservation of organisms.The supply of organisms is closely related to paleoproductivity,and organic matter preservation primarily depends on redox conditions,burial rate,and hydrodynamic conditions(Murphy et al.,2000;Sageman et al.,2003;Li et al.2017,2019;Lu et al.,2019;Khan et al.,2019;Yang et al.,2019).According to the above nonlinear relationships of TOC versus silica origin and redox parameters,the O3w-S1lshale is taken as an example to establish a sedimentary model for organic matter and silica origin distribution within a continental shelf with little hydrothermal influence.

Fig.11.Complex correlation between TOC versus Bio-Si and Bio-SiO2 content.(a)Cross plot of Bio-Si content versus TOC for the O3w-S1l black shale samples in the study area.(b)Cross plot of Bio-SiO2 content versus TOC for the O3w-S1l black shale samples in Sichuan Basin,and data are taken from Khan et al.(2019).

Fig.12.Bio-Si and Al2O3 content versus graptolite abundance for the O3w-S1l shale samples in Well Yy3,showing variations in graptolite abundance in shale samples with different biogenic or terrigenous siliceous contents.NGC=number of graptolites on the core bedding surface.RGC=ratio between total graptolite surface area and core bedding surface area.
During the Ordovician-Silurian transition,the Yangtze area was a semi-restricted shelf covered by a broad epeiric sea (Chen et al.,2004;Su et al.,2009;Gorjan et al.,2012;Liu et al.,2017).With the early sea-level rise,an upwelling current provided plentiful nutrients to the semi-enclosed shelf basin,leading to an increase in marine primary productivity and in Bio-Si content characterized by abundant siliceous radiolarians (Figs.13 and 15).Many planktonic organisms,including graptolites,are well-preserved in deep-water sediments (Figs.4 and 5),resulting from gradually strengthening anoxic conditions and a weakening hydrodynamic environment(Figs.4 and 13).However,seawater nutrients cannot increase continuously and even decrease when the rising sea level exceeds a certain limit,just like the lack of nutrients in the modern ocean(Platt and Sathyendranath,1988;Li et al.,2003).Siliceous radiolarians are more common with continuously rising sea level(Khan et al.,2019),while enhanced open seawater environments lead to the migration of organic matter within a greater paleogeographic space.Insufficient terrigenous detrital input accompanied with sea-level rise slows the burial rate of organisms due to the lack of aluminosilicates,and abundant organisms are easily oxidized while slowly settling through the water column (Ibach,1980;Rimmer,2004;Lu et al.,2019;Wang et al.,2019).Meanwhile,large planktonic graptolites cannot be transported to a deep-water area over long distances,except for some small fragments.These concepts can illustrate why the TOC value decreases in siliceous shale with higher Bio-Si content and fewer terrigenous siliciclastic deposits formed in an enhanced reductive environment (Figs.10 and 11),and why mixed siliceous shale with Bio-Si content ranging from 10%to 20%commonly contains abundantorganic matter and graptolitefossils(Figs.11 and 12a,b).However,the TOC of siliceous shale formed in a deep-water environment is commonly greater than that of mixed argillaceous shale because of good organic matter preservation after burial,despite the slightly decreased TOC in siliceous shale caused by a continuous sea-level rise(Figs.11,14 and 15).
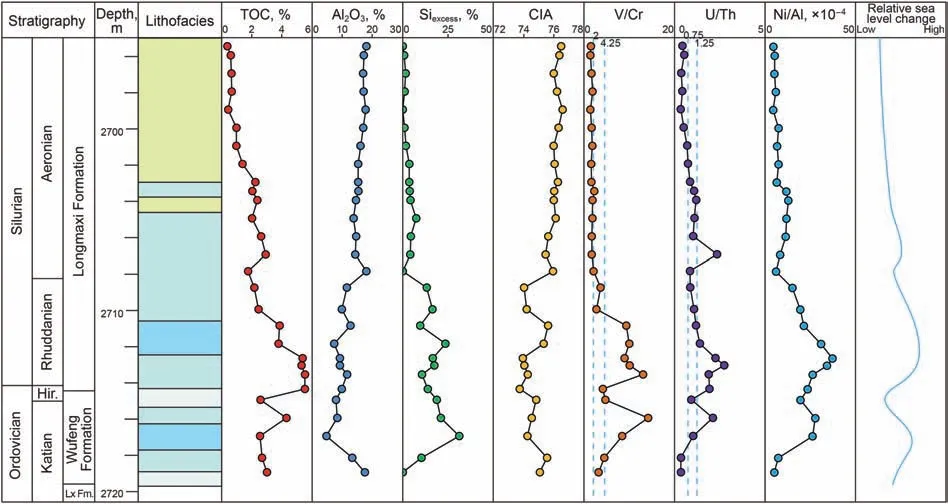
Fig.13.Vertical variations in different geochemical proxies from O3w-S1l shale samples in formations in Well Yy2(Lx Fm=Lingxiang Formation,and Hir=Hirnantian).V/Cr ratios of 2 and 4.25 and U/Th ratios of 0.75 and 1.25 are used to identify redox conditions and are marked by blue vertical dash lines.
On the contrary,the increased restriction of sedimentary water caused by sea-level drop will restrict nutrient materials migrated from the ocean to the shelf,leading to a decrease in paleoproductivity (Wang et al.2015,2019;Dong et al.,2018;Lu et al.,2019).In the semi-enclosed paleoenvironment,although decreasing paleoproductivity may reduce the organisms supply,organic matter will not disperse widely and can be easily concentrated.Furthermore,a slight increase in terrigenous siliciclastic input will benefit organic matter preservation by decreasing the exposure time for oxidation (Rimmer,2004;Lu et al.,2019).However,once sea-level fall exceeds a certain elevation,terrigenous detrital influx will dilute the organic matter content markedly (Lu et al.,2019),and stronger hydrodynamic conditions and exhaustive bottom water oxidation are not favorable for organism deposition and preservation (Fig.13).Therefore,some organisms are buried but are still oxidized,and siliceous radiolarians are also not common in mixed shale or mixed argillaceous shale(Fig.5h and i).For example,the Longmaxi Formation Aeronian shale formed in shallow water generally has a low graptolite abundance and low TOC (Figs.10 and 12c,d).
For organic matter enrichment in a continental shelf with little influence from hydrothermal activity,we emphasize the controls of organic matter supply and preservation caused by sea-level change and terrigenous input on organic matter accumulation(Ibach,1980;Gambacorta et al.,2016;Lu et al.,2019).The environment with appropriate sea level and terrigenous input should be most favorable for organic matter enrichment (Fig.14).In this contribution,the sedimentary environment in the study area corresponding to shale sediments with approximately 8%-10%Al2O3content and 10%-20%Bio-Si content are favorable for organic matter sedimentation and preservation during the Ordovician-Silurian transition(Figs.10-12).However,the threshold values of Al2O3and Bio-Si content best for organic matter enrichment may change in environments with different paleogeomorphology and provenance systems.

Fig.14.Cross-plots of TOC versus V/Cr and U/Th for the O3w-S1l shale samples showing TOC variations in different redox conditions.Generally,V/Cr ratios <2 or U/Th ratios <0.75 indicate an oxic environment,the U/Th ranges from 0.75 to 1.25 or V/Cr ranges from 2.0 to 4.25 indicates dysoxic environment,and U/Th ratios >1.25 or V/Cr ratios >4.25 indicate anoxic environment.

Fig.15.Sedimentary models for different siliceous materials and organic matter in a semi-enclosed shelf basin with little hydrothermal influence.
6.Conclusions
Bio-Si and terrigenous siliciclastic input are the primary silica sources for the O3w-S1lblack shale in western Hubei Province,and they exhibit nonlinear correlations with TOC and graptolite abundance,rather than simple linear correlations.Black shale with approximately 8%-10%Al2O3or 10%-20%Bio-Si usually has higher TOC content.Furthermore,TOC exhibits a complex relationship with redox parameters.The nonlinear relationships indicate that organic matter enrichment and distribution of silica with different origins are mainly controlled by sea-level changes and variations in terrigenous input,and using Bio-Si content to evaluate the organic matter enrichment of siliceous shale should be evaluated carefully.Excessive high sea level accompanied with little terrigenous siliciclastic input will decrease the organism supply and slow their burial rate but promote biogenic silica enrichment,while excessive low sea level accompanied with sufficient terrigenous supply will promote organic matter burial but substantially dilute its concentration and lead to an oxidizing environment with abundant terrigenous silica.Therefore,an environment with appropriate sea level and terrigenous input should be most favorable for organic matter accumulation in a continental shelf with little influence of hydrothermal activity,rather than an environment with excessively high sea level,strong reducing conditions,and little terrigenous supply.
Acknowledgements
This study was financially supported by the Key Laboratory of Tectonics and Petroleum Resources of Ministry of Education(China University of Geosciences) (Grant no.TPR-2021-13),the Science and technology research project of Hubei Provincial Department of Education (Grant no.Q20211304) and the National Science and Technology Major Project of China (Grant no.2016ZX05034001-002;2017ZX05035001-002).We would like to thank Yangui Li and Jingjing Tang for their help collecting samples.In addition,we appreciate editors and reviewers for the critical and helpful comments and suggestions.
杂志排行
Petroleum Science的其它文章
- Reduction of global natural gas hydrate (NGH) resource estimation and implications for the NGH development in the South China Sea
- Evaluation of natural gas hydrate resources in the South China Sea by combining volumetric and trend-analysis methods
- The influence of water level changes on sand bodies at riverdominated delta fronts:The Gubei Sag,Bohai Bay Basin
- Influence of structural damage on evaluation of microscopic pore structure in marine continental transitional shale of the Southern North China Basin:A method based on the low-temperature N2 adsorption experiment
- Application of multi-attribute matching technology based on geological models for sedimentary facies:A case study of the 3rd member in the Lower Jurassic Badaowan Formation,Hongshanzui area,Junggar Basin,China
- Research progress on seismic imaging technology
