Illustrating the Helmholtz-Kohlrausch effect of quantum dots enhanced LCD through a comparative study
2022-03-08JIHongleiCHENGShangjunLIPengfeiZHANGYanGEZiyiZHONGHaizheng
JI Hong-lei,CHENG Shang-jun,LI Peng-fei ,ZHANG Yan,GE Zi-yi,ZHONG Hai-zheng
(1. Ningbo Institute of Materials Technology and Engineering, Chinese Academy of Sciences, Ningbo 315201;2. University of Chinese Academy of Sciences, Beijing 100049;3. School of Materials Science & Engineering, Beijing Institute of Technology, Beijing 100081;4. R & D Center, TCL Electronics Co., Ltd., Shenzhen 518000, China;5. Ningbo Excite Technology Co., Ltd., Ningbo 315000, China)
Abstract: Helmholtz-Kohlrausch effect (H-K effect) describes the influence of color purity on the perceived brightness of a colored object. Quantum dots (QD) based backlights can enhance the color quality of Liquid Crystal Display (LCD) with improved perceived brightness due to the well-known H-K effect. However, the H-K effect of QD embedded TVs (also known as QLED TV) has not been fully demonstrated. In this paper,we investigated the H-K effect of QLED TVs through a comparative study between QLED backlights and YAG-LED backlights. By comparing the viewers’ experimental results with the Kaiser and Nayatani model,we demonstrate that a QLED TV shows significant H-K effect. To achieve the same perceived brightness with YAG-LED TV, the physical brightness of QLED TV was greatly decreased to 75% for pure red, 86%for pure green, and 74%-88% for bright colorful images. Moreover, QLED TVs are strongly preferred over YAG-LED TVs even when both QLED TV and YAG-LED TV show the same perceived brightness. The results imply the bright future of QLED TVs toward healthly displays.
Key words: QLED TV; Helmholtz-Kohlrausch effect; perceived brightness; display; colority
1 Introduction
The display is an important technology for information communication. Display technology has developed well in the past 20 years. As a key parameter for describing the performance of display screens, color gamut represents the largest range of colors that a screen can display, which was defined by the International Commission on Illumination(CIE) in 1931. The colored triangle in the color space is the gamut limit of a screen[1]. The National Television System Committee (NTSC) is one of the standard color gamuts, which indicates the subset of all colors that should be generated[2]. The color gamut of conventional Liquid Crystal Display(LCD) with LED backlight is usually less than 70%NTSC because of the broad emission of Yttrium Aluminum Garnet (YAG) phosphor[3-4]. Quantum Dots (QDs) are nanoscale semiconductor crystals with narrow-band emission, tunable color and high quantum yields, which can improve the color quality of LCD displays[5-7]. The color gamut of QD embedded TVs (also known as QLED TVs) can reach up to 120% NTSC[8-13]. In 2013, Sony[14]and QD Vision first showed QLED TVs at the Consumer Electronics Show (CES). Later on, many companies launched their own QLED TV products[15-17], including TCL, Samsung, Hisense, etc. In 2020, more than 10 million QLED TVs were sold. In comparison with the rapid commercialization of QLED TV products, the investigation of their color performance lagged off.
The Helmholtz-Kollosch effect (H-K effect)refers to the phenomenon that the perceived brightness of color increases with the increase of color purity[18-20]. Tsujimura et al. showed that the H-K effect is involved in OLEDs[21]and a similar phenomenon has been reported in LED projectors[22-23].Although it is expected that QLED TVs have a more significant H-K effect[24-25], the H-K effect of QLED TV has not been comprehensively studied. In this paper, we investigated the H-K effect of QLED TV through a comparative study between QLED backlights and YAG-LED backlights. By comparing the results of an observational study with the Kaiser and Nayatani model, we illustrated the influence of color gamut on the perceived brightness of QLED TVs.
2 Models for calculating the H-K effect
According to the literature, perceived brightness (the sensation) does not always vary linearly with luminance[26]. Luminance is a measurable physical concept, while the perceived brightness is affected not only by the light source itself, but also by the viewing environment and the psychological factors of the viewer. Helmholtz defines color purity (%P) which can be expressed in the following equation:

whereNis the location of the white reference point,Sis the color point being evaluated, andDWis the dominant wavelength. For different colors with the same dominant wavelength, the brightness/luminance ratio (B/L ratio) increases with an increase in color purity%P[18]. The H-K effect reveals the relationship between brightness and chroma, and was theoretically described by Dowling and Nayatani et al..
2.1 Kaiser model
In 1986, Kaiser summarized the experimental results[27-29]and proposed the Kaiser model[30]. In the Kaiser model, two terms have influence on brightness: a color component (F) and the luminance component log (Y). The equations are as follows:

whereL**is the perceived brightness,x,yare the CIE 1931 color coordinates. When the perceived brightness of the two screens is the same, theRBratio of the physical brightnesses can be expressed as equations (4)~(5):

whereY2/Y1is the measured value,is the theoretically calculated value.RBrepresents the luminance ratio of the two screens when their perceived brightness are the same.F1andF2can be calculated by the color coordinates.Y1andY2represent the luminance of the two screens when their brightness is the same.
2.2 Nayatani model
The Kaiser model describes the relationship between perceived brightness and color purity without considering the influence of the environment. Nayatani proposed a mathematical model to calculate the H-K effect in 1991 and further improved it in 1997. Nayatani showed that the model should not only consider the light itself, but also consider the influence of the environment[31-32]. The H-K effect was described by using equation (6):

whereLis the luminance of the test chromatic light,andLeqis the equivalent luminance of the reference white light.

wherev′andu′are the CIE 1976v′andu′chromaticity transformed form chromaticity (x,y) of the test chromatic light, andv′candu′care thev′andu′chromaticity of the reference white light.

whereLais adapting luminance of the environment.KBris a coefficient for specifying the adapting-luminance dependency of the H-K effect.

In equation (10),suvis the metric saturation of test chromatic light withx,y. The Nayatani model considers the luminances of both the light source and the environment. The γVACcan be regarded as the B/L ratio. The viewer’s brightness perception experiment is carried out according to the above two models, and the calculation results were discussed with a comparison of that against the experimental results.
3 Experimental section
In our work, a TCL 55F8 (YAG TV) and a TCL 55C715 (QLED TV) were selected for testing.For simulating normal indoor lighting conditions,we created a lighting environment of around 150 lx in a darkroom. Twelve viewers were invited for the test, of which 8 were men and 4 were women of ages 20−35 years. The visual acuity (or corrected visual acuity) of all volunteers was greater than 1.0,with no color blindness or color weakness. The specific experimental environment referred to GY/T134'The method of the subjective assessment of the quality of digital television picture'[33], as shown in Table 1.

Tab. 1 Key parameters of test environment表1 测试环境参数
3.1 Solid color experiment
Figure 1(a) shows the schematic diagram of the solid color experiment. The QLED TV and YAG TV were placed in the same horizontal plane and the viewing angle is kept the same for both of the TVs.Three colors R, G, B were emitted through the same HDMI source. The luminance of the QLED TV was adjusted by the viewers to match the perceived brightness of the YAG TV. Based on the measured luminance of the QLED TV and the YAG TV, the perceived brightness QD/YAG ratio was calculated.
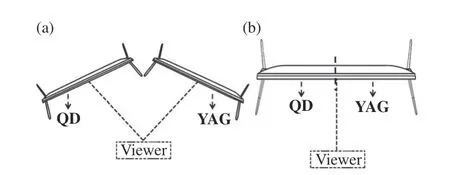
Fig. 1 (a)Schematic diagram for the solid color experiment; (b) schematic diagram for the multicolor experiment图1 (a)纯色实验测试示意图;(b)彩色实验测试示意图
3.2 Multicolor experiments
We selected two groups of pictures for the test.Group I contained colorful pictures with red flowers and green leaves. Group II had plain pictures with a field and a portrait.
To avoid variation in the chip, we used a modified TV to display different color gamuts as shown in Figure 1(b). The edge-lit TV used separated light guide plate and the optics film from the middle to realize different color gamut on the left and right.The luminance on the left and right side can be adjusted by controlling DC sources. For the same viewers, the luminance of the YAG TV was adjusted to get the same perceived brightness on both the QLED TV and YAG TV.
3.3 Subjective preference experiment
Twenty observers were invited for a subjective preference experiment with 10 test pictures that are symmetric or nearly symmetric. The experiment was carried out under 200 nit, 270 nit and 350 nit perceived brightnesses (the measured luminance was different).
4 Results and discussion
4.1 Results and discussion of solid color experiment
Figure 2(a) (color online) shows the emission spectra of the QLED and YAG-LED TVs. The yellow and blue lines represent the white spectrum of the QLED and YAG TVs. The Full Width at Half-Maximum (FWHM) of the QLED TV is about 27 nm for green emission and 26 nm for red emission,which is much narrower than that of the YAG TV.Figure 2(b) (color online) shows the color gamut of QLED TV and YAG TV, indicating that the color gamut of the QLED TV is higher. The white color coordinates of the QLED TV and the YAG TV are consistent.
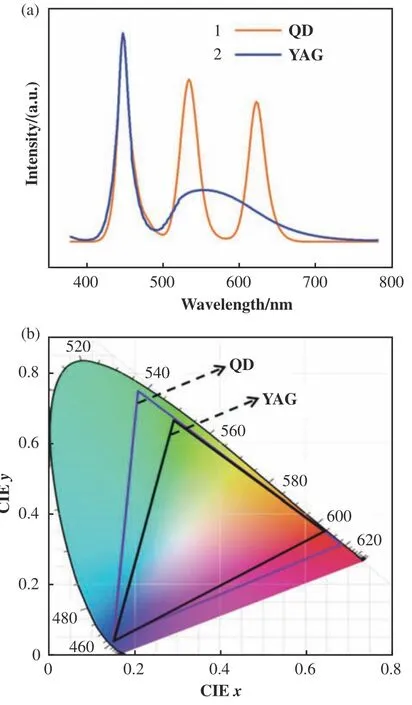
Fig. 2 (a)White light spectrum and (b) color gamut of QLED TV and YAG-LED TV图2 量子点电视与YAG电视的(a)白光光谱及(b)色域图
Figure 3 (color online) shows the measured and calculated brightness ratio (QD/YAG) under different luminances. The dots represent the measured values, the black dotted lines represent the average measured values, the green and blue dotted lines represent the theoretical values calculated according to the Kaiser model and the Nayatani model respectively. The smaller QD/YAG ratio represents the more significant H-K effect. Since the blue light of both the QLED and YAG TVs generated by the GaN chip, the blue light perception only shows a slight difference. In this work, we focus on the H-K effect of red light and green light. It can be seen that the measured average values of red and green are 0.75±0.04 and 0.86±0.04, indicating that the H-K effect of a QLED TV is very significant, in particular for red. By comparing the calculated values based on the Kaiser model and the Nayatani model,the Nayatani model of red is consistent with the measured values, while the Kaiser model in green is consistent with the measured values.The measured values were different from the theoretical values,which may be explained by the differences of individual viewers as well as the test environment. The perceptual differences may be due to the color perception ability differences of different people[34].
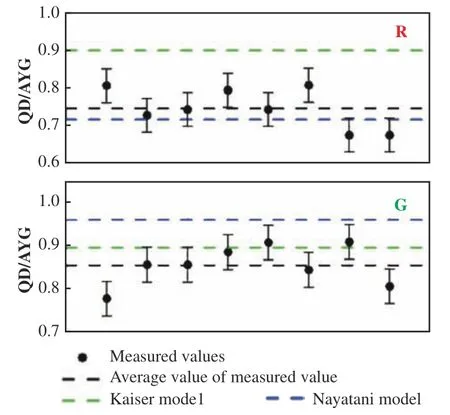
Fig. 3 Comparison of theoretical calculation results and measured values of brightness ratio (QD/YAG) in solid color experiment图3 纯色实验QD/YAG的理论值与实测值对比
4.2 Results and discussion of multicolor experiments
To study the H-K effect of QLED TV, two groups of test pictures were applied for further comparison. Group I consists of colorful pictures with red flowers and green leaves. Group II has plain pictures with fields and portraits.
Figure 4 (color online) shows the QD/YAG of colorful and plain pictures under different luminances. The red and green dashed lines represent the QD/YAG of red flowers and green leaves, the purple and yellow dashed lines represent the QD/YAG of portrait and field. The results show that the H-K effect becomes weaker and flattens in the range of 200 nit to 500 nit for colorful images. The H-K effect of colorful images is more pronounced than that of plain images, and the smallest QD/YAG of red images can reach 0.74. For plain pictures,QLED TV and YAG TV have the same color performance. These results indicate that the display of colorful pictures in a QLED TV creates more acute perception for brightness.

Fig. 4 The curves of QD/YAG of different pictures in multicolor experiment图4 彩色实验不同图片QD/YAG实测值对比曲线
4.3 Subjective preference experiment
We further carried out the subjective preference experiment. Figure 5 (color online) shows the results of viewers' preference ratio for the QLED TV and the YAG TV under the same perceived brightness. The experimental results show that, under the same perceived brightness, the QLED TV is generally preferred. The proportions of subjects who preferred QLED TV at 200 nit, 270 nit and 350 nit are 54.3%, 55.0% and 58.0%, respectively.Even though the perceived brightness of the QLED TV and the YAG TV were kept the same, the viewers still preferred the QLED TV. The QLED TV had a great advantage in red and green pictures. As many as 73.8% of subjects preferred the QLED TV when its luminance was 350 nit, while YAG TV had an advantage in blue and yellow pictures. As luminance increased, the preference for the QLED TV grew. In addition, the preference results were not affected by the genders of the subjects.
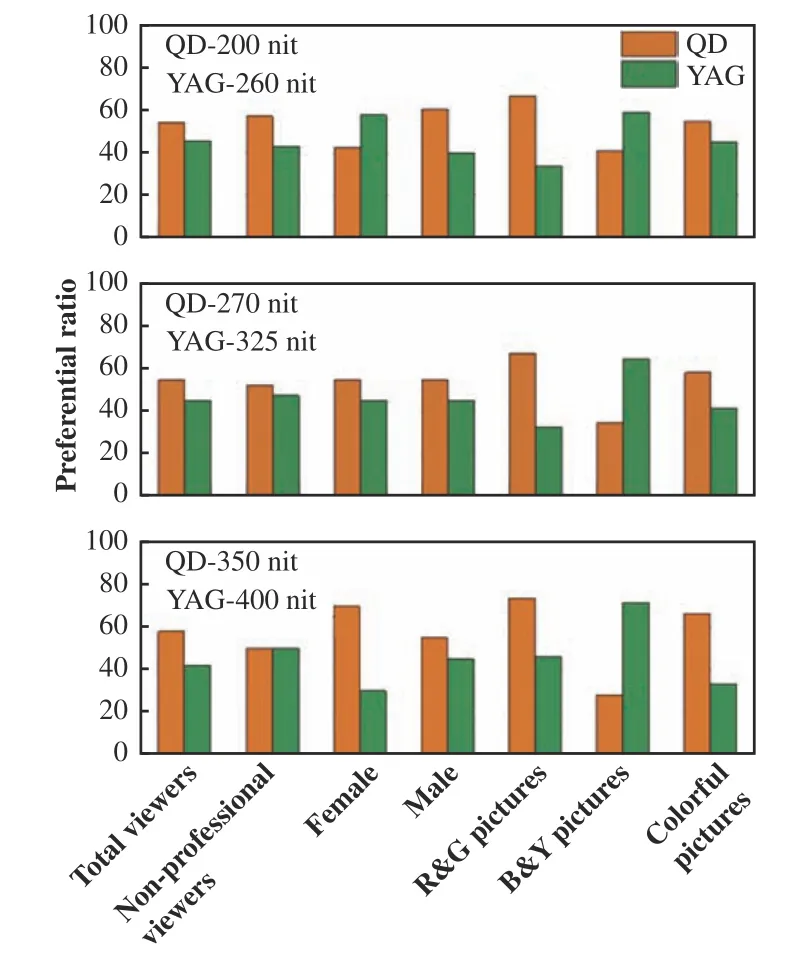
Fig. 5 Preferential ratio under the same perceived brightness图5 相同感知亮度下的主观喜好比例
5 Conclusion
In conclusion, we investigated the H-K effect of a QLED TV through a comparative study between QLED backlights and YAG-LED backlights. The results of the solid color experiment were analyzed by considering the Kaiser model and the Nayatani model. The influence of color gamut on perceived brightness and subjective preference was discussed based on the experimental results of multicolor tests. The results indicated that the QLED TV exhibits significant H-K effect, and the perceived brightness was significantly higher than that for the YAG TV. Under the same perceived brightness, the average measured brightness ratio QD/YAG for red and green were 0.75±0.05 and 0.86±0.04. The minimum brightness ratio QD/YAG of colorful pictures was 0.74. Under the same perceived brightness, the QLED TV with a higher color gamut was more popular, and that preference grows strong as the brightness increases. Under the same perceived brightness, the QLED TV is not only less luminant, but also more popular with viewers. This conclusion is of significant importance for developing healthier LCD screens[35].
In addition, it is worth noting that China's LCD industry has become the world's largest, accounting for 70% of the world's LCD output in 2020.Quantum dots backlight technology is the core technology of the extended LCD industry[36-37]. This study provides a theoretical basis for the popularization of quantum dots technology.
——中文对照版——
1 引 言
显示技术是信息交互的重要媒介,过去的20年中,显示技术层出不穷。色域是影响显示器色彩表现的关键指标,也是消费者选择产品时的首要考虑因素,它代表显示器所能展现的最大色彩范围。1931年,国际照明委员会(International Commission on Illumination,CIE)首次定义了色彩空间,红绿蓝三基色对应色点所围成的三角形代表显示器的色域,其面积越大,即色域越高,可显示 的 色 彩 越 多[1]。NTSC(National Television Standards Committee)是美国国家电视标准委员会制定的高清电视显示标准[2]。传统的液晶显示器(LCD)大多使用基于YAG荧光粉的白光LED作为背光源,白光LED光谱是决定显示色域的主要因素,使用YAG-LED的液晶显示器的色域一般小于70% NTSC[3-4]。量子点是纳米尺寸的半导体晶体,具有发光波长窄、颜色可调、量子产率高等特点[5-7],可显著提升显示的色彩品质,搭载量子点背光的液晶显示器色域高达120%NTSC[8-13]。2013年,SONY[14]和QD Vision公司率先在国际消费电子展(CES)展出了搭载量子点背光技术的液晶电视(量子点电视,QLED),随后,TCL、三星、海信等厂商也纷纷推出了量子点电视[15-17],2020年,量子点电视的销量已经超过千万台。
亥姆霍兹-科尔劳施效应(简称H-K效应)指的是人眼对色光的感知亮度随着色纯度的增加而提升的现象[18-20],是表征显示器件色彩特性的重要特征。柯达OLED研发部的Tsujimura等人报道了有机发光二极管(OLED)中的H-K效应[21],Liao等人报道了LED投影仪中的H-K效应[22-23]。尽管人们很早就预测量子点电视拥有更显著的H-K效应[24-25],然而尚没有针对量子点电视H-K效应研究的报道。本论文通过观看者亮度感知实验,对比了YAG荧光粉白光LED背光电视(YAG电视)和量子点电视的H-K效应差异,根据Kaiser模型与Nayatani模型分析纯色实验的测试结果,并通过彩色实验探究了显示器的色域对感知亮度与主观偏好的影响。
2 H-K效应理论与数学模型
在显示领域,物理亮度(Luminance)和感知亮度(Brightness)的概念有所不同,物理亮度是一个可测量的物理概念,不考虑人眼的感知,而感知亮度不仅受到光源自身影响,还受到观看环境、观看者的心理因素等影响[26]。Helmholtz定义了色纯度(%P):

式中,S是评估色点,N是白点的色坐标位置,DW是主波长。对于主波长相同的不同色点,其色纯度%P越高,感知亮度/物理亮度(B/L值)越高[18]。H-K效应揭示了亮度与色度之间的关系,为了更好地量化此效应,Dowling与Nayatani等人提出了不同的数学模型来描述H-K效应。
2.1 Kaiser模型
Kaiser等人基于实验结果,提出了Kaiser模型[27-30]。感知亮度L**主要受两个因素影响,即颜色分量F和物理亮度分量log(Y)。其公式表示如下:

其中,Y表示颜色的物理亮度,x,y为颜色的CIE 1931色坐标。当两块物理亮度不同的屏幕(Y1与Y2)具有相同的感知亮度时,其物理亮度比值被称为感知相对亮度,用RB表示,RB如式(5)所示:

其中,Y2/Y1为实测值,为理论计算值。RB表示感知亮度相同的情况下,两块屏幕物理量度的比值。实验中,F1与F2可通过色坐标求得,进而得出理论计算值;通过调节两块屏幕的亮度使二者的感知亮度相同,再测量实际屏幕的物理亮度可得到Y1与Y2,进而可求得RB。
2.2 Nayatani模型
1991年,Nayatani提出计算H-K效应的数学模型,并在1997年进一步完善,Nayatani认为,模型不仅需要考虑待测光本身,还需要考虑环境的影响[31-32]。本实验在Nayatani模型的基础上,提出H-K效应的计算模型:

式中γVAC用于衡量待测光的H-K效应,Leq是与测试光感知亮度相同的白光物理亮度,L是测试光的物理亮度。
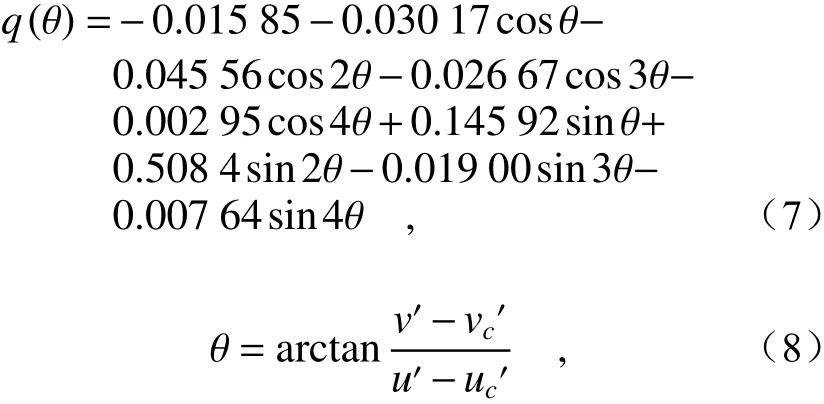
式中v′与u′为待测光在CIEUV空间中的色坐标,可由x,y转换得到,vc′与uc′为白光在CIEUV空间中的色坐标。

式中La为环境亮度。

综上,Nayatani模型通过测定环境光、待测光与参考光的参数,获得γVAC值。本论文根据上述两种模型开展了观看者亮度感知实验,通过实验测试结果与模型计算结果的对比,分析了量子点电视的H-K效应。
3 实验部分
选取TCL 55F8(YAG电视)和TCL 55C715(量子点电视)做为样机,分别代表普通LCD电视和量子点LCD电视。为了模拟客厅使用环境,在暗室中创建了150 lx左右的光照环境。邀请11名观看者参加测试,年龄在20~35岁之间。所有观看者的视力(或矫正视力)均大于1.0,无色盲和色弱。具体实验环境参照GY/T134 《数字电视图像质量主观评价方法》[33],如表1所示。
3.1 纯色实验
纯色实验场景如图1(a)所示,将量子点电视和YAG电视置于同一水平桌面上,使观看者处于两台电视机的中垂线上,且与两台电视机视角一致。采用相同的HDMI信源,依次输入R、G、B3个纯色画面。固定YAG电视的亮度不变,观看者通过调试量子点电视亮度使其与YAG电视的感知亮度一致,并同时实测量子点电视和YAG电视的物理亮度,二者的物理亮度之比用“QD/YAG”表示。
3.2 彩色实验
在纯色实验的基础上,将画面替换为两组彩色画面。一组为鲜艳画面:红花与绿叶;一组为平淡画面:田野与人像。为了便于观测者观察,所有试验图片均为轴对称图形。
为了去除机芯对画质的影响,展示不同画质的电视机必须保持机芯统一。本实验采用两台TCL 65C8(侧入式机型),分别做以下改装:(1)导光板从中间一分为二,量子点膜只保留左半边,左边均采用蓝色LED灯条;右边采用YAG灯条;为了防止左右两边光互相干扰,导光板分界线处贴有导光板侧面反射膜。(2)灯条通过直流源供电,以实现左右两边亮度不一致;(3)样机在显示白场画面时,确保左右两边白场色点、色温一致。改装好的样机与测试示意图如图1(b)所示。调节量子点电视灯条的电流,使之可以处于200 nit、300 nit、400 nit、500 nit任意档位,观看者调节YAG电视灯条的电流使其感知亮度与量子点电视相同,测量YAG电视的物理亮度,计算QD/YAG值。
3.3 主观喜好实验
邀请20名观看者进行测试,使用卖场宣传视频的10幅截图,所有图形均为左右对称或接近左右对称。进行200 nit、270 nit和350 nit等感知亮度(实测亮度不一样)下的喜好实验。
4 结果与讨论
4.1 纯色实验结果与讨论
两台样机的白场色点保持一致,图2(a)(彩图见期刊电子版)给出了两台样机的光谱图,黄线与蓝线分别表示量子点电视与YAG电视的白光光谱,量子点电视的光谱半峰宽更窄;图2(b)(彩图见期刊电子版)给出了两台电视机的色域图,量子点电视的色域更高。
图3(彩图见期刊电子版)给出了不同亮度下的QD/YAG实测值与模型计算值,圆点表示实测值,黑色虚线表示实测值平均值,绿色虚线与蓝色虚线分别表示根据Kaiser模型与Nayatani模型计算得到的理论值,理论计算值与实测值越小,HK效应越明显。由于量子点电视和YAG电视的蓝光都是由GaN芯片发出的,蓝光感知的差异非常小,本文主要对比了红光与绿光的H-K效应。从实验数据可以看出:红、绿光的实测平均值在分别为0.75±0.045、0.86±0.040,说明量子点电视的H-K效应非常显著,特别是红光。通过对比Kaisar模型与Nayatani模型的计算值可知,Nayatani模型在红色与实测值更吻合,Kaisar模型在绿色与实测值更吻合。实测值与理论值存在差异的原因可能是抽样总体和实验设置的不同。Kaiser模型和Nayatani模型基于白种人,而本文的测试结果基于黄种人,人种眼睛的差异可能是造成上述感知差异的主要原因[34]。
4.2 彩色实验结果与讨论
为进一步研究量子点电视的H-K效应,本实验采用两组测试画面做进一步对比研究,一组为鲜艳画面:红花与绿叶;一组为平淡画面:田野与人像。
图4(彩图见期刊电子版)给出了不同亮度下彩色与平淡画面的QD/YAG值,红色与绿色虚线分别表示红花与绿叶画面的QD/YAG值,紫色与黄色虚线分别表示人像与田野的QD/YAG值。结果表明:对于鲜艳画面,在电视灯条电流由200 nit提升到500 nit的过程中,H-K效应逐渐变弱并趋于平缓,鲜艳画面的H-K效应比平淡画面更显著,红花图像的QD/YAG最小值可达0.74。对于平淡画面,量子点电视与YAG电视的色彩表现能力相当。由上述结果可知:量子点电视对于鲜艳画面的表现能力更强,给人更加明亮的感觉。
4.3 主观喜好实验
研究发现,在纯色与彩色实验中,即使量子点电视与YAG电视的感知亮度相同,同一画面下,观看者更加青睐量子点电视,本论文进一步开展了主观喜好实验。图5(彩图见期刊电子版)给出了相同感知亮度下,观看者对量子点电视与YAG电视的喜好情况。实验结果表明:同等感知亮度下,量子点电视总体占优势,量子点电视在200 nit、270 nit、350 nit的喜好比例分别为54.3%、55.0%、58.0%;这种偏好与性别、与是否为背光行业人员无明显关系;量子点电视在红绿画面具有很大优势,在量子点电视亮度为350 nit时,红绿画面的喜好比例可达73.8%,YAG在蓝黄画面具有优势;随着电视亮度的提升,喜好量子点电视的人越来越多。
5 结 论
本论文通过观看者亮度感知实验,对比了YAG电视和量子点电视的H-K效应差异,根据Kaiser模型与Nayatani模型分析纯色实验的测试结果,并通过彩色实验探究了显示器的色域对感知亮度与主观偏好的影响。实验结果表明:量子点电视具有更为显著的H-K效应,感知亮度明显高于传统YAG电视;在同样的感知亮度下,红、绿的QD/YAG的实测平均值分别为0.75±0.05、0.86±0.04;鲜艳画面的QD/YAG最小值可达0.74;在相同感知亮度下,高色域的量子点电视更受欢迎,并且喜好趋势将随着亮度的增加而增加。总之,在同等感知亮度下,量子点电视不仅物理亮度低,而且更受用户喜爱,对于健康显示的发展具有重要意义[35]。
值得关注的是,中国液晶显示产业已经位居世界第一,2020年液晶产量占全世界的70%。量子点背光技术是延长液晶产业的核心技术。我国的量子点显示技术在国际上处于第一集团,在量子点LED领域的核心材料、器件以及集成方面都有了先发优势[36-37]。此外,TCL、京东方等国内龙头企业已于2020年发布了基于印刷技术的量子点电致发光显示技术样机。本研究为推广量子点技术提供了理论依据。
猜你喜欢
杂志排行
中国光学的其它文章
- 《中国光学》约稿信
- 院士访谈
- Enhancing the fluorescence emission by flexible metal-dielectric-metal structures
- 《发光学报》
——EI核心期刊(物理学类;无线电电子学、电信技术类) - Fabrication of an ultra-narrow band-pass filter with 60 pm bandwidth in green light band
- Experimental investigation on propagation characteristics of vortex beams in underwater turbulence with different salinity
