Simulation and experimental analysis of melt pool evolution in laser engineered net shaping
2022-03-04ZhungzhungMoWeiFengCeHoZhnweiLiu
Zhungzhung Mo, Wei Feng, Ce Ho, Zhnwei Liu,*
a School of Aerospace Engineering, Beijing Institute of Technology, Beijing 100081, China
b AECC Commercial Aircraft Engine Co. Ltd., Shanghai 200241, China
Keywords:Additive manufacturing Laser engineered net shaping Melt pool evolution Simulation analysis Temperature measurement
ABSTRACT In this work, the evolution of melt pool under single-point and single-line printing in the laser engineered net shaping (LENS) process is analyzed. Firstly, the basic structure of the melt pool model of the LENS process is established and the necessary assumptions are made. Then, the establishment process of the multi-physical field model of the melt pool is introduced in detail. It is concluded that the simulation model results are highly consistent with the online measurement experiment results in terms of melt pool profile, space temperature gradient, and time temperature gradient. Meanwhile, some parameters, such as the 3D morphology and surface fluid field of the melt pool, which are not obtained in the online measurement experiment, are analyzed. Finally, the influence of changing the scanning speed on the profile, peak temperature, and temperature gradient of the single-line melt pool is also analyzed, and the following conclusions are obtained: With the increase in scanning speed, the profile of the melt pool gradually becomes slender; The relationship between peak temperature and scanning speed is approximately linear in a certain speed range; The space temperature gradient at the tail of the melt pool under different scanning speeds hardly changes with the scanning speed, and the time temperature gradient at the tail of the melt pool is in direct proportion to the scanning speed.
The numerical simulation technology can avoid the harsh measurement conditions during field measurement, and provide an effective reference for understanding the temperature distribution characteristics and evolution mechanism of the melt pool. Therefore, many scholars use finite element simulation technology to study the temperature distribution of melt pools. The laser power,powder feeding speed, laser diameter, scanning speed, and other parameters have a great impact on the printing quality, so many scholars have carried out numerical simulation research on the combination setting of printing parameters [1–5]. Manvatkar et al.[6] calculated the size, peak temperature, and cooling rate of the melt pool of austenitic stainless steel (SS316) during direct energy deposition (DED) based on the3D heat transfer model of the finite element method. It was found that for constant laser power and scanning speed, the layer width and peak temperature of the melt pool increased, while the cooling rate decreased towards the top layer. Moreover, the predicted values of the layer width and print height of the simulation method were in full agreement with the actual measured values. Cheng and Chou [7] simulated the melt pool temperature distribution of Ti6Al4V material in the electron beam powder bed melting process based on the finite element method and predicted the geometric characteristics of the melt pool under different process parameters (scanning rate, electron beam power, electron beam diameter). Yang et al. [8] developed a 3D transient finite element method for moving Gaussian laser heat source to predict the depth and width of heat affected zone on Ti6Al4V alloy workpiece, and obtained the conclusion that the depth and width of heat affected zone increased with the increase of laser power while decreased with the increase of laser spot size and laser scanning speed. Ahmed and Mian [9] studied the sensitivity of melt pool peak temperature to temperature-related material properties (including density, specific heat, and thermal conductivity) during printing for a certain range of laser power and laser scanning speed. They found that for a specific set of process parameters (such as laser power and scanning speed), the melt pool temperature is the most sensitive to material thermal conductivity; Changes in the other mechanical and physical properties of the powder and melt pool (such as density and specific heat) have the least effect on the melt pool temperature. Manvatkar et al.[10] fully considered the addition process of powder particles and calculated the laser beam energy absorbed when the powder particles coaxially passed through the laser beam in the process of establishing the 3D heat transfer and fluid flow model under the DED process so that the variation curve of melt pool peak temperature and temperature with time is completely consistent with the corresponding independent experimental measurement results. They also pointed out that, the convective heat transfer of liquid alloy is the main way of heat transfer in the melt pool during laser additive manufacturing. In this paper, the single-point printing and single-line printing in laser engineered net shaping (LENS) process are simulated, and the simulation model results are compared with the online measurement experiment results, which provides more comprehensive information for understanding the formation and evolution of melt pool.
COMSOL Multiphysics is used to establish a multi-physical field numerical simulation model including the heat transfer and laminar flow in the melt pool. In the modeling process, the effects of many physical factors such as the transformation of solid-liquid phase transition, the strong convective heat transfer, the effect of recoil pressure, the Marangoni effect, the surface tension, and the addition of metal powder are considered. The laser model is set as a moving Gaussian light source. The free surface of the melt pool is simulated by rbitrary Lagrangian Euler (ALE) method. The melt pool model under the single-point printing and single-line printing is established. The time length of single-point printing is 200 ms and that of single-line printing is 1000 ms. The material is nickel base alloy Inconel 625. The physical parameters of nickel base alloy Inconel 625 are set according to the literature [11,12].
LENS is a complex process coupled with multiple physical fields. To simplify the numerical simulation model, the following basic assumptions are made:
(1) Discrete metal powder can be simplified into non-discrete metal body.
(2) The fluid in the melt pool is an incompressible Newtonian fluid, and the flow form is laminar fluid.
(3) The laser is an ideal Gaussian light source, and there is no fluctuation of energy flux density in space.
(4) The absorptivity of laser is a constant that does not change with the temperature.
(5) The mass loss caused by the evaporation is small and can be ignored.
(6) The chemical reaction in the melt pool can be ignored.
(7) The addition rate of the metal powder per unit area remains constant.
(8) The momentum generated by the addition of metal powder is negligible.
The numerical simulation model includes two physical fields:heat transfer field and laminar fluid field, so there are two governing equations coupled by the flow velocity→u. The heat transfer equation changes with time and is controlled by Fourier law. The laminar fluid field is controlled by Navier–Stokes.
In the process of adding metal powder, the metal powder will absorb heat by heating up and completing the solid-liquid phase transition. Therefore, the heat fluxQson the surface of the melt pool can be expressed as
whereQlaserrepresents the heat flux generated by laser heating andQpowderrepresents the heat flux reduced due to the addition of metal powder.
It is assumed that when the metal powder contacts the melt pool or substrate surface, its temperature will quickly become the same as the temperatureTof the contact point. When theTis lower than the solidus temperature, the heat flux absorbed by the metal powder can be expressed as
whereCsis the solid-state hot melting of metal,T0is the initial temperature,Qmis a constant mass flux, andTsis the solidus temperature.
When theTis higher than the liquidus temperature, the metal powder needs to absorb additional heat to complete the solidliquid phase transition, which is the latent heat of meltingLm. The heat flux absorbed by the metal powder can be expressed as
whereTlis the liquidus temperature,Clis the liquid state specific heat of metal.
To simulate the absorption and release of latent heat in the melting process, it is necessary to modify the heat capacity of metal with the contact point temperature between the solid phase line and the liquid phase line by the display hot melt method. According to the modified heat capacityC, the heat flux absorbed by the metal powder in the phase transition temperature range can be expressed as
To sum up, the heat flux absorbed by metal powder can be expressed as
ALE method can track the free surface of the melt pool and is more accurate in calculating the surface tension effect and local surface curvature [13]. At the same time, the free surface of the melt pool is affected by many factors, such as convective heat transfer, recoil pressure, Marangoni effect, surface tension, and so on. The protective gas is continuously sprayed from the laser head at a high speed in the LENS process, which will form strong convection on the surface of the melt pool. Therefore, there is a strong heat exchange process between the surface of the melt pool and the air. The melt pool surface of the model is approximately smooth, and its flow heat transfer coefficientHis calculated according to the literature [11]. When a strong laser irradiates the melt pool surface, the liquid metal will evaporate. Due to the rapid release of the metal vapor on the material surface, the melt pool surface will be subjected to the recoil pressure of the gas. The recoil pressure is related to the evaporation rate of liquid metal,while the evaporation rate is related to the temperature. Therefore,the recoil pressure is affected by the temperature of the melt pool surface, and the relationship formula between them is deduced in the literature [14]. The Marangoni effect will change the surface tension of the interface, and the surface tension of the melt pool is calculated according to the literature [15].
The geometric models of the single-point printing and singleline printing are all divided by free tetrahedron mesh, and the dimensions of the two models are 5 mm×2.5 mm×2 mm and 333 mm×166.5 mm×5 mm, respectively.
The simulation results will be compared with the experimental results in our previous work [16]. The temperature measurement system during the experiment is shown in Fig. 1, which mainly includes dual-channel filter device, long-focus and microscopic lens,and CMOS camera. Specific details of dual-channel filter device can be seen in the literature [16]. The main experimental parameters are as follows: The printing material was Inconel 625 metal powder; The laser engineered net shaping machine used a continuous wave fiber laser (1064 nm focused to a 3 mm spot diameter)and the laser power was 1.4 kW; The model of the long-focus microscopic lens with a 3–20 μm resolution is LY-WNSLDM650; The working distance of the system is 130 mm-2000 mm; The camera model was MER-301-125U3M; The scanning speed of the singlepoint printing was 12 mm/s in the single-line printing;
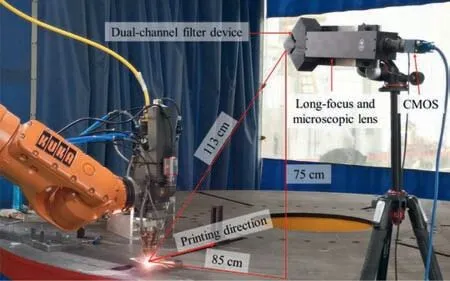
Fig. 1. Temperature measurement system during experiment.
The simulation working condition of single-point printing is:the laser power is 1400 W, the laser working time is 200 ms,and the calculation time is 300 ms. Therefore, the calculation results include the formation, development, and cooling process of the melt pool. Figures 2 and 3, respectively show the 3D morphology and temperature distribution and the front view of temperature distribution of a single-point melt pool. It is worth noting that the pictures shown are timed from the time when the laser starts to work.
Compare the melt pool temperature field at 198 ms in the simulation model with that at 176 ms in the online measurement experiment [16], as shown in Fig. 4. In the simulation model, the time starts from the time when the laser starts to work, while in the experiment, the time starts from the time when the temperature measuring system collects the melt pool. Because the start time of the simulation model is different from that of the online measurement experiment, the melt pool field at these two times are approximately corresponding. It can be found from Fig. 4 that the melt pool temperature fields obtained by the two methods all have the following characteristics: The temperature distribution is uneven; The high temperature center is located at the position with the maximum laser energy density; The temperature distribution of the melt pool is consistent with the laser energy density distribution. In the simulation model, the energy density distribution of the laser is stable, so the high temperature center position of the melt pool in Fig. 4a does not change with time, and the temperature distribution of the melt pool presents favorable symmetry.
The energy flow density distribution control equation of the moving Gaussian laser light source can be expressed as:
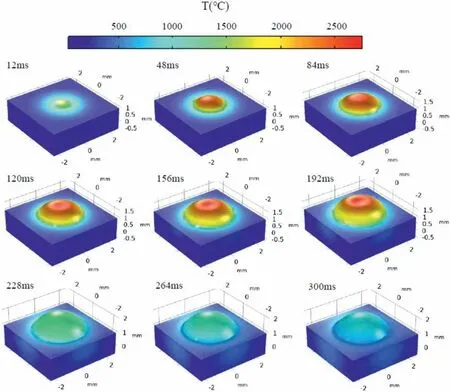
Fig. 2. 3D morphology and temperature distribution evolution process of single-point melt pool.
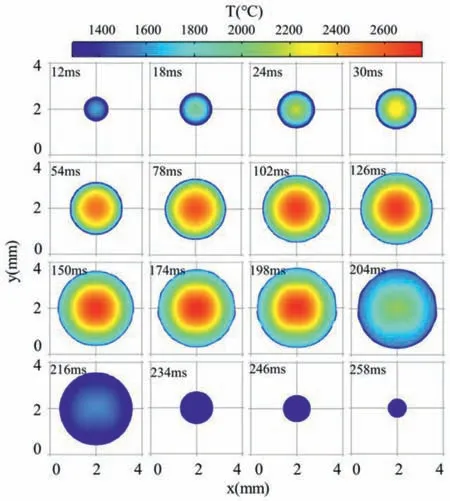
Fig. 3. Front view of temperature distribution of single-point melt pool.

Fig. 4. Comparison results of (a) melt pool temperature field at 198 ms in simulation model and (b) melt pool temperature field at 176 ms in online measurement experiment.
whereQlaserrepresents the heat flux of the material surface, A represents the absorption rate of the material to the laser,Plaserrepresents the laser power,r0represents the focusing radius of the laser, r represents the distance from the target point to the laser focusing center point. Besides,
where (x,y) represents the plane coordinates of the object point,(x0,y0)represents the plane coordinates of the laser focus center point, andvlaserrepresents the scanning speed of the laser.
However, in the actual experimental measurement, the energy density distribution may change due to the instability of the laser.Besides, the metal powder and droplet splash may occur in the process of experimental measurement. Therefore, the temperature distribution in Fig. 4b shows asymmetry, which is different from the simulation results.
Figure 5 shows the difference between the melt pool temperature field at 246 ms in the simulation model and the melt pool temperature field at 224 ms in the online measurement experiment [16]. In the simulation model, the discrete element model of metal powder is not established, but replaced by the metal block model, which makes the heat transfer medium of the melt pool dense and uniform. Therefore, in the cooling stage, the temperature distribution of the melt pool in the simulation model remains symmetrical and circular; In the online measurement experiment,the metal powder has irregular sputtering, and the metal powder has a loose structure compared with the block, which makes the heat transfer process of the melt pool uneven and the temperature distribution asymmetric.

Fig. 5. Melt pool temperature field (a) at 246 ms in simulation model and (b) at 224 ms in online measurement experiment.
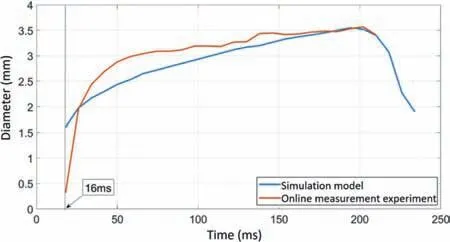
Fig. 6. Melt pool profile diameter at different times in simulation model and online measurement experiment.
Figure 6 shows the change process of melt pool profile diameter with time in the simulation calculation and experimental measurement results, and the 16 ms of the simulation model corresponds to the 0 ms of the online measurement experiment. The similarities between the simulation results and the measurement experimental results are: (I) The maximum value of the melt pool profile diameter in the simulation model is about 3.55 mm, while that in the online measurement experiment is about 3.57 mm; Therefore, the maximum value of the melt pool profile diameter in the simulation model and the online measurement experiment is close to the same, and both of them appear at 200 ms. (II) In the laser heating phase, the melt pool profile diameter increases with time,and the growth rate gradually slows down. When the laser stops heating (after 200 ms), the diameter begins to decrease.
The differences between the simulation results and the measured experimental results are: (I) At about 16 ms, the melt pool profile diameter in the simulation model is larger than that in the online measurement experiment; Because the discrete metal powder is simplified as a block in the simulation model, its structure is denser and the heat transfer is faster; In the online measurement experiment, the metal powder is relatively loose and the heat transfer is slower, and there may be heat loss caused by a large number of unmelted powder spraying; Therefore, when the melt pool is just formed, the melt pool profile diameter of the simulation model is larger. (II) In the online measurement experiment,the melt pool profile diameter increases rapidly in the forming stage, while that slows down significantly in the stable stage; In the simulation model, the melt pool profile diameter changes gently in the forming stage and stable stage; Especially in the forming stage, the growth rate of the melt pool profile diameter in the simulation results is significantly smaller than that in the online measurement experiment. The energy density distribution of laser is stable in the simulation model, while it fluctuates due to instability in the online measurement experiment, which makes the area with the most concentrated laser energy not always in the center of the melt pool, but in a small range near the center of the melt pool;This factor makes the diameter of the melt pool increase rapidly in the forming stage of the online measurement experiment; When the diameter of the melt pool increases to 2.5–3 mm, the influence of small range fluctuation of laser on the heat conduction at the edge of the melt pool is relatively reduced, so the growth of the melt pool profile slows down significantly at this time.

Fig. 7. Change process of melt pool peak temperature with time in simulation model and online measurement experiment.
Figure 7 shows the change process of the melt pool peak temperature with time in the simulation model and online measurement experiment. From the changing trend of the two temperature curves, the two results have a high degree of coincidence. The slope changes of the two temperature curves in the forming stage are the same. The peak temperature gradient of the two temperature curves is 3.75×10⁴°C/s in the initial stage, and then the slope of the two curves slows down synchronously to enter the stable stage. In this stage, the temperature curve of the simulation model maintains a good smoothness, which is related to the ideal environment setting, while the online measurement experiment temperature curve fluctuates between about 2300 ~2800°C.This is related to the non-uniformity of metal powder addition, the fluctuation of protective gas flow, the fluctuation of laser energy distribution, and other factors in the experimental environment,but the trend of the two temperature curves in this stage is consistent. The peak temperature gradient 1.42×10³°C/s at this stage is calculated by using the simulation model. In the cooling stage,the two temperature curves are almost coincident, which indicates that their peak temperature gradient of them is -5.31×10⁴°C/s at this stage.
The results of the simulation model are compared with the online measurement experiment from three aspects: the spatial distribution of the melt pool surface temperature, the melt pool profile, and the melt pool peak temperature at different times. In general, the results of the simulation model are in good agreement with the online measurement experiment, so the simulation model is credible and can provide an important reference for the study of the forming characteristics of the melt pool. In addition to the melt pool temperature field, the numerical simulation model also obtained the change law of the 3D morphology of the melt pool with time (Fig. 2), which is a piece of important reference information not obtained in the online measurement experiment. With the increase of the melt pool temperature and the accumulation of metal powder, the melt pool bulges on the surface of the substrate in a spherical crown. When the laser is turned off, the concave trend at the top of the melt pool disappears rapidly. With the laser turned off, the temperature, evaporation degree and recoil force of the melt pool decreased rapidly. Under the action of surface tension, the surface of the melt pool shows a natural convex shape.
By extracting the temperature field of the model section, the depth information of the melt pool can also be obtained. Figure 8 shows the temperature distribution in the section with the symmetrical plane of the single-point model as the section. The black line in Fig. 8 is 1290°C isotherm, which is used to mark the liquid area of the melt pool.
In addition, Marangoni convection can also be observed from the simulation model results. Figure 9 shows the fluid field on the surface of a single-point melt pool at 174 ms. The fluid on the surface of the melt pool points from the center to the edge, and the fluid velocity direction is in the direction of the positive temperature gradient. This phenomenon is consistent with the theory that temperature gradient drives Marangoni convection. The maximum Marangoni convection velocity on the surface of the melt pool is about 0.3 m/s at 174 ms, which is quite large compared with the melt pool with a profile diameter of only about 3 mm. Therefore,Marangoni convection plays an important role in the heat transfer of the melt pool.
The simulation working condition of single-line printing is: the laser power is 1400 W, the laser working time is 1000 ms, the scanning speed is 12 mm/s, and the calculation time is 1100 ms.Figure 10 shows the temperature field and fluid field on the surface of the single-line melt pool at 700 ms. The black coil represents the 1290°C isotherm, the inner part of the coil represents the melt pool area, and the arrow on the surface of the melt pool represents the direction of fluid flow caused by the Marangoni effect.
Figure 11 shows the evolution process of melt pool temperature and morphology with time during the single-line printing. The outline of the single-line melt pool is circular at 50 ms, which is similar to that in the process of single-point printing; The growth rate of the melt pool profile in the x direction is much greater than that in the y direction, which makes its morphology no longer circular, but oval, and longer along the laser scanning direction; The profile area of the melt pool is stable after 400 ms and presents a wide head and narrow tail morphology.
As shown in Fig. 12, the melt pool temperature field at 800 ms(Fig. 12a) in the simulation model is compared with the melt pool temperature field at 256 ms (Fig. 12b) in the online measurement experiment [16]. The similarity between the two temperature fields is that the outline of the melt pool can be divided into head and tail, and the head is wide and the tail is narrow. In the simulation model, the width of the melt pool is about 3.2 mm and the length is about 5.2 mm. In the online measurement experiment,the width of the melt pool is about 3.5 mm and the length is about 5.2 mm. Therefore, the difference between the two temperature fields is small. The temperature distribution at the head of the two melt pools is different, and the difference is mainly related to the irregular movement of metal powder, gas flow, laser instability, and other factors, which is consistent with the corresponding single-point melt pool temperature distribution.
To compare the temperature change gradient of a single-line melt pool and calculate the cooling rate, the temperature distribution of the melt pool along the dotted line m in the simulation model and the dotted line n in the online measurement experiment are drawn, as shown in Fig. 13. The difference between the two temperature distributions mainly lies in the head of the melt pool. In the simulation model, the temperature distribution is relatively dispersed, and the curve at the high temperature center is smooth; In the online measurement experiment, the temperature distribution is concentrated, and the curve at the center of high temperature is relatively sharp. There may be two reasons for the difference. On the one hand, in the simulation model, the energy density distribution of the laser is a standard Gaussian distribution,while in the online measurement experiment, the energy density curve of the laser may be steeper and there may be energy density fluctuation; On the other hand, in the simulation model, the shape and dynamics of metal particles are ignored, and they are treated as blocks with zero velocity. In addition, the added metal is considered to start endothermic melting after reaching the surface of the melt pool. Some metal particles have melted into a liquid state before falling on the surface of the melt pool, and the temperature of high-temperature metal droplets may be higher than the surface temperature of the melt pool before they reach the melt pool area.
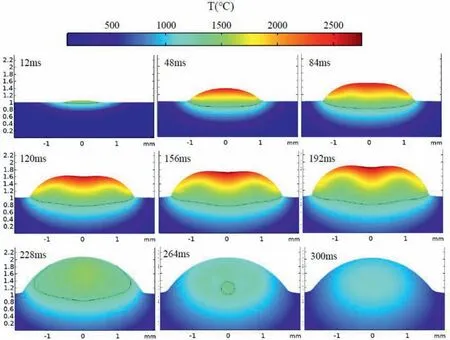
Fig. 8. Profile and temperature distribution on the section passing through the center in single-point melt pool model (Black line is 1290 °C isotherm).

Fig. 9. Fluid field on surface of a single-point melt pool at 174 ms.
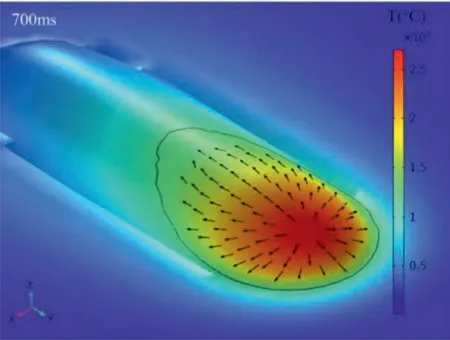
Fig. 10. Temperature field and fluid field on surface of single-line melt pool at 700 ms.
Figure 13 shows that along the scanning direction, the melt pool temperature curve is not a straight line, but a curve, which shows that the temperature gradient of the melt pool is different in different areas. From the head area to the melting point area of 1290–1350°C in the melt pool temperature curve of the simulation model, the temperature drop gradient of the melt pool gradually decreases and continues to move in the negative direction from the melting point area (this area represents the solid-state area).At this time, the temperature gradient takes an obvious turn, first becoming larger, and then gradually decreasing. This phenomenon is mainly caused by the phase change of the material. The phase change from liquid to solid needs to release more heat, that is, the latent heat of melting, so it becomes the turning point of the temperature gradient in the melting point region.

Fig. 11. Evolution process of melt pool temperature and morphology during singleline printing.

Fig. 12. Melt pool temperature field of (a) simulation model at 800 ms and (b)online measurement experiment at 256 ms.
The temperature gradient of the melt pool is analyzed from two aspects: spatial distribution gradient and time gradient. For the head of the melt pool, although the temperature distribution concentration of the simulation model is different from the online measurement experiment, their temperature gradients are approximately the same. The straight lines a, b, c, and d are drawn along the slope direction of the melt pool temperature curve. The slopes of straight lines a and c are the same, both 631°C/mm, which are located in the back half of the head of the simulation model and the online measurement experiment, respectively; The slopes of straight lines b and d are the same, both 1496°C/mm, which are located in the front half of the head of the simulation model and the online measurement experiment, respectively; The slope of the simulation model and the online measurement experiment at the tail is the same, for example, the slope of straight line e is 194°C/mm; The slope of the solid-state region is represented by a straight line f, which is about 199°C/mm. A single melt pool can be equivalent to the superposition of countless single-point melt pools. Combined with the laser scanning rate, the above spatial temperature gradient can be transformed into the time temperature gradient of a certain point in the melt pool. The time temperature gradients corresponding to straight lines a, b, e, and f are:-7575°C/s, 17,952°C/s, -2328°C/s, and -2388°C/s, respectively,where the negative sign indicates that the temperature decreases with time. In addition, the range of the “Plateau region” is also marked in Fig. 13. In the simulation model, the length of this area is less than 0.5 mm, hence the conclusion that the length of the“Plateau region” is short has been well verified by the online measurement experiment [16] and simulation model.

Fig. 13. Temperature distribution of melt pool along dotted line m in simulation model and dotted line n in online measurement experiment.

Fig. 14. Melt pool temperature field at different scanning speeds.

Fig. 15. Relationship between length and width of melt pool profile and scanning speed.
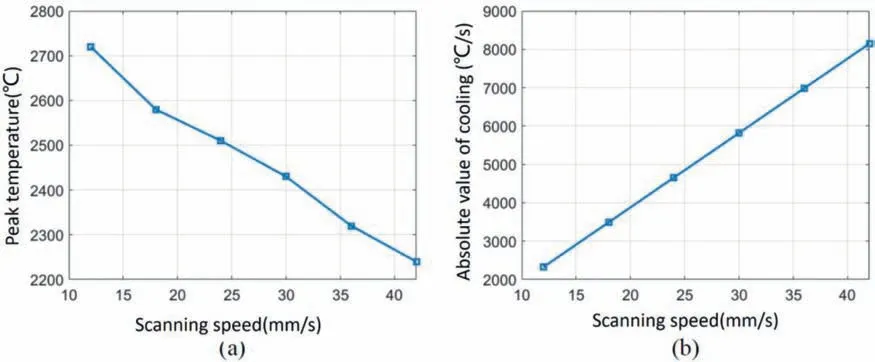
Fig. 16. (a) Peak temperature of melt pool at different scanning speeds; (b) Absolute value of cooling rate at tail of melt pool at the same scanning speed (time temperature gradient).
To obtain the influence of scanning speed on the temperature and profile of melt pool, the scanning speed is set as 12 mm/s,18 mm/s, 24 mm/s, 30 mm/s, 36 mm/s, and 42 mm/s, respectively,and the simulation results of single-line melt pool under different scanning speeds are obtained. At different scanning speeds, when the scanning path length is 9.6 mm, the melt pool temperature field is shown in Fig. 14. At different scanning speeds, the shape of the melt pool is similar in that the head is wide and the tail is narrow. The difference is that with the increase in scanning speed, the melt pool profile shows a “slender” trend, that is, under different scanning speeds, the size ratio of the length and width of the melt pool profile is different. Figure 15 shows the relationship between the length and width of the melt pool profile and the scanning speed. The width of the melt pool gradually decreases with the increase of the scanning speed, and the curve gradually “flat”; The length of the melt pool first increases with the increase of scanning speed, and while the scanning speed is greater than 18 mm/s,the length decreases with the increase of scanning speed, and the curve also gradually “flat”. The reasons for this phenomenon can be analyzed from two factors: (1) The increase in scanning speed means that the heating time per unit area is shortened within the scanning path, which will reduce the length and width of the melt pool; (2) The increase of scanning speed also means that along the scanning direction, the heated area per unit time becomes longer,which will make the length of the molt pool along the scanning direction have an increasing trend, and have little impact on the non-scanning direction. Based on the above analysis, the width of the melt pool is mainly affected by the factor (1), so it decreases with the increase of scanning speed, while the length of the melt pool is affected by the two factors (1) and (2), so it increases first and then decreases.
According to Fig. 14, the melt pool temperature field at different scanning speeds is consistent, and the high temperature center is located in the head and corresponds to the central area heated by the laser. Figure 16a shows the peak temperature curve of the melt pool under different scanning speeds. The peak temperature of the melt pool decreases with the increase of the scanning speed, and within the selected speed range, the peak temperature is approximately linear with the scanning speed. According to the calculation, the space temperature gradient (corresponding to the straight line e in Fig. 13) at the tail of the melt pool under different scanning speeds hardly changes with the scanning speed.Since the time temperature gradient is equal to the product of the space temperature gradient and the scanning speed, the cooling rate (time temperature gradient) at the tail of the melt pool is in direct proportion to the scanning speed, as shown in Fig. 16b. The conclusion is consistent with the literature [17].
This paper mainly simulates the evolution of melt pool under single-point printing and single-line printing in the LENS process.By comparing the simulation model results with the online measurement experiment results, it is concluded that the simulation results are in good agreement with the experimental results in terms of melt pool profile, space temperature gradient, and time temperature gradient. Meanwhile, some parameters, such as the 3D morphology and surface fluid field of the melt pool, which are not obtained in the online measurement experiment, are analyzed.By analyzing the influence of the change of scanning speed on the profile, peak temperature, and temperature gradient of single line molten pool, the following conclusions are obtained: With the increase of scanning speed, the profile of the melt pool gradually becomes slender; The relationship between peak temperature and scanning speed is approximately linear in a certain speed range;The space temperature gradient at the tail of the melt pool under different scanning speeds hardly changes with the scanning speed,and the time temperature gradient at the tail of the melt pool is in direct proportion to the scanning speed.
Declaration of Competing Interest
The authors declare that they have no known competing financial interests or personal relationships that could have appeared to influence the work reported in this paper.
Acknowledgment
This work was financially supported by the National Key R&D Program of China (Grant No. 2017YFB1103900), National Natural Science Foundation of China (Grant No. 11972084), National Science and Technology Major Project (2017-VI-0003-0073) and Beijing National Science Foundation (1192014).
杂志排行
Theoretical & Applied Mechanics Letters的其它文章
- A machine learning based solver for pressure Poisson equations
- Optimization for vibro-impact nonlinear energy sink under random excitation
- Performance improvement of the stochastic-resonance-based tri-stable energy harvester under random rotational vibration
- Clamping force of a multilayered cylindrical clamper with internal friction
- Hydrothermal analysis of hybrid nanofluid flow on a vertical plate by considering slip condition
- A structure-preserving algorithm for time-scale non-shifted Hamiltonian systems
