Transcriptome Analysis of Pacific White Shrimp (Litopenaeus vannamei) Under Prolonged High-Salinity Stress
2022-02-24LIYuquanCHENYigengCUIYantingSHENMinWANGRenjieandWANGZhongkai
LI Yuquan, CHEN Yigeng, CUI Yanting, SHEN Min, WANG Renjie,and WANG Zhongkai,
Transcriptome Analysis of Pacific White Shrimp () Under Prolonged High-Salinity Stress
LI Yuquan1), 2), #, CHEN Yigeng1), #, CUI Yanting1), SHEN Min1), WANG Renjie1),and WANG Zhongkai1),*
1),,266109,2),,266104,
The Pacific white shrimp () is a marine species commonly farmed worldwide. In northern China, it has been increasingly cultured in high-salinity waters (>40), but exhibits poor growth performance. In this study, postlarval shrimps were acclimated to salinity 55, cultivated for 3 months at this salinity, and compared with a control group reared at general salinity 25. Subsequently, high-throughput RNA sequencing was applied to compare the transcriptomic responses in the gills and hepatopancreasof the shrimps in the control group and the treatment group, while the weights of the shrimps in these two groups were significantly different. The results revealed that 11834 and 2115 genes were significantly differentially expressed in the gills and hepatopancreas, respectively. Additionally, enrichment analysis of the differentially expressed genes indicated that osmoregula- tion-associated Gene Ontology terms and KEGG pathways were similar between the two subgroups of the shrimp maintained at high salinity, suggesting that the growth rate of shrimp at high salinity is independent of osmoregulation. Furthermore, examination of the shrimp with different growth rates (., weights) at high salinity revealed molt-associated processes, namely, increased expression of ecdysone response genes and downstream effector genes in the gills and hepatopancreas of slow-growing shrimp, suggesting a role of the molt-associated processes in the regulation of shrimp growth at high salinity. Thus, we not only report adaptive transcriptomic responses ofto prolonged high-salinity stress, but also provide new insights into the shrimp growth regulation at high salinity.
salinity; growth; osmoregulation; transcriptome;
1 Introduction
Salinity is an influential environmental factor that exerts crucial selective pressure on aquatic organisms. Salinity va- riations can directly affect the composition and osmolality of body fluids of aquatic animals (Charmantier and Char- mantier-Daures, 2001). Crustaceans naturally inhabit aqua- tic environments with varying salinity levels, ranging from freshwater to highly saline seawater. This situation con- sequently requires these organisms to control their hemo- lymph osmotic pressureosmoregulation of their hemo- lymph osmolytes in relation to the environment they inha- bit (Charmantier., 2008; Romano and Zeng, 2012).
The Pacific white shrimp () is a typical euryhaline species possessing potent osmoregula- tion abilities and can grow in inland, coastal, or oceanic en- vironments. As a result of its rapid growth, strong disease resistance, suitability for high-density cultivation, and high tolerance to salinity variation,is widely cul- tured worldwide (Pante, 1990; Saoud., 2003; Kuma- ran., 2017). There are many high-salinity water bod- ies in the coastal and northwestern regions of China and waters with salinity levels of 40–70 can be found in appro- ximately 130000ha along the coast of Shandong Province. This water is unsuitable for other aquatic animals owing to the extreme environmental conditions, while shrimp farm- ing is an effective means of using high-salinity waters (Li., 2020). The development of shrimp farming in these high-salinity water bodies can not only expand the scope of aquaculture and raise farmers’ incomes but also provide a novel method for effective utilization of high-salinity waters in China. However, the cultivation ofin high-salinity waters still faces many obstacles, such as slow growth rates, low survival rates, and low disease re- sistance (Ramos-Carreño., 2014; Li., 2017a, 2017b; Shen., 2019; Zhao., 2019). Therefore, it is ne- cessary to comprehensively elucidate the molecular path- ways responsive to high salinity in shrimp to establish im- proved cultivation techniques for this species.
Extensive research has been conducted to understand the effects of ambient salinity and osmoregulation on the mo- lecular mechanism of salinity adaptation inVarious genes involved in osmoregulation have been cloned, including those coding the Na+/K+-ATPase (NKA) α-sub- unit, vacuolar-type H+-ATPase (V-ATPase) β-subunit (Pan., 2014), carbonic anhydrase (CA) (Liu., 2015), glutamate dehydratase (GDH) (Li., 2009, 2011), and crustacean hyperglycemic hormone (CHH) (Lago-Lestón., 2007; Tiu., 2007; Shinji., 2012). Nowadays,high-throughput sequencing technology is becoming in- creasingly popular as a tool for revealing the molecular me- chanisms behind various physiological changes in orga-nisms. Several transcriptomic and proteomic studies have been carried out to date to reveal the osmoregulation me- chanism inexposed to long-term or acute low- salinity stress (Chen., 2015; Hu., 2015; Wang., 2015; Zhao., 2015; Xu., 2017). Nonetheless, few studies have addressed the osmotic regulationthat operates under high-salinity stress in. Therefore, trans-criptomic characterization of the molecular mechanisms thatgovern the high-salinity acclimation ofis stillnecessary to obtain better insights that can improve the pro- duction as well as management of this commercially im- portant species.
As a vital organ for nutrient storage in, the hepatopancreas performs various functions related to en- ergy metabolism, nutrient absorption, and digestive-en- zyme synthesis while also playing a key role in immune function and detoxification (Gibson and Barker, 1979; Na- varrete del Toro and García-Carreño, 2019). Gill tissues, onthe other hand, are directly exposed to ambient water; con- sequently, changes in salinity should directly affect physi- ological status of the gills. Furthermore, gills are the pri- mary organ for breathing and ion exchangeand and havebeen shown to play a major part in osmoregulation in crus- taceans (Morris, 2001; Leone., 2017). To gain insights into the mechanisms underlying high-salinity adaptation in, it is necessary to identify differentially ex- pressed genes (DEGs) in the gills and hepatopancreas.
In the present study, we employed high-throughput RNA sequencing (RNA-seq) technology to examine transcrip- tomic responses of the gills and hepatopancreas from shrimps exposed to high-salinity and the control salinity. Our stu- dy highlighted the genes and pathways that react to pro- longed high-salinity stress and regulate shrimp growth. These data should improve the understanding of genetic- level responses to long-term high-salinity stress in. Consequently, this information can be utilized for improving the growth and development performance ofunder high-salinity conditions.
2 Materials and Methods
2.1 Animal Maintenance and Experimental Design
Postlarval(PL20) weighing 0.12g±0.02gwere obtained from a commercial farm in Haiyang, Yantai, China. The shrimps were acclimated for 7 days in two tanks (500L) containing aerated seawater at a salinity of 25. At the beginning of the experiment, the shrimps in one tank were maintained at salinity 25, while the shrimpsin the other tank were acclimated to salinity 55 through daily 2 increments in salinity by the addition of high-sali- nity seawater. After that, the shrimps in each tank were randomly assigned to triplicate tanks (100L) of each sali- nity treatment, at a density of 60 shrimps per tank. The 55 salinity tank was designated as the treatment group, while the 25 salinity tank was served as the control.
During the acclimation and experimental periods, the shrimps were fed a commercial diet thrice daily, at 08:00, 16:00, and 22:00. The culture water was exchanged at a daily rate of 50% tank volume, while the unconsumed feedwas removed daily with a siphon tube. Sea water was pump-ed from the Aoshan Coast (Qingdao, China) and filtered through an activated carbon cartridge for at least 3d be- fore entering the culture system. The water temperature was maintained at 28℃±0.5℃ throughout the experiment, whereas pH fluctuated spontaneously between 7.9 and 8.1. Dissolved oxygen levels exceeded 6.0mgL−1, and the am- monia-nitrogen level was less than 0.05−1, while with a na- tural photoperiod was maintained.
2.2 Sample Collection
Prior to the experimentation, no significant difference in the weight of the shrimps was observed between the groups. Following a 3-month trial, the shrimps were fasted for 24h preceding the sampling. The body weight (BW) and to- tal length (TL) of the shrimps were assessed at the end of the experiment. The molt stage of the shrimps was discern- ed by observing partial retraction of the epidermis in the uropod. Then, shrimps at the intermolt stage were random- ly chosen for sample collection from the 55_B subgroup (high BW & TL in the treatment group), 55_S subgroup (low BW & TL in the treatment group), and 25_Z group (control group) withone per replicate tank (three shrimp per group). The gills and hepatopancreas of the shrimps were rapidly excised, frozen in liquid nitrogen, and stored at −80℃ until RNA isolation.
2.3 RNA Isolation, Library Construction, and RNA-seq
Total RNA was isolated from gill and hepatopancreas tissues using the TRIzol®reagent (Invitrogen, USA). The genomic DNA was removed from the RNA by means of RNase-free DNase I (Takara, China), followed by analysis of the degradation and contamination of RNA by electro- phoresis of the samples in 1.0% agarose gels. RNA purity was verified on the NanoPhotometer®spectrophotometer (Implen, Germany). RNA concentration was measured with the Qubit®RNA Assay Kit on a Qubit®2.0 Fluorometer (Life Technologies, USA). Lastly, RNA integrity was as- sessed using the RNA Nano 6000 Assay Kit and the Agi- lent Bioanalyzer 2100 system (Agilent Technologies, USA) and was expressed as an RNA Integrity Number (RIN).
According to the results, RNA samples with high qua- lity (OD260/OD280=2.0–2.2, OD260/OD230≥2.0, RIN ≥8.0, and 28S:18S≥1.0) were used for library construc- tion. A total of 3μg of RNA per sample was used as the input material for the RNA sample preparation. Sequenc- ing libraries were generatedthe NEBNext®Ultra™ RNA Library Prep Kit for Illumina®(NEB, USA), and were then sequenced on the Illumina HiSeq 2500 platform with paired-end reads.
2.4 Data Analysis
2.4.1 Quality control of DNA sequence readings
Raw reads in the fastq format were initially processed using Perl scripts. The clean reads were obtained by the re- moval of reads containing adapters, reads containing poly- N, and low-quality reads from the raw data. At the same time, Q20, Q30, and GC contents of the clean data were calculated. All the downstream analyses were performed on these high-quality clean data.
2.4.2 Mapping of reads to the reference genome
Reference genome and gene model annotation files forwere directly downloaded from the NCBI ge-nome website (https://www.ncbi.nlm.nih.gov/genome/?term =penaeus+vannamei). The index of the reference genome was constructed in Hisat2 v2.0.5 software, which was al- so utilized for aligning the paired-end clean reads to the reference genome (Kim., 2015). We selected Hisat2 as the mapping tool because it can generate a database of splice junctions based on the gene model annotation file and thus may yield a better mapping result than other (non- splice) mapping tools.
2.4.3 Quantification of gene expression
The featureCounts v1.5.0-p3 software was used to de- termine the read numbers mapped to each gene (Yang.,2014). Then, the fragments per kilobase of transcript se- quence per million base pairs sequenced (FPKM) of each gene was calculated based on the length of a gene and the read count mapped to this gene. FPKM takes into account simultaneously the effects of sequencing depth and genelength on the read count, and is currently the most popu- lar metric for estimating gene expression levels.
2.4.4 Differential expression analysis and functional enrichment
Differential expression analysis of genes was perform- ed between the two groups of shrimps with the help of the DESeq2 R package (1.16.1) (Love., 2014). DESeq2 offers statistical routines for determining differential ex-pression in digital gene expression data using a model based on a negative binomial distribution. The resulting-va- lues were adjusted by the Benjamini-Hochberg procedure for controlling the false discovery rate. Genes with an ad- justed-value<0.05 and |log2(Fold change)|>1.0 were re- garded as differentially expressed.
Gene Ontology (GO) and Kyoto Encyclopedia of Genes and Genomes (KEGG) enrichment analyses of the DEGs were implemented by means of the clusterProfiler R pac- kage, in which gene length bias was corrected (Yu., 2012). GO terms or KEGG pathways with corrected- values less than 0.05 were considered significantly enrich- ed in a set of DEGs.
2.5 Experimental Validation of RNA-seq Profiles by qPCR
To validate our Illumina sequencing data, nine DEGs were chosen for quantitative PCR (qPCR) analysis in the same RNA samples that were used for the transcriptome profiling. Primers were designed in Primer 5 software (Ta- ble 1). First-strand cDNA was synthesized from 1μg of to- tal RNA using the PrimeScript RT Reagent Kit with gDNA Eraser (Takara, China). Amplicons were first examined by gel electrophoresis to confirm that a single product of ex- pected size was amplified, and the efficiency of the pri- mers was examined by means of real-time PCR Miner (Zhao and Fernald, 2005). Furthermore, these specific PCR products were verifiedSanger sequencing.

Table 1 Primers used in quantitative PCR
The amplifications were performed in a 96-well plate, and the reaction mixture (10μL volume) consisted of 5.0μL of 2×ChamQ Universal SYBR qPCR Master Mix (Va-zyme, China), 1.0μL of cDNA (10ngμL−1), 0.2μL each of 10μmolL−1forward and reverse primers, and 3.6μL of RNase-free water. qPCR was carried out on a CFX96 Touch Real-Time PCR Detection System (Bio-Rad, USA) as fol- lows: 95℃ (30s) for pre-incubation, followed by 40 cy- cles at 95℃ (10s) and 60℃ (30s). Finally, the melting cur- ve was analyzed to verify amplification specificity. The ac- cumulation of fluorescence signals from the SYBR Green dye was recorded in the 60℃ (30s) phase during each cy- cle. A negative control without template cDNA was in- cluded throughout. Each sample was analyzed in triplicate, along with the reference genes ubiquitin (Ub) and ribo- somal protein S12 (S12) (Álvarez-Ruiz., 2015; Ven- tura-López., 2016; Trejo-Flores., 2018; Galindo- Torres., 2019), and the expression level was norma- lized to the geometric mean of the two host genes (Van- desompele., 2002). The relative gene expression le- vels were calculated by the comparative Ct method using the formula 2−∆∆Ct(Livak and Schmittgen, 2001). qPCR da- ta were statistically evaluated by one-way analysis of va- riance (ANOVA), followed by Tukey’stest in SPSS 21.0 (SPSS, IL, USA), wherein<0.05 denoted a statistically significant difference. The qPCR results were then compared with transcriptome data (FPKM values) to assess a possible correlation between the two expression results for nine selected DEGs.
3 Results
3.1 Differential Growth of the Shrimp Under Prolonged High-Salinity Stress
The growth ofsubstantially varied under prolonged high-salinity stress. Therefore, to elucidate the molecular mechanisms underlying the differences in the growth of the shrimps under high-salinity stress, the shrimps in the experimental group were distributed into two sub- groups. The 83 shrimps with final weight less than 1.0g were set as 55_S (small shrimps), while the other 15 shrimps with final weight higher than 2.0g were named 55_B (big shrimps). The 135 shrimps in the control group were de- signated as the 25_Z group. As shown in Fig.1, final BW and TL of the shrimps were greater in the 55_B subgroup than in the 55_S subgroup (F=588.208,=97,=0; F=544.507,=97,=0), while there were no significant dif- ferences in BW and TL between 55_B and 25_Z shrimps (F=2.510,=149,=0.115; F=2.566,=149,=0.111).
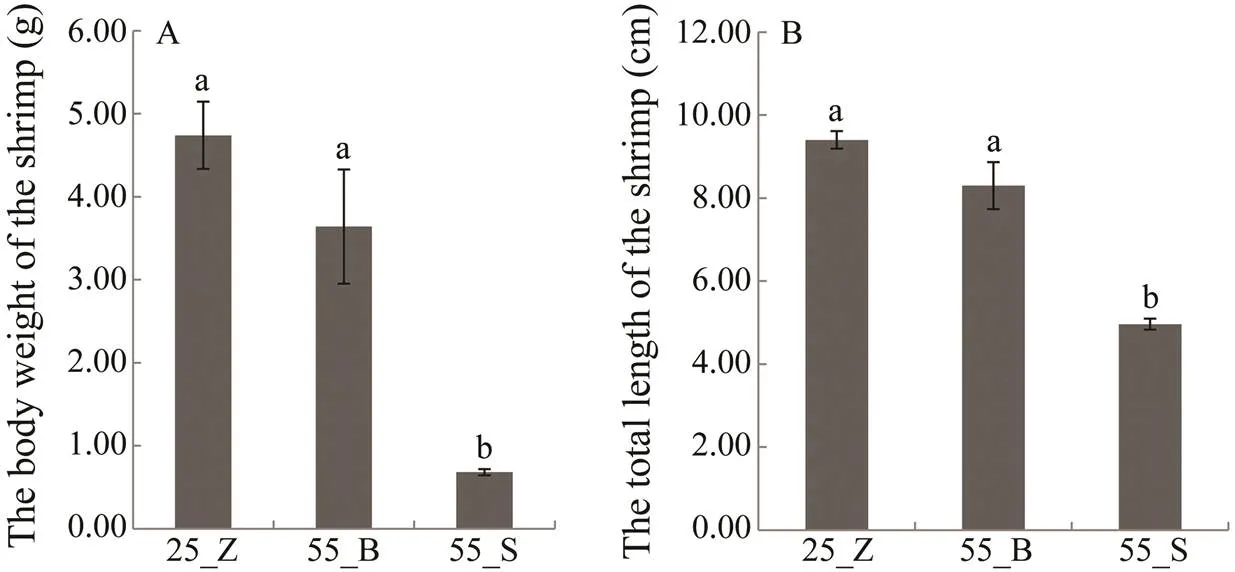
Fig.1 The final body weight (A) and total length (B) of the shrimp in the control group and two subgroups at high-salinity. All data are presented as mean±SEM (standard error of mean).Different superscripts indicate significant differences (P<0.05).
3.2 RNA-seq and Mapping Statistics
Total RNA was separately extracted from the gills and hepatopancreas of nine shrimps (three in each subgroup). After examination of the quality and integrity of the RNA, two RNA samples with poor quality were discarded. The remaining 16 RNA samples of high quality were used for the creation of cDNA libraries, followed by sequencing. The details were listed in Table 2. A total of 835084646 paired-end reads with 150-bp read length were generated from the 16 samples. The number of sequences in each sam- ple ranged from 41.98 to 67.50 million. After removing the reads containing adapters and/or poly-N, and low-quality reads, 829261486 clean reads were selected for further ana- lyses. The cleaned sequences in each sample ranged from 41.52 to 67.08 million readswith average Q20% at 96.52%, Q30% at 93.29%, and GC% at 47.21%, thus confirming the stability and consistency of sampling, library prepara- tion, and sequencing methodologies. Next, 710425508 clean reads were aligned to thegenome using Hi- sat2; the average mapping rate was 85.60% among thesamples. Raw reads were archived in the National Center for Biotechnology Information (NCBI) Sequence Read Ar- Bchive database (accession No. PRJNA649598).
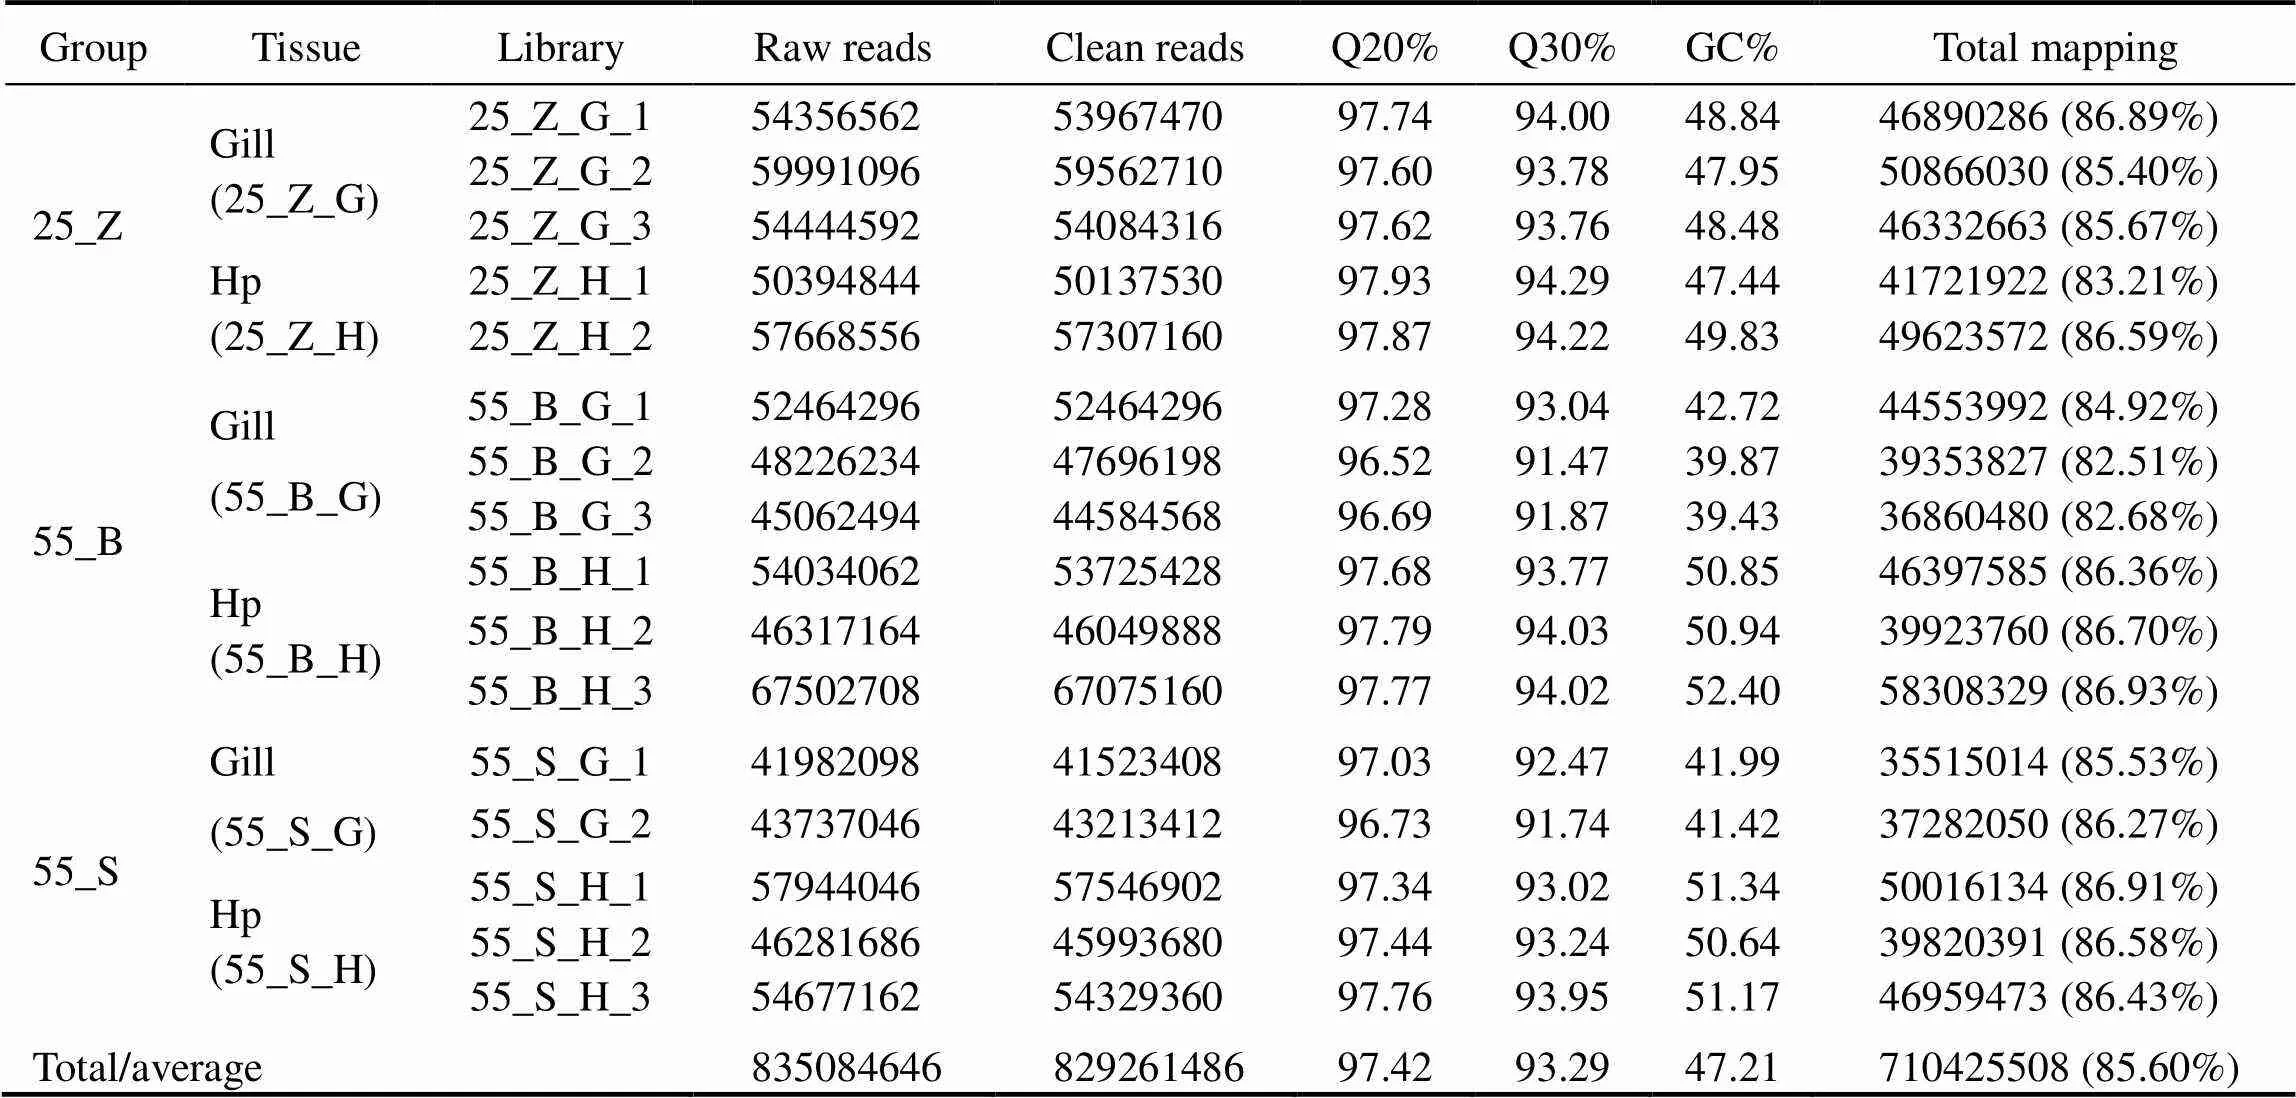
Table 2 Summary of sequence data generated from transcriptome sequencing, quality filtering, and genome mapping
3.3 Identification of DEGs
The DEGs in the hepatopancreas and gills between dif- ferent groups of shrimps were chosen by means of the fol- lowing criteria: an adjusted-value<0.05 and |log2(Fold change)|>1.0. In total, 11834 and 2115 DEGs were obtain- ed from the gill and hepatopancreas tissues, respectively. It is obvious that the quantity of DEGs was much less inthe hepatopancreas than in the gills in both subgroups (Fig.2). For example, in the comparison between 55_B and 25_Z shrimp, 873 DEGs were found in the hepatopancreas (55_ B_H. 25_Z_H), while there were 9315 DEGs in the gills(55_B_G. 25_Z_G). In addition, downregulated genes outnumbered upregulated ones in the gills, whereas a great number of upregulated genes was found in the hepatopan- creas. Furthermore, the number of DEGs identified in the comparison between the subgroups at high salinity (., 55_B_G. 55_S_G and 55_B_H. 55_S_H) was less than that identified in the comparisons of shrimps at different salinity levels (., 55_B_G. 25_Z_G and 55_B_H. 25_Z_H) (Fig.2).
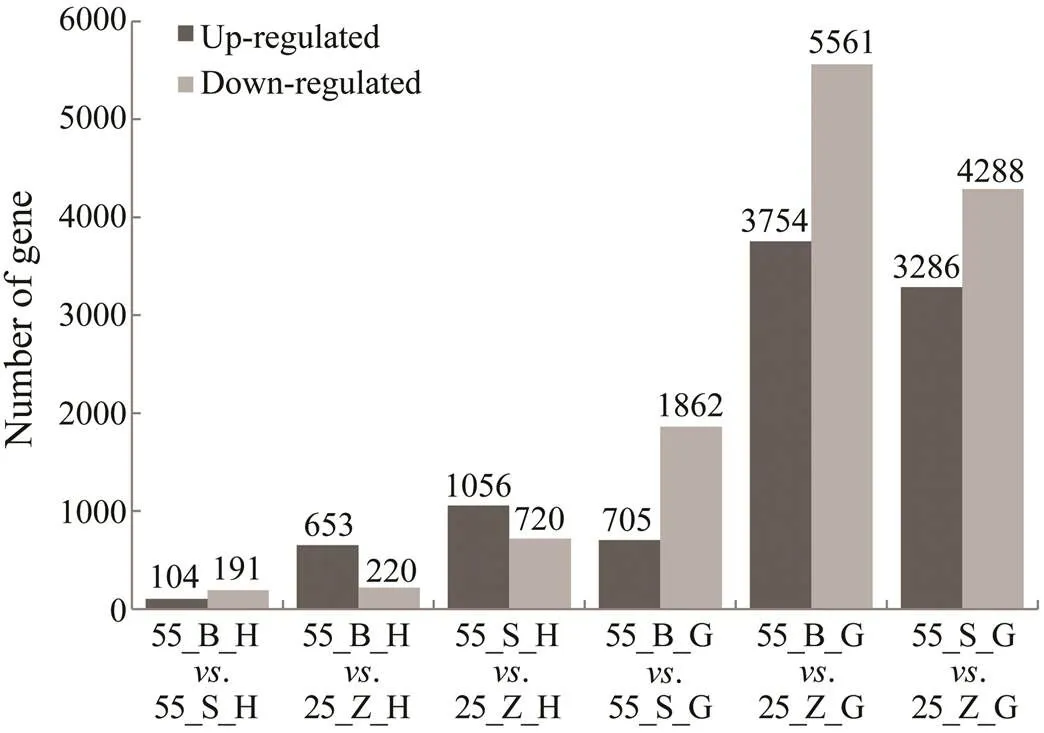
Fig.2 Statistics of DEGs between different groups. Black columns represent the number of up-regulated genes while grey columns represent the number of down-regulated ge- nes. The quantities of DEGs are shown above the columns.
3.4 GO Enrichment Analysis of the DEGs
In total, 74, 62, and 108 GO terms were significantly en- riched in the gills of the three subgroups (55_B_G. 55_ S_G, 55_B_G. 25_Z_G, and 55_S_G. 25_Z_G), res- pectively (<0.05). In addition, 52, 106, and 126 GO termswere separately significantly enriched in the hepatopan- creas of the three compared subgroups (55_B_H. 55_ S_H, 55_B_H. 25_Z_H, and 55_S_H. 25_Z_H;<0.05). The top five most significantly enriched GO terms in the DEG sets of gills and hepatopancreas are presented in Tables 3 and 4, respectively, including the-value of the GO terms and the number of upregulated and downregu- lated genes for each GO term. An overall comparison of the shrimp at high salinity (55_B_G. 55_S_G and 55_ B_H. 55_S_H) revealed that the significantly enriched GO terms were all downregulated in the shrimp with high- er weight (the 55_B subgroup). In addition, several GO terms, including chitin metabolic process (GO:0006030), hormone-mediated signaling pathway (GO:0009755), ex- tracellular region (GO:0005576), and chitin binding (GO: 0008061), were proved to be enriched both in the gill DEG set and in the hepatopancreas DEG set. Regarding the com- parison between the shrimp at different salinity levels, a ma- jority of the most enriched GO terms turned out to be sig- nificantly upregulated under the high-salinity stress relativeto the control (salinity of 25). Moreover, several GO terms such as translation (GO:0006412), cytoplasm (GO:00057 37), ribosome (GO:0005840), structural constituent of ribo- some (GO:0003735), and transferase activity, transferring phosphorus-containing groups (GO:0016772) were found to be the most enriched GO terms in the gill DEG set, in the comparisons between 55_B_G and 25_Z_G and be- tween 55_S_G and 25_Z_G. By contrast, only two GO terms, purine ribonucleoside monophosphate biosynthetic process (GO:0009168) and oxidoreductase activity (GO:0016491) were identified in the hepatopancreas DEG set in the com- parisons between 55_B_H and 25_Z_H and between 55_ S_H and 25_Z_H.
3.5 KEGG Enrichment Analysis of the DEGs
This analysis was performed to reveal the pathways that were significantly affected after the prolonged salinity chal- lenge. All the KEGG pathways that are significantly en- riched in the gill DEG set and significantly up-regulated in the hepatopancreas DEG set are presented in Tables 5 and 6, respectively, including thevalue of the pathways. In the gills, six pathways were shown to be upregulated, while three pathways were downregulated in the compa- rison between subgroups 55_B_G and 55_S_G. These in- cluded oxidative-stress-related pathways, such as ‘oxidative phosphorylation’ (dme00190), and metabolism-associated pathways, such as ‘citrate cycle’ (dme00020) (Table 5). Si-milar significantly downregulated pathways were identified in the comparison between 55_B_G and 25_Z_G and be- tween 55_S_G and 25_Z_G. These pathways comprised sig- naling-related cascades, such as the ‘Hippo signaling path- way-fly’ (dme04391), ‘TGF-beta signaling pathway’ (dme 04350), ‘phosphatidylinositol signaling system’ (dm04070),and ‘MAPK signaling pathway-fly’ (dme04013). The ‘ri-bosome’ (dme03010) was also prominent among the up- regulated pathways in both comparisons (Table 5).
No significantly altered pathway was identified in the hepatopancreas in the comparison between 55_B_H and 55_S_H, whereas 13 upregulated pathways were identi- fied when both high-salinity subgroups were separately com- pared with the control group (Table 6). The ‘oxidative phos- phorylation’ (dme00190) pathway was proved to be the mostsignificantly enriched one in the two comparisons. Other significantly altered pathways that were also common to both comparisons were associated with energy metabolism,lipid metabolism, and protein metabolism, including ‘fattyacid elongation’ (dme00062), ‘fatty acid degradation’ (dme 00071), ‘valine, leucine, and isoleucine degradation’ (dme00280), and ‘carbon metabolism’ (dme01200) (Table 6). Furthermore, ‘sphingolipid metabolism’ (dme00600) was the single pathway that was significantly downregulated in the comparison of subgroups 55_B_H. 25_Z_H.
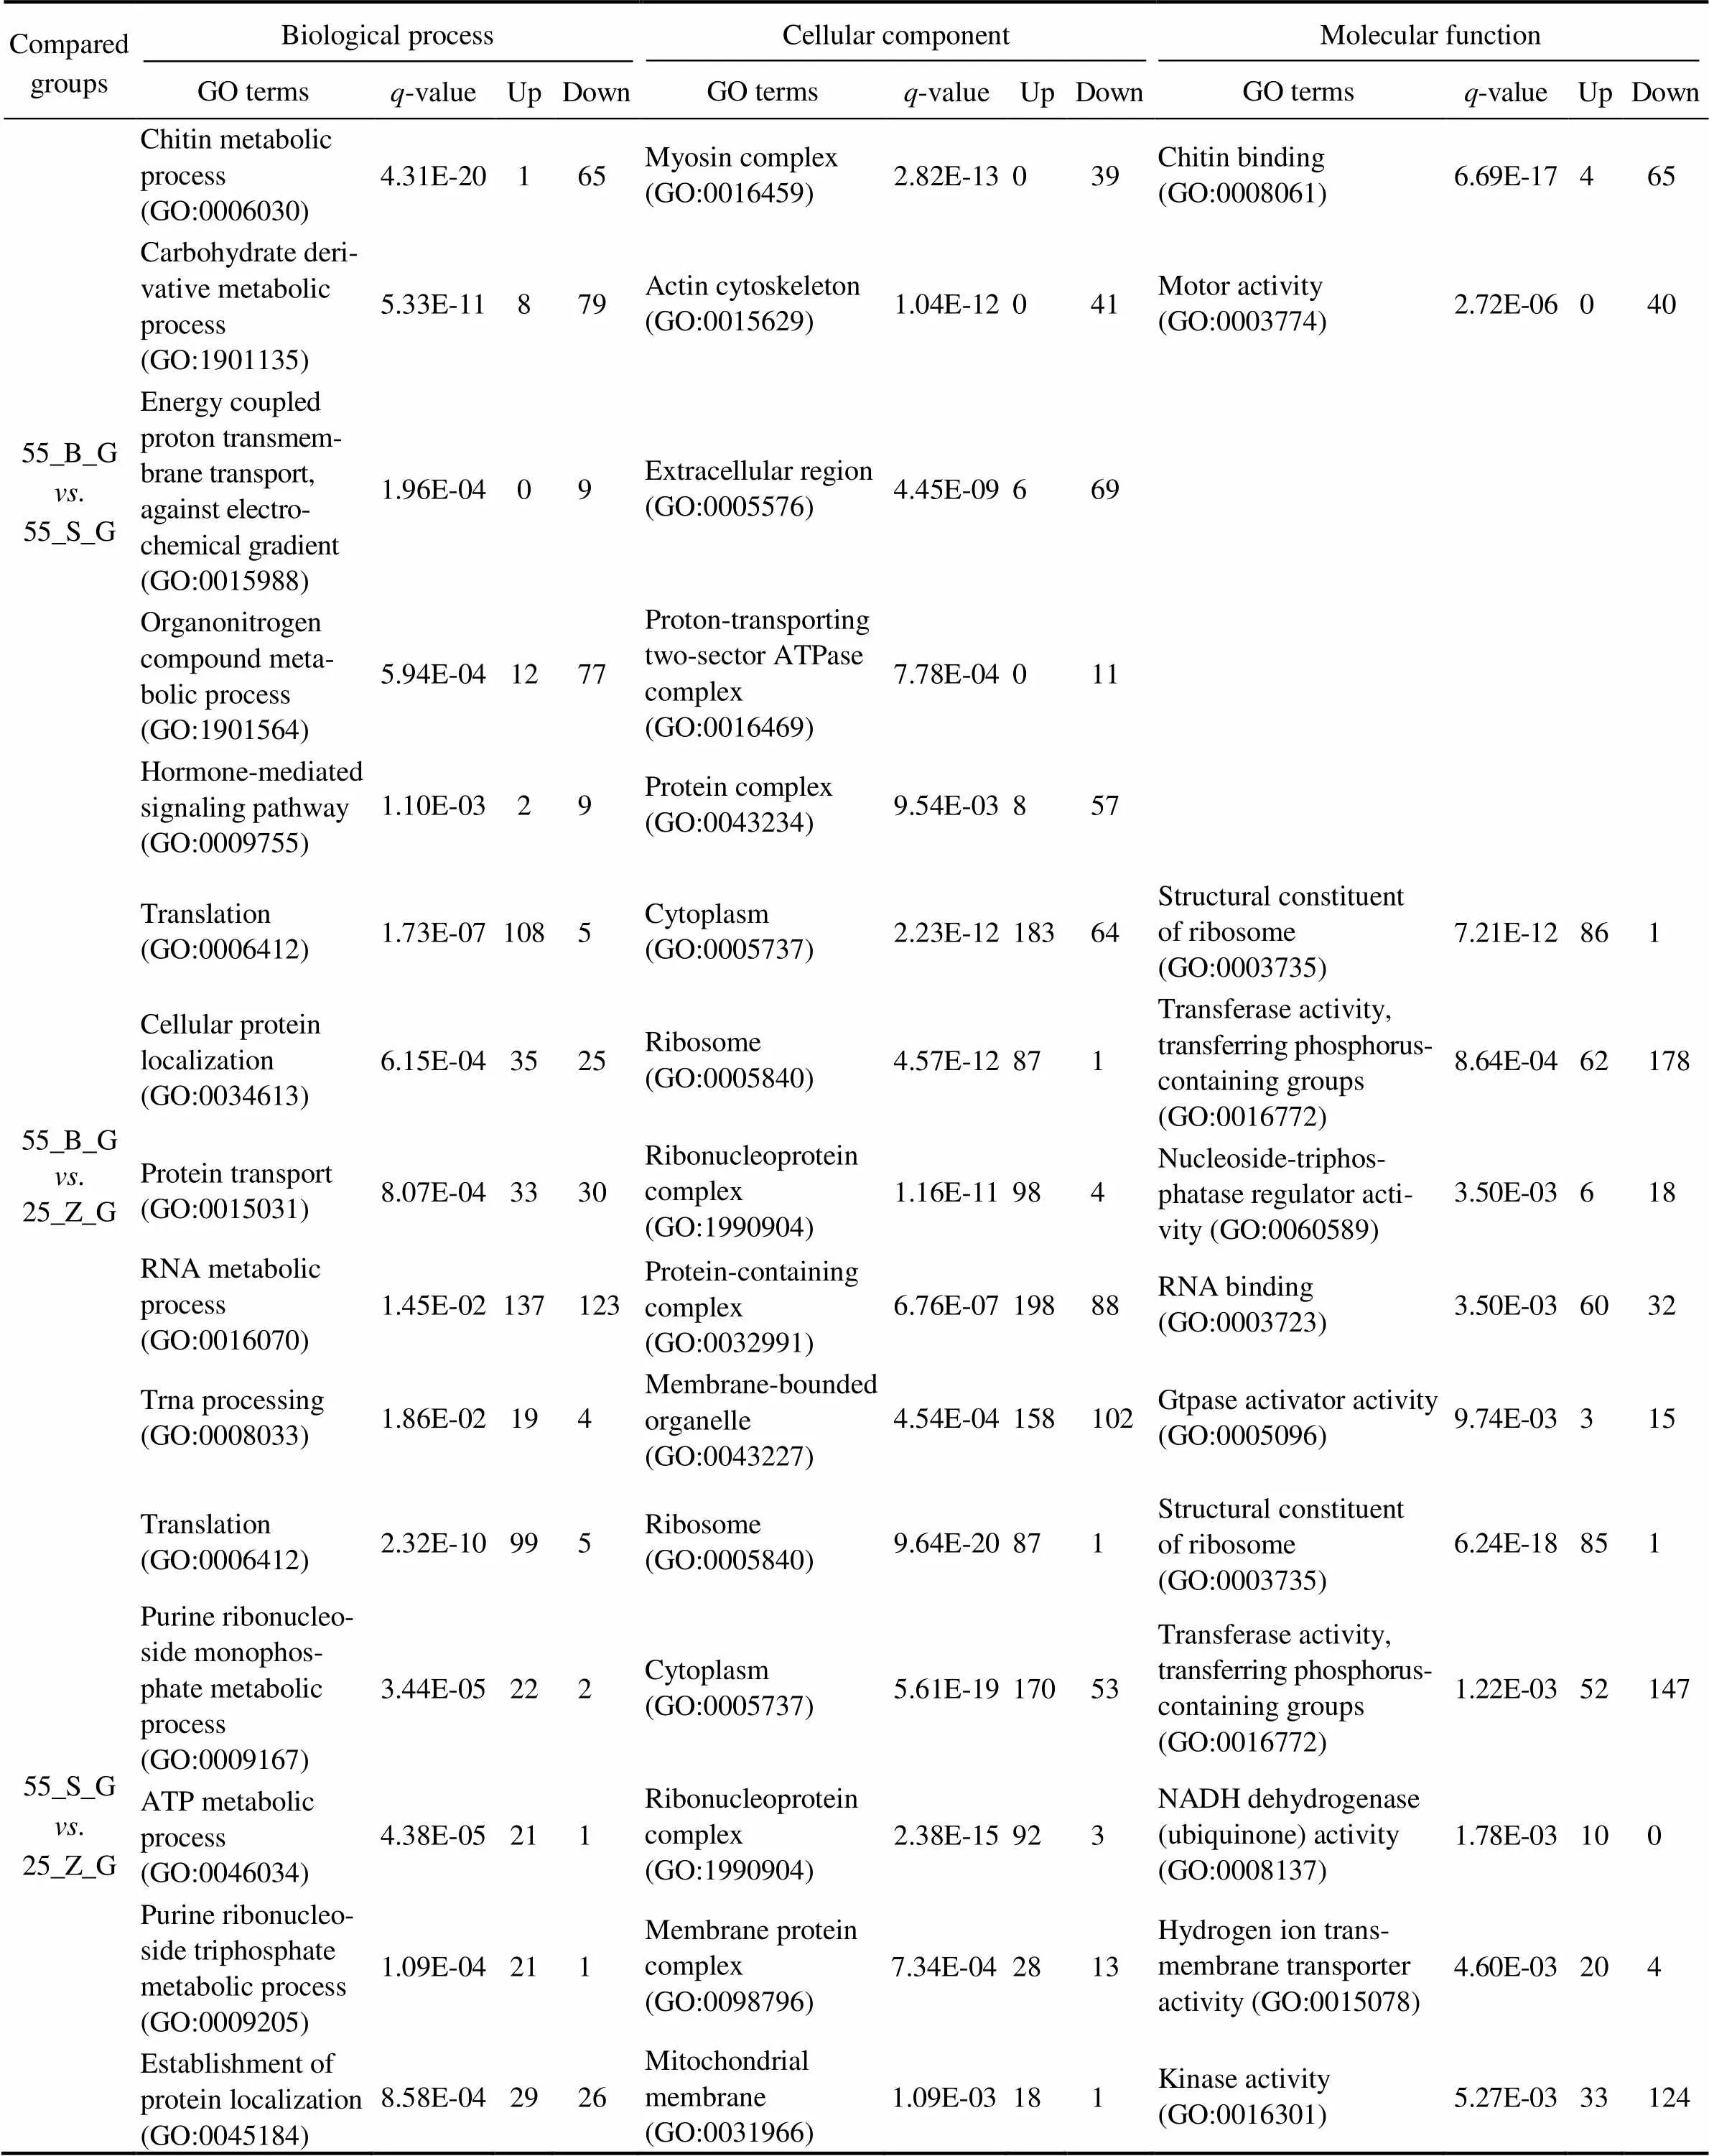
Table 3 The top five most significantly enriched GO terms in gills
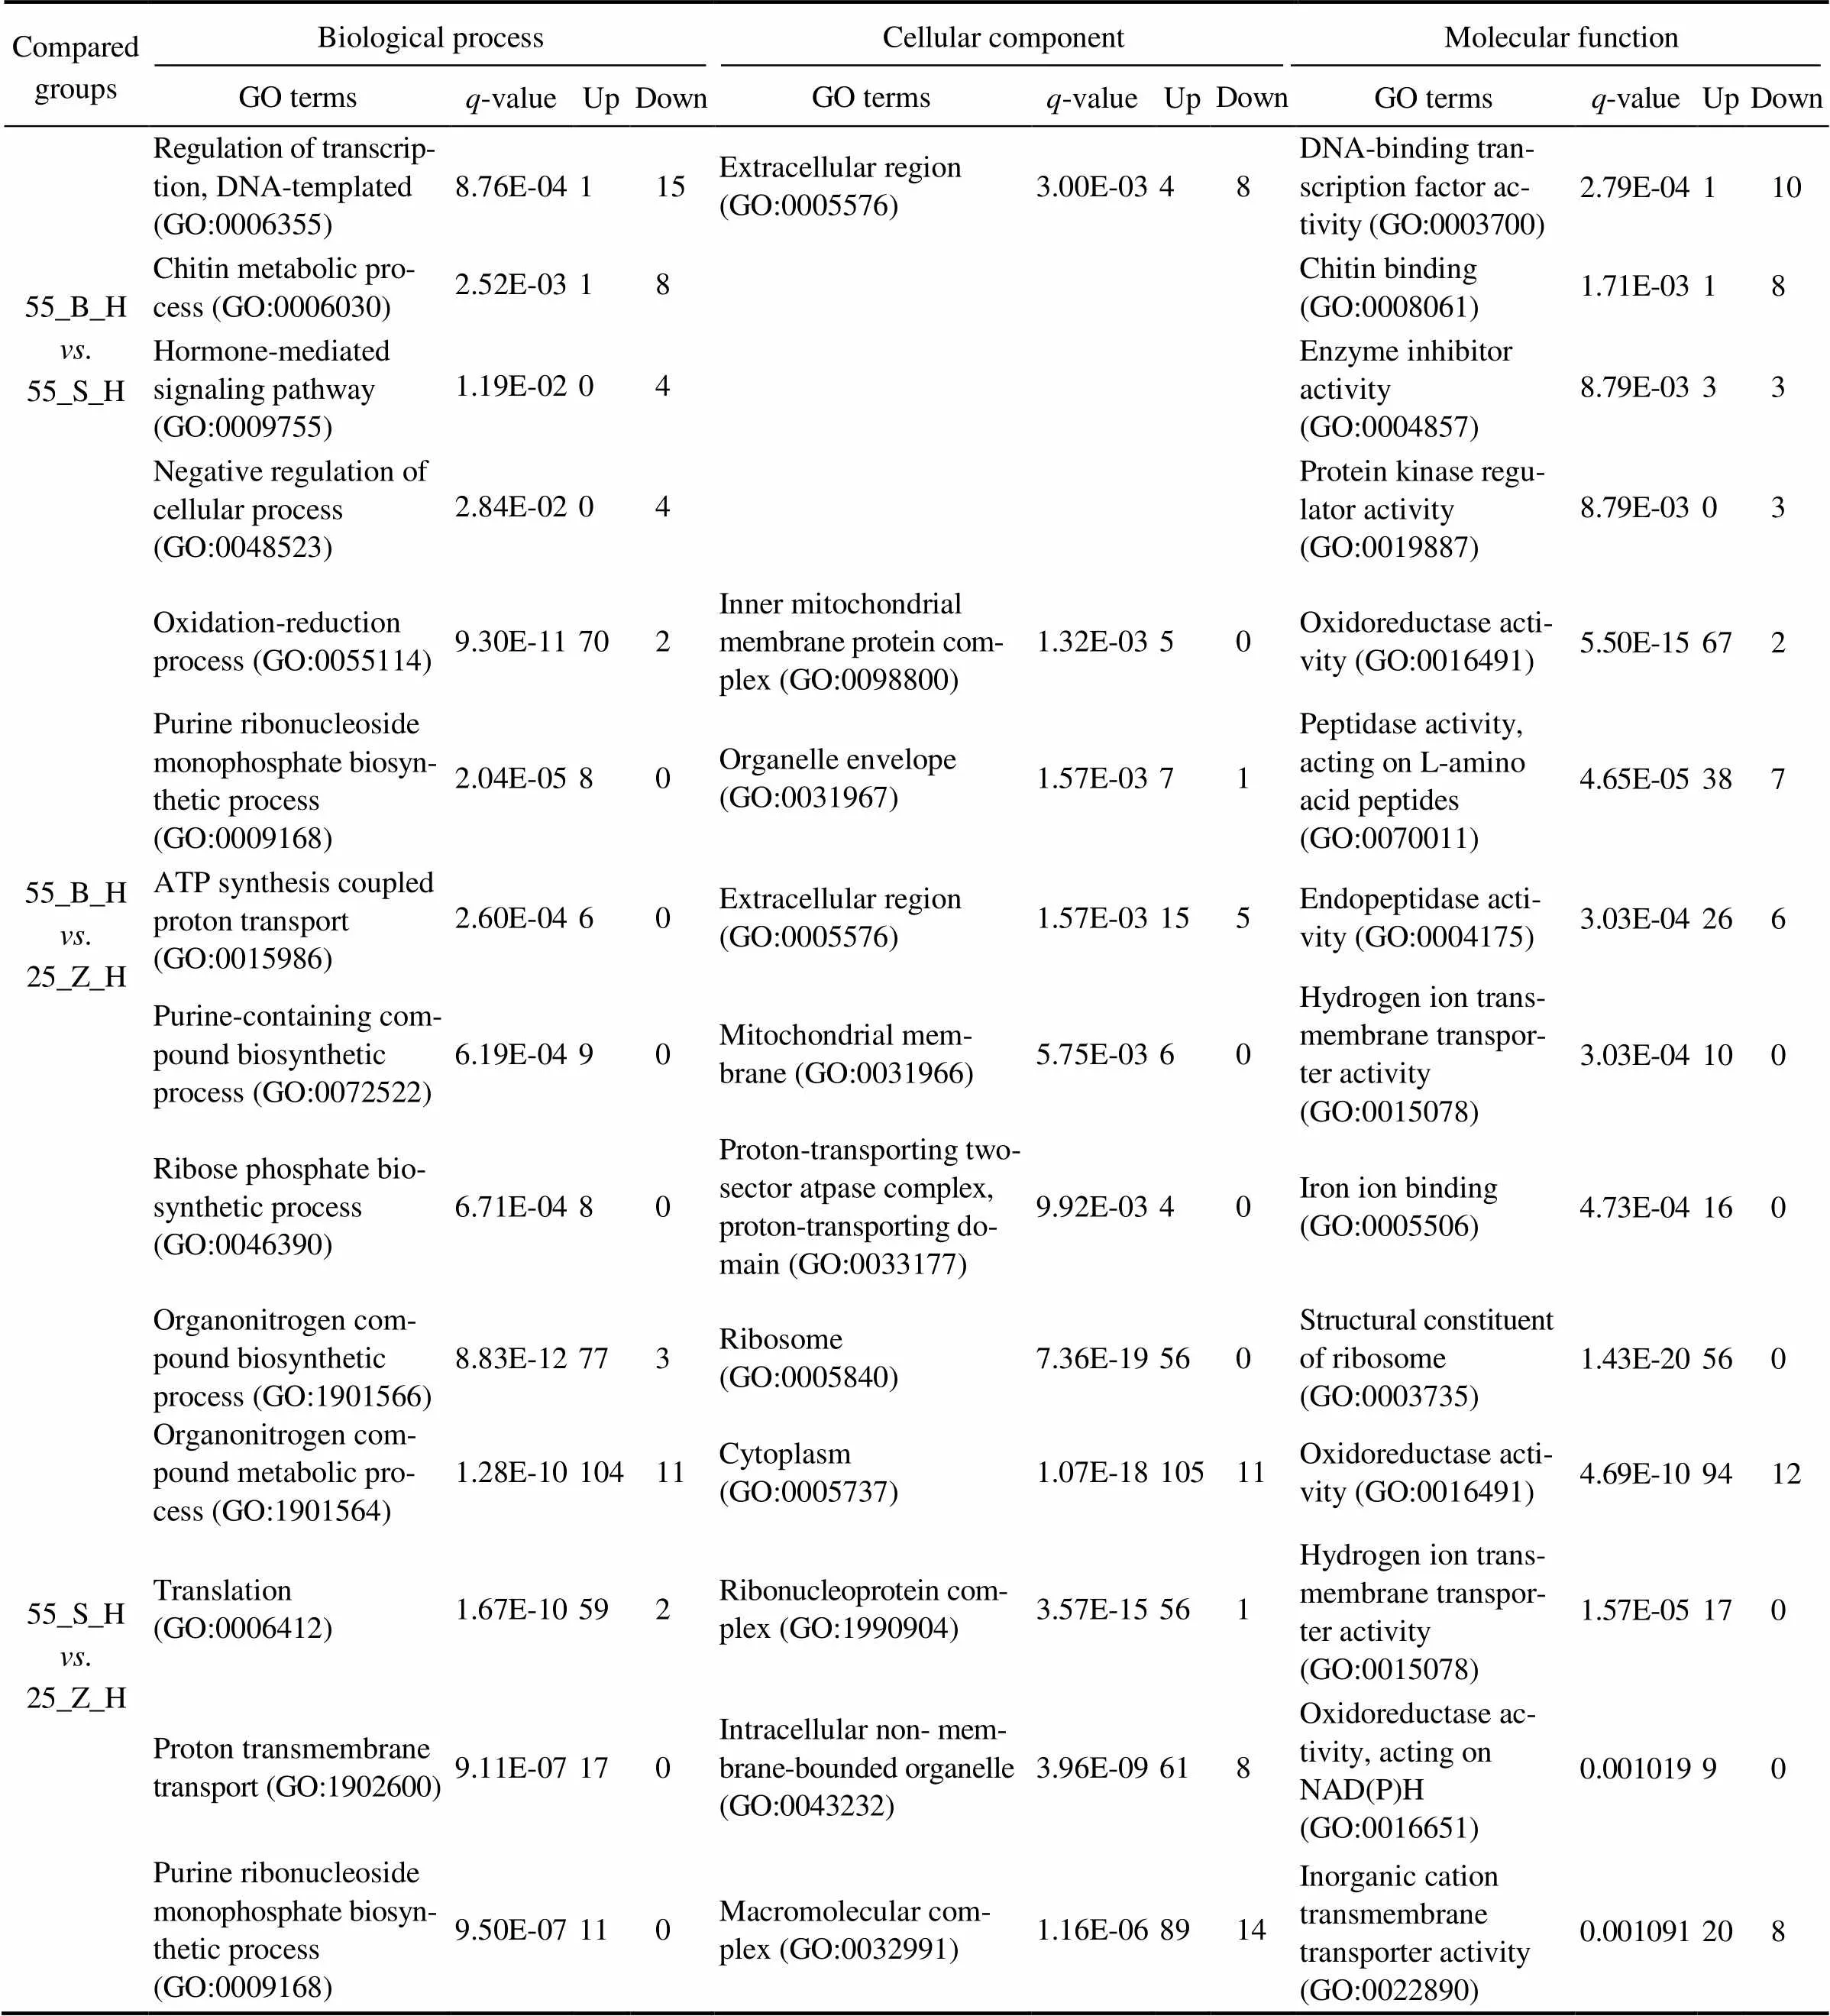
Table 4 The top five most significantly enriched GO terms in hepatopancreas

Table 5 The significantly enriched KEGG pathways in gills
()
()

ComparedgroupUp-regulated pathwaysDown-regulated pathways KEGG IDDescriptionpadjKEGG IDDescriptionpadj 55_B_G vs. 25_Z_Gdme03020RNA polymerase8.67E-03dme04144Endocytosis6.74E-05 dme03030DNA replication1.17E-02dme04013MAPK signaling pathway-fly6.43E-04 dme04070Phosphatidylinositol signaling system1.25E-02 dme03010Ribosome9.29E-41dme04013MAPK signaling pathway-fly5.84E-04 55_S_G vs. 25_Z_Gdme00190Oxidative phosphorylation1.67E-21dme04144Endocytosis1.17E-03 dme01200Carbon metabolism6.57E-04dme04391Hippo signaling pathway-fly1.17E-03 dme00020Citrate cycle (TCA cycle)1.51E-02dme04070Phosphatidylinositol signaling system1.49E-02 dme03060Protein export2.31E-02dme04350TGF-beta signaling pathway1.50E-02 dme00562Inositol phosphate metabolism2.66E-02

Table 6 The significantly upregulated KEGG pathways in hepatopancreas
3.6 Validation of Selected DEGs’ Expressions by qPCR
Nine DEGs related to osmoregulation, digestive enzy-mes, molting, and immunity were selected to validate the differential expression of the genes by qPCR analysis. The melting-curve analysis confirmed a single specific ampli- con for all the tested genes. Fold changes from the qPCR data were compared with the results of the differential ex- pression analysis (Fig.3). Overall, the differential expres- sion of these genes was confirmed by the qPCR analysis, indicating the reliability and accuracy of our differential ex- pression analysis.
4 Discussion
In this work, shrimps maintained at 25 salinity (control) showed better growth performance than those maintained at 55 salinity. Li(2017a) reported the optimal sali- nity for growth and survival ofwas 20–25.In addition, 25 salinity was also similar to the salinity of the farming ponds. Therefore, we chose 25 as the control salinity. A previous experiment in our laboratory also re- vealed that the relative weight gain rate and specific growth rate ofdecrease with an increase in salinity from 30 to 60 and the survival rate of the shrimp is lower than 40% at the salinity of 60 (Li., 2017b). Therefore, we selected 55 as the treatment salinity to obtain better comparative effects in our study. This finding in agreementwith some research on optimal salinity conditions forgrowth. Huang (1983) reported thatgrows best at about 20 salinity and poorliest at both 5 and 45. Similarly, according to Bray. (1994), shrimpscultivated at 5 and 15 salinities exhibit a significantly high-er growth rate than those at any other concentrations tested,and the shrimps in hypersaline water (49) show significant- ly slower growth than those in the low-salinity treatment groups. Nevertheless, in the present work, some shrimps grew well at 55. The final weight of these shrimps (the 55_B subgroup) was not significantly lower than that in the con- trol group (the 25_Z group), while it was clearly higher relative to the other shrimps maintained at 55 salinity (the 55_S subgroup) (Fig.1).
4.1 Growth Performance of Shrimp at High Salinity Is Unrelated to Osmoregulation
Both gill and hepatopancreas tissues ofre- sponded significantly to prolonged high-salinity exposure, thoughdifferent patterns. The number of DEGs in the gill tissues greatly exceeded that in the hepatopancreas tis- sues (Fig.2). This result may be attributed to the direct en- vironmental exposure of the gill, an organ that plays a con- siderable role in the control of osmotic pressure and ion exchange (Freire., 2008; Mcnamaraand Faria, 2012; Li., 2014). During the high-salinity challenge in this study, the gill was demonstrated to be more responsiblefor ensuring homeostasis in the shrimps in comparison with the hepatopancreas. Furthermore, more DEGs were iden- tified in the gill tissues than hepatopancreas tissues in the comparison of shrimps at different salinity levels (Fig.2). Functional analysis of these DEGs suggests that several GO terms and KEGG pathways such as signaling-asso- ciated pathways in the gills are enriched in the DEG set of shrimps maintained at 55 salinity when compared with the control (25 salinity) (Table 5). Apparently, once the gills de- tected an increase in salinity, this stimulus was transform- ed into stress signals and transmitted to other parts of the body, thereby initiating the regulatory mechanism used by the gills. Some transcriptomic studies have revealed thatthese signal transduction pathways also perform important functions in response to low-salinity stress in the gills of(Hu., 2015; Wang., 2015) and(Wang., 2018). Therefore, the pa- thways enriched in the DEG set of shrimps at 55 salinity may be related to adaptation to high-salinity stress.
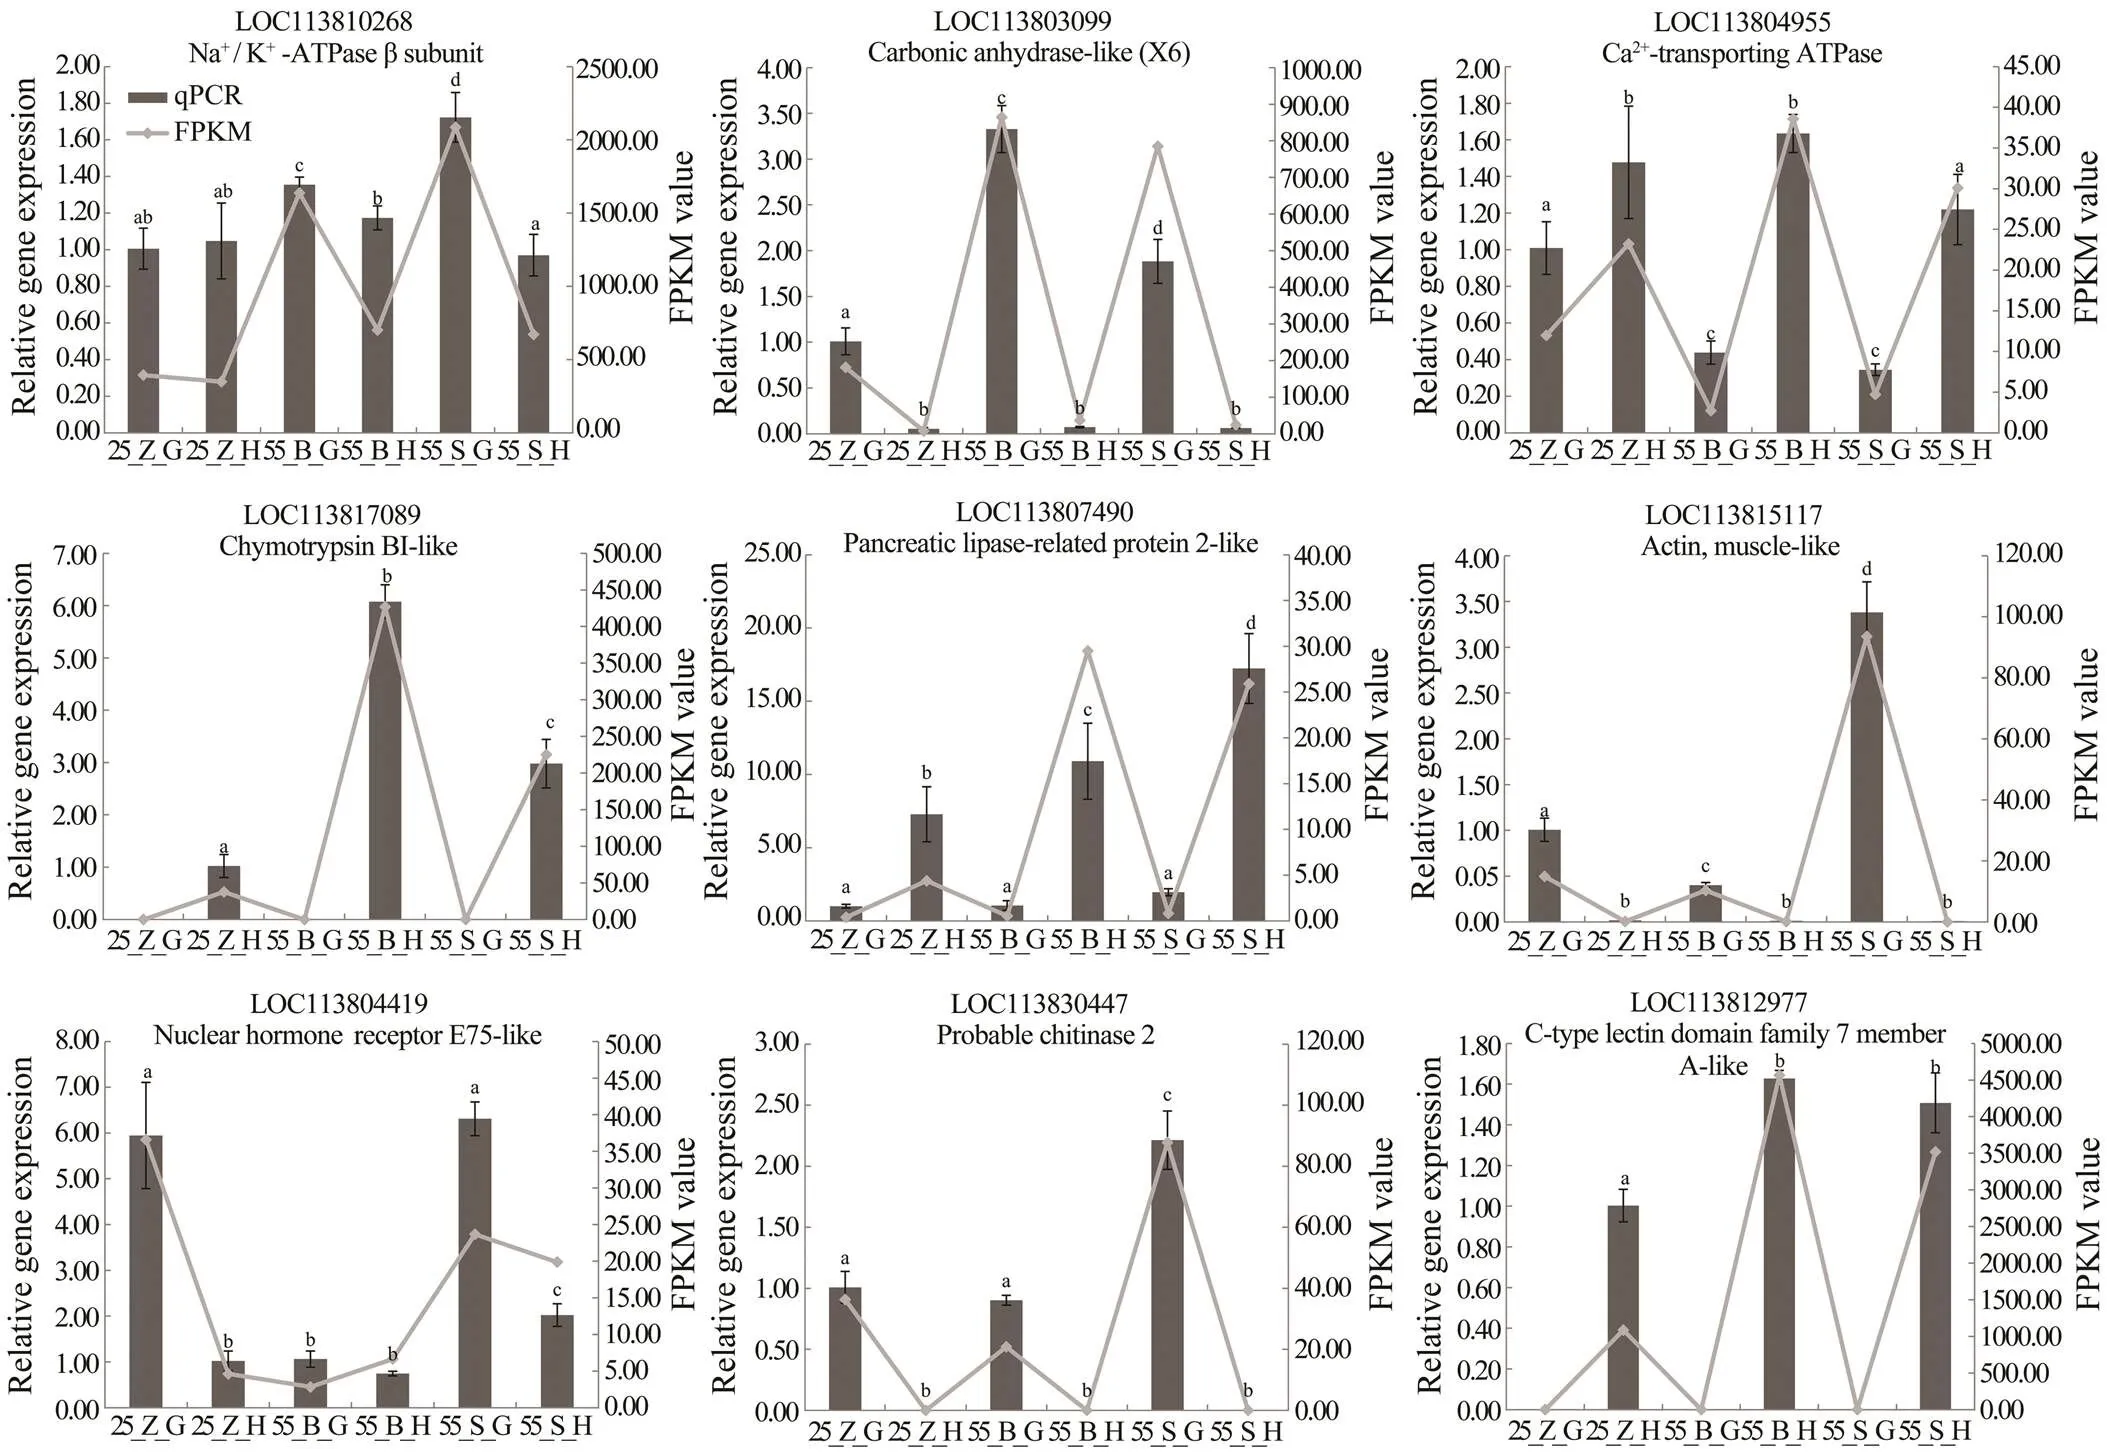
Fig.3 qPCR validation of RNA-seq data. Nine genes were selected for validation. X axis represents the groups. Columns and bars represent the means and standard error of relative expression levels from qPCR results (Y axis at left). Lines represent the FPKM value from transcriptome results (Y axis at right). Values with different superscripts indicated statistical significance (P<0.05), which were calculated via one-way ANOVA.
Similar to the above results obtained in the gills, GO terms and KEGG pathways associated with oxidation re- sistance, energy metabolism, fatty acid metabolism, and ami- no acid metabolism are upregulated in the hepatopancreas of the shrimp maintained at 55 salinity (Table 4, Table 6). In aquatic animals, alterations in salinity can elicit various physiological responses, such as elevation of plasma hor- mone levels, accelerated metabolism, and electrolyte dis- equilibrium due to the overproduction of reactive oxygen species (ROS) caused by salinity stress (Liu., 2007). Under oxidative stress, the elevated concentrations of ROS,which are a noxious product of aerobic metabolism, can da-mage cellular constituents (Lushchak, 2011). Therefore, up- regulation of a gene associated with ‘oxidoreductase acti-vity’ may safeguard the shrimp from the high level of ROSor related hazardous substances produced by oxidative stress induced by the high-salinity challenge in. Moreover, osmoregulation is an energy consuming pro- cess, which involves the hepatopancreas for provision of the required energy. Consequently, the upregulated energy metabolism-associated pathways may supply extra energy for osmoregulation in the shrimp, as reported in other tran-scriptomic research articles on(Hu., 2015; Wang., 2015) and(Li., 2014) subjected to a salinity challenge. Additionally, the upregu- lated ‘fatty acid elongation’ (dme00062) and ‘fatty acid de- gradation’ (dme00071) pathways may take part in a nega- tive feedback loop by adjusting the permeability of the gillmembrane. This approach can be a highly effective way to reduce ion diffusion and water afflux as opposed to exclu- sive use of ion transport mechanisms that are more en- ergy-consuming. Similar results have been reported in tran- scriptomic and proteomic researches onunder low-salinity stress (Chen., 2015; Wang., 2015; Xu., 2017). The previous findings suggest that these amino acid metabolism pathways may participate in the regulationof free amino acids, which contribute to osmoregulation ca- pacity in crustaceans when ambient salinity changes (Lv., 2013; Li., 2014; Wang., 2015; Xu., 2017; Wang., 2018). Moreover, an increase in the a-mount of total free amino acids has been detected inand other crustaceans after exposure to highsalinity (Huong., 2001; Silvia., 2004; Koyama., 2018; Liu., 2018). Therefore, the upregulated GO terms and KEGG pathways in the shrimps at 55 salinity can be impli- cated in the osmoregulation driven by the hepatopancreas.
On the whole, our functional analyses revealed streng- thened osmoregulation in the shrimps at high ambient sa- linity. Of note, the enriched GO terms and KEGG path-ways are similar between the two shrimp subgroups main- tained at high salinity. These similarities suggest that their growth rates are independent of osmoregulation.
We also identified differential expression of ion trans- port enzymes and proteins, such as NKA, V-ATPase sub- unita, CA, and aquaporins (AQPs) (Table 7). NKA is im- portant for the regulation of hematopoietic osmotic pres- sure at different salinity levels (Castilho., 2001), whe- reas V-ATPase is responsible for maintaining acid-base ba- lance and nitrogen excretion. Several reports indicate that gene expression levels of NKA α-subunit and a V-ATPase subunit are highly up-regulated during salinity stress (Lu- quet, 2005; Hu., 2015). On the other hand, CA participates in ion transport, acid-base balance, and pH re-gulation by supplying H+and HCO3−through catalyzed hydration of respiratory CO2, which is capable of diffus- ing through the gills (Henry, 1987). CA upregulation has also been identified in crustaceans subjected to a salinity challenge (Pongsomboon., 2009; Pan., 2016; Ge., 2019; Huang., 2019). AQPs help to maintain the balance of cellular osmolality by facilitating the transport of water and some small-molecule solutes across the plas- ma membrane. In crabs such asandand in the shrimp, the osmoregulatory role of AQPs is evidenced by their diffe-rent expressions under salinity stress (Chung., 2012; Lv., 2013; Wang.,2015). The above genes are significantly upregulated or downregulated in our both sub- groups of the shrimp at high salinity, as compared to their expressions in the control group. By contrast, they are not differentially expressed between the two shrimp subgroups with different growth rates at high salinity. These results further support our previous conclusion. Nevertheless, fur- ther study is still required to clarify the correlation between osmoregulation and growth at high salinity.

Table 7 Characterization of DEGs related to osmoregulation in gills
4.2 Functional Analysis of DEGs Related to Growth Performance of Shrimp at High Salinity
In the comparison of gene expression profiles between the 55_B subgroup and 55_S subgroup, several enrichedGO terms, including chitin metabolic process, hormone- mediated signaling pathway, extracellular region, and chi- tin binding, were found to be upregulated in the hepatopan- creas and gills of shrimp in the 55_S subgroup and may affect their growth performance at high salinity (Table 3, Table 4). One study uncovered regulatory roles of chitin metabolic process and extracellular region (GO terms) du- ring molting processes in(Gao., 2017). Accordingly, we hypothesized that the molt-associated pro- cesses may exert important physiological effects on the growth of shrimp at high salinity. Further evidence sup- porting this hypothesis was obtained in the analysis of dif-ferential expression of molt-associated genes in the shrimp at high salinity. Notably, ecdysone receptor and ecdysone response genes are upregulated both in the hepatopancreas and gills in the 55_S subgroup (Table 8). In, the ecdysone function in promoting molting is implement- ed by products of those downstream genes belonging to the ecdysone signaling pathway (Zhang., 2019). In the present study, this overexpression of ecdysone response genes is consistent with their function in the regulation of the expression of downstream effectors such as chitinase (Table 8) and cuticle proteins (Fig.4, Table 8) in the shrimps of the 55_S subgroup. During the molting cycle in crus- taceans, chitinase dissolves chitin in the old exoskeleton into more soluble substances, which can then be partially reabsorbed into the body and utilized to synthesize the new exoskeleton (Huang., 2010). Cuticle proteins are some of the main structural proteins involved in the con- struction of the cuticle during molting (Roer., 2015). In addition to the GO terms common to both organs, my- osin complex and actin cytoskeleton are the most signifi- cantly enriched GO terms in the cellular component cate- gory in the gills in our work. Consistent with this result, a number of genes encoding skelemin-associated proteins, such as actin, myosin, and troponin, are markedly upregu- lated in the gills of 55_S shrimps as well (Fig.5).
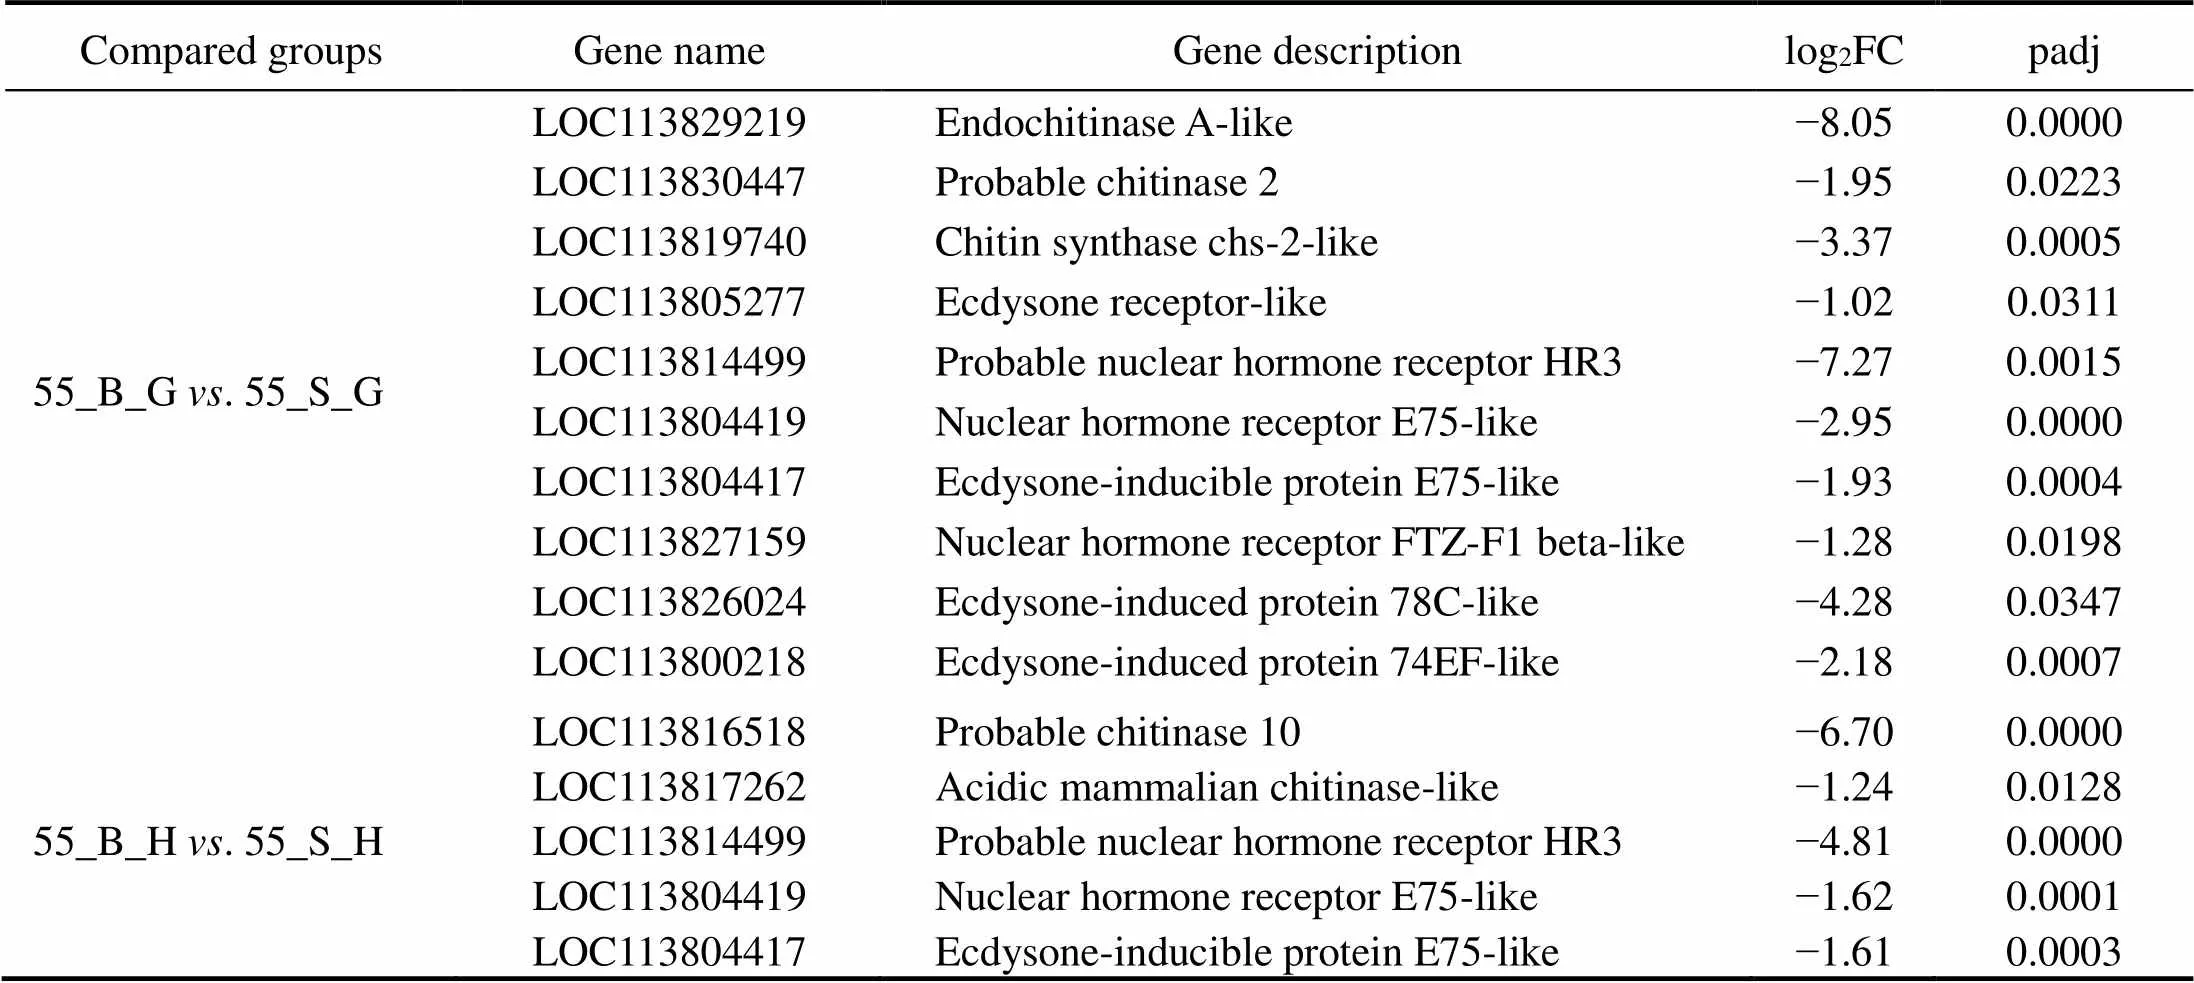
Table 8 The DEGs related to ecdysis in the shrimps at high salinity
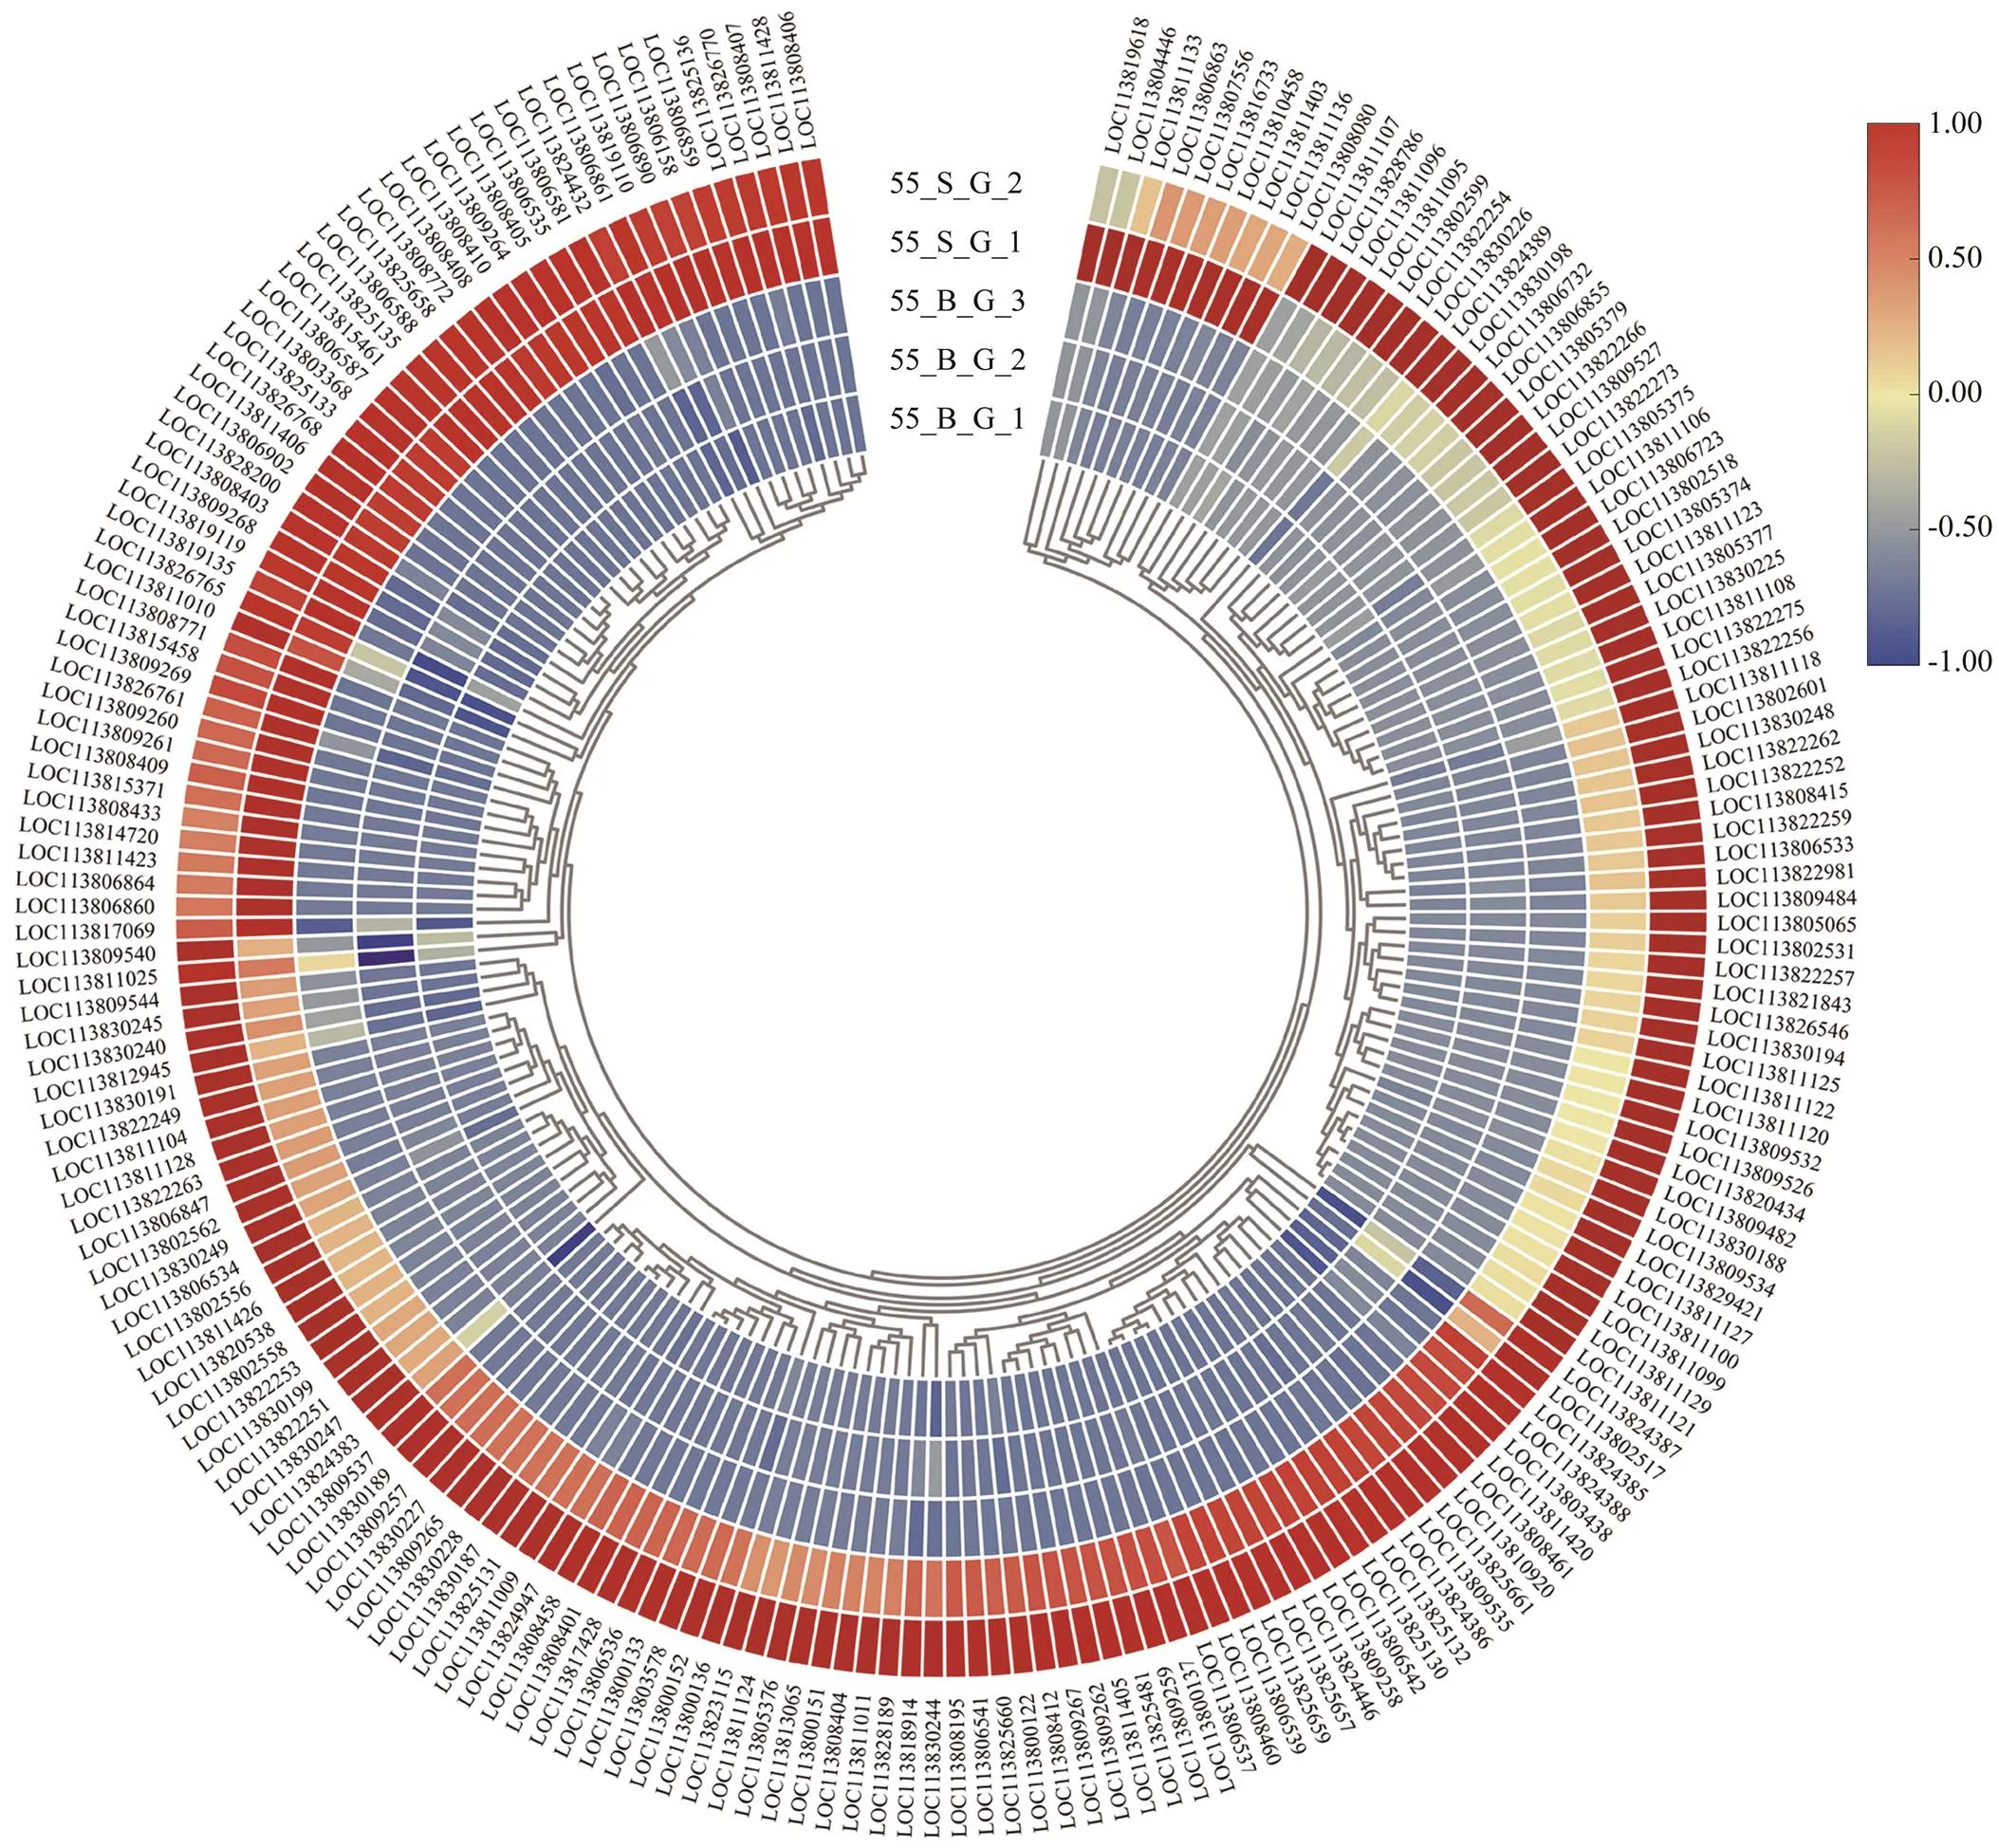
Fig.4 Expression profiles of genes of cuticle protein in the gills of shrimps at high salinity. The heatmap was drawn by TBtools (Chen et al., 2020). Colors represent relative mRNA expression as indicated in the color key. The red color shows high expression, and the blue color represents lower levels of expression. The color from red to blue represents the log2(FPKM+1) from large to small.
Skelemin is important for body reconstruction after mol- ting (Hooper and Thuma, 2005). At the postmolt stage, ra- pid enlargement and growth of shrimp entail not only ac- celerated water absorption but also skeleton expansion to provide a scaffold and muscle to fill the new body (Relaix and Zammit, 2012). One study uncovered increased ex- pression of genes related to actin, myosin, and troponin inafter molting (Gao., 2015).
Given that molting is a complex process, investigation was focused, for example, on the quantitation of circulat- ing ecdysteroid concentration, molting frequency, and hor- mone levels must be conducted to further clarify the cor- relation between growth performance and molt-associated processes in the shrimps at high salinity.
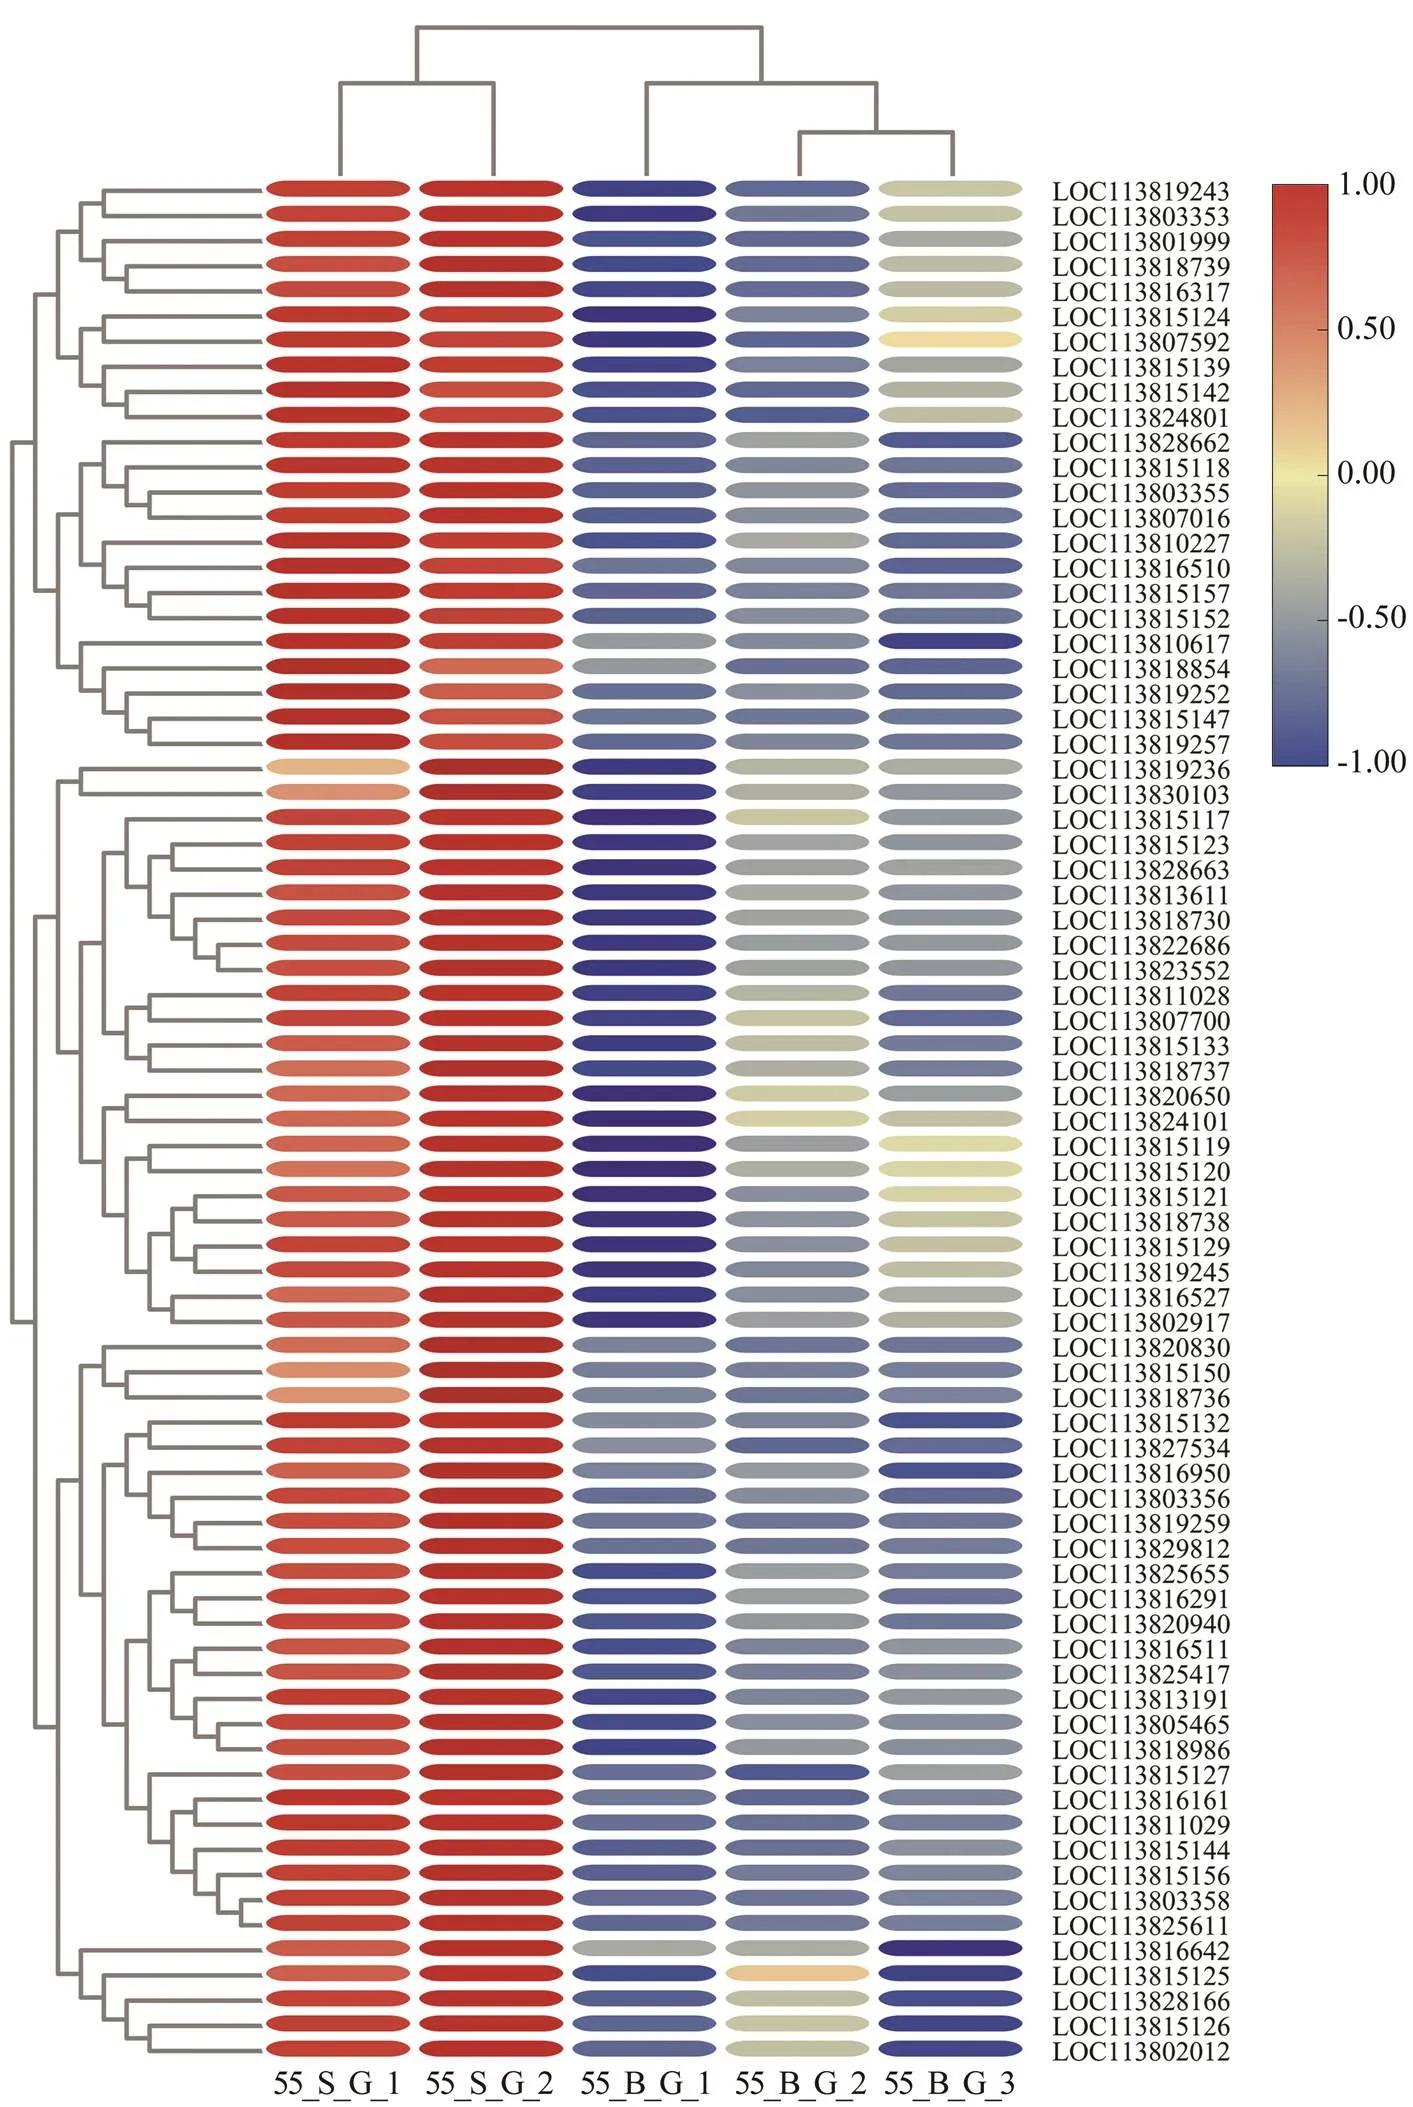
Fig.5 Expression profiles of skelemin-related genes in the gills of shrimps at high salinity. The heatmap was drawn byTBtools (Chen et al., 2020). Colors represent relative mRNA expression: the red color shows high expression; the blue color represents lower levels of expression; the color from red to blue represents the log2(FPKM+1) from large to small.
5 Conclusions
Growth performance of some shrimps at the high sali- nity of 55 was comparable to that of shrimps cultivated at the control salinity of 25. Furthermore, we examined trans- criptomic changes in the gills and hepatopancreasof the shrimps having significantly different final weights in the treatment group, as compared to the control group. In the comparisons of gene expression, numerous genes were found to be regulated by high-salinity stress. These data may help to understand the molecular basis of osmoregu- lation in. By contrast, salinity adaptation-as- sociated GO terms and KEGG pathways were enriched si- milarly in the two subgroups of shrimps at high salinity, compared to that in the shrimps at control salinity, sug- gesting that the growth rate of shrimps at high salinity is independent of osmoregulation. Moreover, a substantial number of ecdysone response genes and downstream genes are upregulated in the gills and hepatopancreas of the slow- growing shrimps, thereby providing insights into the mo- lecular mechanism by which the molt-associated processes may play a role in the regulation of shrimp growth at high salinity.
Acknowledgements
The work was supported by the National Natural Sci- ence Foundation of China (No. 31802269), the Open Fund of Shandong Key Laboratory of Disease Control in Mari- culture (No. KF201901), the Shrimp & Crab Innovation Team of Shandong Agriculture Research System (No. SD AIT-15-011), the High-Level Talent Research Fund of Qing- dao Agricultural University (Nos. 663/1119054 and 663/ 1120027), and the First Class Fishery Discipline Program in Shandong Province.
Álvarez-Ruiz, P., Luna-González, A., Escamilla-Montes, R., Me- jía-Ruiz, C. H., Magallón-Barajas, F. J., Llera-Herrera, R.,., 2015. Longlasting effect against white spot syndrome virus in shrimp broodstock,, by LvRab7 silen- cing., 46 (6): 571- 582, DOI: 10.1111/jwas.12236.
Bray, W.A., Lawrence, A.L., and Leung-Trujillo, J.R., 1994. The effect of salinity on growth and survival of, with observation on interaction of IHHN virus and salinity., 122: 133-146, DOI: 10.1016/0044-8486(94)90505-3.
Castilho, P.C., Martins, I.A., and Bianchini, A., 2001. Gill Na+,K+-ATPase and osmoregulation in the estuarine crab,Dana, 1851 (Decapoda, Grapsidae)., 256 (2): 215-227, DOI: 10.1016/S0022-0981(00)00315-4.
Charmantier, G., and Charmantier-Daures, M., 2001. Ontogeny of osmoregulation in crustaceans: The embryonic phase., 41 (5): 1078-1089, DOI: 10.1093/icb/41.5.1078.
Charmantier, G., Charmantier-Daures, M., and Towle, D., 2008.. CRC Press, Boca Raton, 165-230.
Chen, C. J., Chen, H., Zhang, Y., Thomas, H. R., Frank, M. H., He, Y. H.,., 2020. TBtools: An integrative toolkit deve- loped for interactive analyses of big biological data., 13 (8): 1194-1202, DOI: 10.1016/j.molp.2020.06.009.
Chen, K., Li, E., Li, T., Xu, C., Wang, X., Lin, H.,., 2015. Transcriptome and molecular pathway analysis of the hepato- pancreas in the Pacific white shrimpunder chronic low-salinity stress., 10 (7): e0131503, DOI: 10.1371/journal.pone.0131503.
Chung, J.S., Maurer, L., Bratcher, M., Pitula, J.S., and Ogburn, M.B., 2012. Cloning of aquaporin-1 of the blue crab,: Its expression during the larval development in hyposalinity., 8 (1): 21, DOI: 10.1186/2046-9063-8-21.
Freire, C., Onken, H., and Mcnamara, J., 2008. A structure-func- tion analysis of ion transport in crustacean gills and excretory organs., 151 (3): 272-304, DOI: 10.1016/j. cbpa.2007.05.008.
Galindo-Torres, P. E., Ventura-López, C., Llera-Herrera, R., and Ibarra,A. M., 2019. A natural antisense transcript of the fem-1 gene was found expressed in female gonads during the char- acterization, expression profile, and cellular localization of the fem-1 gene in Pacific white shrimp., 706: 19-31, DOI: 10.1016/j.gene.2019.04.066.
Gao, Y., Wei, J., Yuan, J., Zhang, X., Li, F., and Xiang, J., 2017 Transcriptome analysis on the exoskeleton formation in early developmetal stages and reconstruction scenario in growth-moulting in., 7 (1): 1098, DOI: 10.1038/s41598-017-01220-6.
Gao, Y., Zhang, X., Wei, J., Sun, X., Yuan, J., Li, F.,., 2015. Whole transcriptome analysis provides insights into molecu- lar mechanisms for molting in, 10 (12): e0144350, DOI: 10.1371/journal.pone.0144350.
Ge, Q., Li, J., Wang, J., Li, Z., and Li, J., 2019. Characterization, functional analysis, and expression levels of three carbonic anhydrases in response to pH and saline-alkaline stresses in the ridgetail white prawn., 24 (3): 503-515, DOI: 10.1007/s12192-019-00987-z.
Gibson, R., and Barker, P.L., 1979. The decapod hepatopancreas., 17 (17): 285-346.
Henry, R. P., 1987. Membrane-associated carbonic anhydrase in gills of the blue crab,., 252: R966-71, DOI: 10.1152/ajpregu.1987.252.5. R966.
Hooper, S.L., and Thuma, J.B., 2005. Invertebrate muscles: Mu- scle specific genes and proteins., 85: 1001-1060, DOI: 10.1152/physrev.00019.2004.
Hu, D., Pan, L., Zhao, Q., and Ren, Q., 2015. Transcriptomic re- sponse to low salinity stress in gills of the Pacific white shrimp,., 3: 297-304, DOI: 10.1016/j.margen.2015.07.003.
Huang, H.J., 1983. Factors affecting the successful culture ofandat an estuarine power plant site: Temperature, salinity, inherent growth variability, damselfly nymph redation, population density and distribu- tion, and polyculture. PhD thesis. Texas A&M University.
Huang, Q.S., Yan, J.H., Tang, J.Y., Tao, Y.M., Xie, X.L., Wang, H.,., 2010. Cloning and tissue expressions of seven chi- tinase family genes in., 29: 75-81, DOI: 10.1016/j.fsi.2010.02.014.
Huang, Y., Liu, Z., Li, Y., Wu, D., Zhang, M., and Zhao, Y., 2019. Cloning and characterisation of Na+/K+-ATPase and carbonic anhydrase from oriental river prawn., 129: 809-817, DOI: 10.1016/j.ijbiomac.2019.02.098.
Huong, D.T.T., Yang, W.J., Okuno, A., and Wilder, M.N., 2001. Changes in free amino acids in the hemolymph of giant fresh- water prawnexposed to varying salinities: Relationship to osmoregulatory ability., 128: 317-326, DOI: 10.1016/s1095-6433(00)00310-x.
Kim, D., Langmead, B., and Salzberg, S.L., 2015. Hisat: A fast spliced aligner with low memory requirements., 12 (4): 357-360, DOI: 10.1038/nmeth.3317.
Koyama, H., Mizusawa, N., Hoashi, M., Tan, E., Yasumoto, K., Jimbo,M.,., 2018.Changes in free amino acid concen- trations and associated gene expression profiles in the abdo- minal muscle of kuruma shrimp () acclimated at different salinities., 221: jeb168997, DOI: 10.1242/jeb.168997.
Kumaran, M., Anand, P.R., Kumar, J.A., Ravisankar, T., Paul, J., Vimala, D.D.,., 2017. Is Pacific white shrimp () farming in India is technically efficient?–A comprehensive study., 468: 262-270, DOI: 10.1016/j.aquaculture.2016.10.019.
Lago-Lestón, A., Ponce, E., and Munoz, M.E., 2007. Cloning and expression of hyperglycemic (CHH) and moltinhibiting (MIH) hormones mRNAs from the eyestalk of shrimps ofgrown in different temperature and sali- nity conditions., 270: 343-357, DOI: 10.1016/j.aquaculture.2007.04.014.
Leone, F.A., Lucena, M.N., Garçon, D.P., Pinto, M.R., and Mc-Namara, J.C., 2017.. Springer, Switzerland, 61-107.
Li, C., Li, N., Dong, T., Fu, Q., Cui, Y., and Li, Y., 2020. Ana- lysis of differential gene expression inunder high salinity stress., 18: 100423, DOI: 10.1016/j.aqrep.2020.100423.
Li, E., Wang, X., Chen, K., Xu, C., Qin, J. G., and Chen, L., 2017a.Physiological change and nutritional requirement of Pacific white shrimpat low salinity., 9 (1): 57-75, DOI: 10.1111/raq.12104.
Li, E.C., Arena, L., Chen, L.Q., Qin, J.G., and Wormhoudt, A.V., 2009. Characterization and tissue-specific expression of the two glutamate dehydrogenase cDNAs in Pacific white shrimp,., 29 (3): 379-386, DOI: 10.1651/08-3104.1.
Li, E.C., Arena, L., Lizama, G., Gaxiola, G., Cuzon, G., Rosas, C.,., 2011. Glutamate dehydrogenase and Na+-K+ATPase expression and growth response ofto different salinities and dietary protein levels., 29: 343-349, DOI: 10.1007/s00343-011-0093-8.
Li, E.C., Wang, S.L., Li, C., Wang, X.D., Chen, K., and Chen, L.Q., 2014. Transcriptome sequencing revealed the genes and pathways involved in salinity stress of Chinese mitten crab,., 46: 177-190, DOI: 10.1152/physiolgenomics.00191.2013.
Li, N., Wang, R.J., Zhao, Y.C., Shen, M.,Su, W., Zhao, C.,., 2017b. Effects of high salinity on growth index, plasma os- motic pressure and Na+-K+-ATPase activities of., 36: 196-201 (in Chinese with English abstract).
Liu, M., Liu, S., Hu, Y., and Pan, L., 2015. Cloning and expres- sion analysis of two carbonic anhydrase genes in white shrimp, induced by pH and salinity stresses., 448: 391-400, DOI: 10.1016/j.aquaculture.2015.04.038.
Liu, Y., Wang, W.N., Wang, A.L., Wang, J.M., and Sun, R.Y., 2007. Effects of dietary vitamin E supplementation on anti- oxidant enzyme activities in(Boone, 1931) exposed to acute salinity changes., 265: 351-358, DOI: 10.1016/j.aquaculture.2007.02.010.
Liu, Z., Zhou, Z., Wang, L., Li, M., Wang, W., Yi, Q.,., 2018. Dopamine and serotonin modulate free amino acids produc- tion and Na+/K+pump activity in Chinese mitten crabunder acute salinity stress., 9: 1080, DOI: 10.3389/fphys.2018.01080.
Livak, K.J., and Schmittgen, T.D., 2001. Analysis of relative gene expression data using real-time quantitative PCR and the 2−ΔΔCTmethod., 25: 402-408, DOI: 10.1006/meth.2001.1262.
Love, M.I., Huber, W., and Anders, S., 2014. Moderated estima- tion of fold change and dispersion for RNA-seq data with DESeq2., 15 (12): 1-21, DOI: 10.1186/s13059-014-0550-8.
Luquet, C.M., Weihrauch, D., Senek, M., and Towle, D.W., 2005. Induction of branchial ion transporter mRNA expression du- ring acclimation to salinity change in the euryhaline crab., 208: 3627-3636, DOI: 10.1242/jeb.01820.
Lushchak, V.I., 2011. Environmentally induced oxidative stress in aquatic animals., 101 (1): 13-30, DOI: 10.1016/j.aquatox.2010.10.006.
Lv, J., Liu, P., Wang, Y., Gao, B., Chen, P., and Li, J., 2013. Tran-scriptome analysis ofin response to salinity stress provides insights into the molecular basis of os- moregulation., 8 (12): e82155, DOI: 10.1371/journal.pone.0082155.
Mcnamara, J.C., and Faria, S.C., 2012. Evolution of osmoregu- latory patterns and gill ion transport mechanisms in the deca- pod Crustacea: A review., 182: 997-1014, DOI: 10.1007/s00360-012-0665-8.
Morris, S., 2001. Neuroendocrine regulation of osmoregulation and the evolution of air-breathing in decapod crustaceans., 204: 979-989.
Navarrete del Toro, M.A., and García-Carreño, F., 2019. The tool- box for protein digestion in decapod crustaceans: A review., 11: 1005-1021, DOI: 10.1111/raq.12276.
Pan, L., Hu, D., Liu, M., Hu, Y., and Liu, S., 2016. Molecular cloning and sequence analysis of two carbonic anhydrase in the swimming craband its expres- sion in response to salinity and pH stress., 576: 347-357, DOI: 10.1016/j.gene.2015.10.049.
Pan, L., Liu, H., and Zhao, Q., 2014. Effect of salinity on the biosynthesis of amines inand the ex- pression of gill related ion transporter genes., 13: 453-459, DOI: 10.1007/s11802-014-2013-y.
Pante, M.J.R., 1990. Influence of environmental stress on the heritability of molting frequency and growth rate of the pe- naeid shrimp,. Master thesis. University of Houston Clear Lake.
Pongsomboon, S., Udomlertpreecha, S., Amparyup, P., Wuthisu- thimethavee, S., and Tassanakajon, A., 2009. Gene expression and activity of carbonic anhydrase in salinity stressed., 152 (2): 225-233, DOI: 10.1016/j.cbpa.2008.10.001.
Ramos-Carreño, S., Valencia-Yáñez, R., Correa-Sandoval, F., Ruíz-García, N., Díaz-Herrera, F., and Giffard-Mena, I., 2014. White spot syndrome virus (WSSV) infection in shrimp () exposed to low and high salinity., 159 (9): 2213-2222, DOI: 10.1007/s00705-014-2052-0.
Relaix, F., and Zammit, P.S., 2012. Satellite cells are essential for skeletal muscle regeneration: The cell on the edge returns centre stage., 139: 2845-2856, DOI: 10.1242/dev.069088.
Roer, R., Abehsera, S., and Sagi, A., 2015. Exoskeletons across the Pancrustacea: Comparative morphology, physiology, bio- chemistry and genetics., 55 (5): 771-791, DOI: 10.1093/icb/icv080.
Romano, N., and Zeng, C., 2012. Osmoregulation in decapod crus- taceans: Implications to aquaculture productivity, methods for potential improvement and interactions with elevated ammo- nia exposure., 334-337: 12-23, DOI: 10.1016/j.aquaculture.2011.12.035.
Saoud, I.P., Davis, D.A., and Rouse, D.B., 2003. Suitability stu-dies of inland well waters forculture., 217: 373-383, DOI: 10.1016/S0044-8486(02)00418-0.
Shen, M., Zhao, Y., Ling, T., Wang, R., Dong, T., Cui, Y.,., 2019. Effects of high-salt abrupt on growth and related en-zyme activities in., 50: 204-209 (in Chinese with English ab-stract).
Shinji, J., Kang, B.J., Okutsu, T., Banzai, K., Ohira, T., Tsutsui, N.,., 2012. Changes in crustacean hyperglycemic hormones in Pacific whiteleg shrimpsubjected to air-exposure and low-salinity stresses.,78: 833-840, DOI: 10.1007/s12562-012-0514-4.
Silvia, G.J., Antonio, U.R.A., Francisco, V.O., and Georgina, H.W., 2004. Ammonia efflux rates and free amino acid levels inpostlarvae during sudden salinity changes., 233: 573-581, DOI: 10.1016/j.aquaculture.2003.09.050.
Tiu, S.H., He, J.G., and Chan, S.M., 2007. The LvCHH-ITP gene of the shrimp () produces a widely ex- pressed putative ion transport peptide (LvITP) for osmo-regu- lation., 396 (2): 226-235, DOI: 10.1016/j.gene.2007.02.027.
Trejo-Flores, J., Luna-González, A., Alvarez-Ruiz, P., Escamilla-Montes, R., Fierro-Coronado, J. A., Peraza-Gomez, V.,., 2018. Immune-related gene expression infed., 46 (4): 756-764, DOI: 10.3856/vol46-issue4-fulltext-13.
Vandesompele, J., De Preter, K., Pattyn, F., Poppe, B., Van Roy, N., De Paepe, A.,., 2002. Accurate normalization of real-time quantitative RT-PCR data by geometric averaging of mul-tiple internal control genes., 3: research0034-1, DOI: 10.1186/gb-2002-3-7-research0034.
Ventura-López, C., Galindo-Torres, P. E., Arcos, F. G., Galindo- Sánchez, C., Racotta, I. S., Escobedo-Fregoso, C.,., 2016. Transcriptomic information from Pacific white shrimp () ovary and eyestalk, and expression pat- terns for genes putatively involved in the reproductive pro- cess., 246: 164-182, DOI: 10.1016/j.ygcen.2016.12.005.
Wang, H., Tang, L., Wei, H., Lu, J., Mu, C., and Wang, C., 2018. Transcriptomic analysis of adaptive mechanisms in response to sudden salinity drop in the mud crab,., 19 (1): 421, DOI: 10.1186/s12864-018-4803-x.
Wang, X.D., Wang, S.F., Li, C., Chen, K., Qin, J.G., Chen, L.Q.,., 2015. Molecular pathway and gene responses of the Pacific white shrimpto acute low sali- nity stress., 34 (3): 1037-1048, DOI: 10.2983/035.034.0330.
Xu, C., Li, E.C., Liu, Y., Wang, X.D., Qin, J.G., and Chen, L.Q., 2017. Comparative proteome analysis of the hepatopancreas from the Pacific white shrimpunder long-term low salinity stress., 162: 1-10, DOI: 10.1016/j.jprot.2017.04.013.
Yang, L., Smyth, G.K., and Wei, S., 2014. Featurecounts: An ef- ficient general purpose program for assigning sequence reads to genomic features., 30 (7): 923-930, DOI: 10. 1093/bioinformatics/btt656.
Yu, G., Wang, L.G., Han, Y., and He, Q.Y., 2012. Clusterprofiler: An R package for comparing biological themes among gene clusters., 16 (5): 284-287, DOI: 10.1089/omi.2011.0118.
Zhang, X., Yuan, J., Sun, Y., Li, S., Gao, Y., Yu, Y.,., 2019. Penaeid shrimp genome provides insights into benthic adapta- tion and frequent molting., 10: 356, DOI: 10.1038/s41467-018-08197-4.
Zhao, Q., Pan, L., Ren, Q., and Hu, D., 2015. Digital gene expres-sion analysis in hemocytes of the white shrimpin response to low salinity stress., 42 (2): 400-407, DOI: 10.1016/j.fsi.2014.11.020.
Zhao, S., and Fernald, R.D., 2005. Comprehensive algorithm forquantitative real-time polymerase chain reaction., 12 (8): 1047-1064, DOI: 10.1089/cmb.2005.12.1047.
Zhao, Y., Wang, R., Shen, M., Cui, Y., Wang, S., Li, Y.,., 2019. Effects of high-salt stress on daily weight gain, osmoregula- tion and immune related enzyme activities inpostlarvae., 43: 833-840 (in Chinese with English abstract).
December 15, 2020;
February 6, 2021;
June 8, 2021
© Ocean University of China, Science Press and Springer-Verlag GmbH Germany 2022
#The two authors contributed equally to this work.
. E-mail: zkwang@qau.edu.cn
(Edited by Qiu Yantao)
杂志排行
Journal of Ocean University of China的其它文章
- Study of the Wind Conditions in the South China Sea and Its Adjacent Sea Area
- A Spatiotemporal Interactive Processing Bias Correction Method for Operational Ocean Wave Forecasts
- Characteristics Analysis and Risk Assessment of Extreme Water Levels Based on 60-Year Observation Data in Xiamen, China
- Underwater Target Detection Based on Reinforcement Learning and Ant Colony Optimization
- Polar Sea Ice Identification and Classification Based on HY-2A/SCAT Data
- Thermo-Rheological Structure and Passive Continental Margin Rifting in the Qiongdongnan Basin,South China Sea, China
