The Clam Cyclina sinensis (Gmelin) Phylogeography Study with 28S rRNA Gene and Potential of Nuclear rRNA Genes in Genetic Assessments of Molluscs
2022-02-24NIGangLIQiKONGLingfengandYUHong
NI Gang, LI Qi, 2), 3), *, KONG Lingfeng, 2), and YU Hong, 2)
The Clam(Gmelin) Phylogeography Study with 28S rRNA Gene and Potential of Nuclear rRNA Genes in Genetic Assessments of Molluscs
NI Gang1), LI Qi1), 2), 3), *, KONG Lingfeng1), 2), and YU Hong1), 2)
1),,,266003,2),,266003,3),,,Sanya 572000,
Intraspecific diversity of molluscan species is usually studied based on maternally inherited mitochondrial DNA, from which only part of the evolutionary history can be reflected. Some nuclear ribosomal RNA genes such as 28S rRNA represent poten- tial candidates that can be easily applied in phylogeography because of lacking intraindividual variation. However, considering their low polymorphism, genetic appraisals on whether and how they can be used in population studies are necessary. Here, we applied a short 28S rRNA to assess genetic patterns of the clamalong the coast of China and compared the results with a for- mer study based on COI and ITS-1 analyses. The results revealed the 28S rRNA data set was characterized by an extremely low level of variation, with only seven haplotypes defined for 93 individuals. Haplotype and nucleotide diversity for each population was al- most the lowest when compared with the other two markers. However, the distribution of two dominant haplotypes showed clear geo- graphic patterns, and significant population differentiation was revealed between the East China Seaand the South China Sea. These patterns were highly concordant with findings of the former study that populations ofwere historically separated by land bridges among sea basins. Our study suggested that although the nuclear rRNAs have shortcomings such as low variation, they have advantages including lack of intraindividual variation and high amplification rates.Applying rRNA genes can enrich the toolbox of nuclear markers in molluscan phylogeographic studies.
marine phylogeography; molluscs; nuclear gene; genetic break
1 Introduction
The basic level of marine biodiversity is genetic diver- sity,which provides a natural variation of the raw mate- rial of evolution and ensures the survival of populations withstanding environmental changes (May and Godfrey, 1994). Studies on genetic diversity can provide valuable bio-logical and evolutionary information that is essential for the successful conservation and/or management of marine species (Xiao, 2009).
Phylogeography is a powerful tool for using genetic da- ta to understand intraspecific diversity patterns both in spaceand time (Avise, 2009). In recent decades, massive studies have been carried out in diverse taxonomic groups (see Hickerson, 2010; Shafer, 2010; Turchetto-Zolet, 2013). However, research effort on marine species, especially on the largest marine phylum Mollusca, is still not comparable to that on terrestrial and freshwater groups (Beheregaray, 2008). Moreover, the previousstudies were mainly based on some universal, partial sequences of mi- tochondrial DNA (mtDNA) (Cutter, 2013). Although mtDNA alone can provide valuable insights on phylogeography, it can only reflect part of the evolutionary history because of maternal inheritance, belying the complex amalgam of processes that shaped genetic diversity (Hare, 2001). In- dependent nuclear genes, with different patterns of evolu- tion and modes of inheritance from mtDNA, can provide a comprehensive perspective on phylogeographic history (Funk and Omland, 2003; Avise, 2009).
At present, a state-of-the-art approach in nuclear phy- logeography is a genomic scan based on next-generation sequencing, which can offer extremely high resolution on population differentiation (Emerson, 2010). How- ever, in practice, the cost for sequencing hundreds of spe- cimens, which is typically required in phylogeographic studies,is a heavy burden for small research projects. Tra-ditional nuclear markers like ribosomal RNA (rRNA) genesare still useful in phylogeographic studies, especially for numerous marine invertebrates that have not been studied thoroughly. The rRNA genes tend to evolve in a concerted way, which is known as ‘concerted evolution’ that result innucleotide homogeneity among multigene families (Dover, 1982). Specific rRNA regions can be selectively ampli- fied by universal markers followed by direct DNA se-quencing (Freeland, 2011). Compared with other nu- clear markers such as microsatellites, this approach does not require species-specific development for species that are never examined before (Zane, 2002). The trans- ferable markers also facilitate comparisons of evolutionarypatterns among different species (Schlötterer, 2004). How- ever, to employ this method,it is important to know whe- ther a conserved nuclear gene comprises sufficient polymor- phic sites to reflect the evolutionary history of a species.
In this study, we performed a phylogeographic study on the bivalve(Gmelin) using a partial 28S rRNAgene.is a common bivalve with a wide distribution in China and Japan, and is usually found from the muddy sand bottom of the intertidal zone (Qi, 2004).This species has a short planktonic larval duration of about 7 days on average in laboratory conditions (Zeng and Li, 1991), indicating there is limited gene flow among distant populations. The indication was verified by a former study on populations along the coast of China (Ni, 2012), in which significant population differentiation was reveal- ed by both COI and ITS-1 genes between populations of the East China Sea (ECS) and the South China Sea (SCS). This background provides a chance for us to compare the performance of the 28S rRNA gene in illustrating phylo- geographic break within thepopulations. Ac- cording to our results, we also discussed the potential and pitfalls of using rRNA genes in molluscan phylogeogra- phic studies.
2 Materials and Methods
2.1 Sample Collection
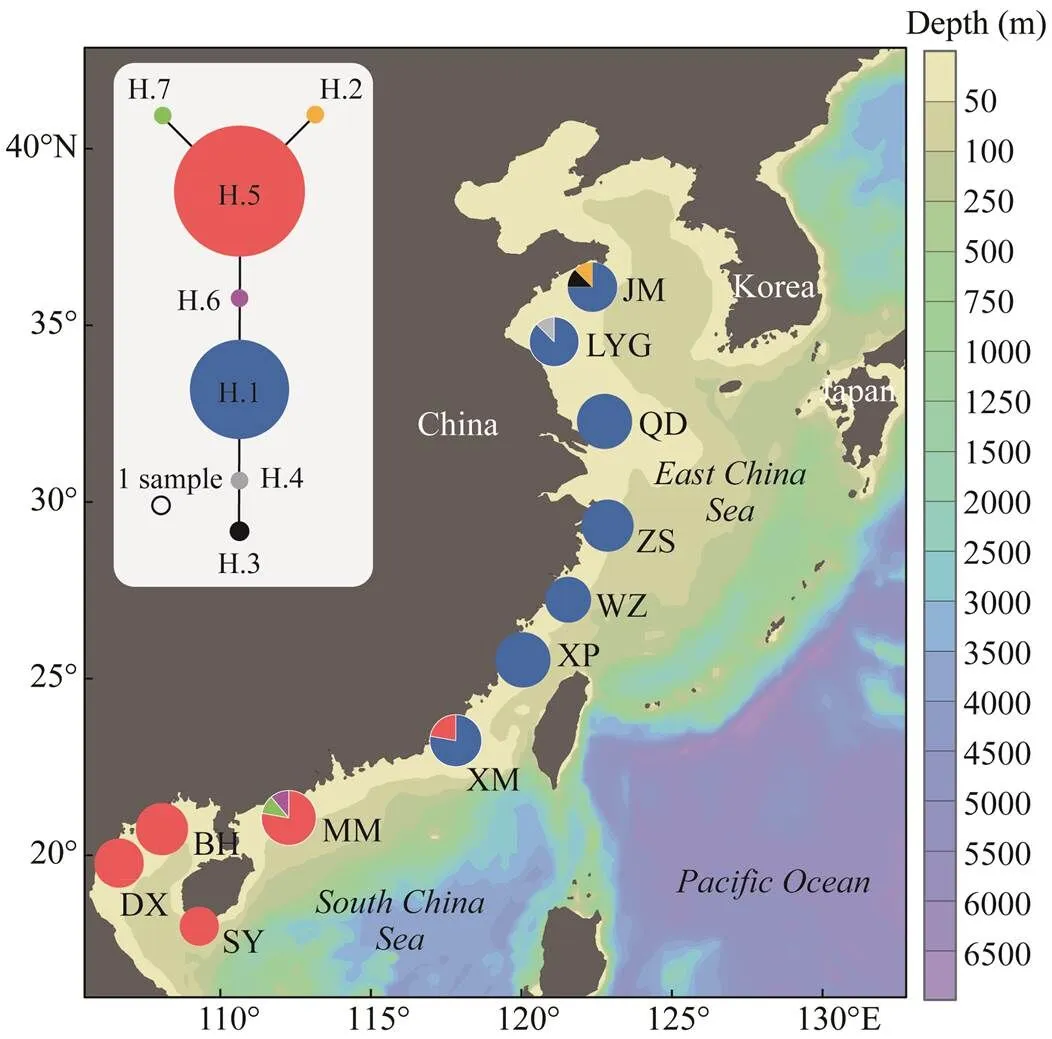
Specimens ofused in this study are a subset of populations from a former study of Ni(2012). They are selected to represent both the ECS and SCS li- neages according to former results. A total of 93 indivi- duals from 11 localities were used here, with a range of 5–10 individuals per site (Fig.1 and Table 1). Samples were collected from October 2005 to January 2010 from public access areas without specific permit. The adductor muscle was either incised and stored in 95% ethanol or frozen at −30℃ immediately for DNA extraction in the near future. Total genomic DNA was extracted from about 50mg mus- cle tissue following a phenol-chloroform purification pro- cedure described by Li(2002).

Fig.1 Sampling localities for the clam C. sinensis along the coast of China and the distribution of haplotypes in each population. Haplotype network is shown (top left) with the sizes of circles being proportional to their frequencies.

Table 1 Sampling information and diversity indices for the 11 populations of C. sinensis
2.2 Sequence Acquisition
A fragment of the 28S rRNA gene was amplified using the primer pair 28SMIDF (5’-CTTGAAACACGGACCA AGG-3’ forward) and 28SD6R (5’-CCAGCTATCCTGAG GGAAACTTCG-3’ reverse) (Mikkelsen, 2006). Each polymerase chain reaction (PCR) was carried out in 50- μL volumes including 2U Taq DNA polymerase (Takara Co.), about 100ng template DNA, 0.25μmolL−1of each primer, 0.2mmolL−1dNTPs, 1×PCR buffer, and 2mmolL−1MgCl2. The PCR amplification was conducted on a GeneAmp®9700 PCR System (Applied Biosystems), and the cycling conditions were as follows: initial denaturation at 94℃ for 3min, followed by 35 cycles of denaturation at 94℃ for 1min, annealing at 56℃ for 1min, and exten- sion at 72℃ for 1min, with a final extension at 72℃ for 5min. The products were checked using 1.5% TBE agarose gel electrophoresis stained with ethidium bromide. The tar- get fragments were purified with EZ Spin Column PCR Pro- duct Purification Kit (Sangon) and sequenced using Big- Dye chemistry (Applied Biosystems Inc., USA) on an ABI PRISM 3730 (Applied Biosystems) automatic sequencer. We did not pursue cloning of the gene because multiple peaks indicating the intraindividual variations were not ob- served in all specimens.
2.3 Data Analyses
Sequences were edited and aligned using the DNA- STAR software (DNASTAR, Inc.) and then refined ma- nually. Haplotypes were defined using the DnaSP 5 under the setting of sites with gaps considered (Librado and Ro- zas, 2009), and deposited in GenBank with accession num- bers HQ881576-HQ881582. Their phylogeny was inferr- ed using a maximum parsimony network in the TCS 1.21 package (Clement, 2000). The gaps were treated as a fifth state because we think that haplotypes separated by an indel event are different. We used ARLEQUIN 3.5 (Ex- coffier and Lischer, 2010) to calculate molecular diversity indices including haplotype diversity () and nucleotide diversity (). Spatial analysis of molecular variance (SA- MOVA) implemented in the software SAMOVA 1.0 (Du- panloup, 2002) was performed to define groups of populations () that were spatially homogeneous. The groupnumber was tested from=2 to=10 with 100 simulated annealing processes. Partitioning of the genetic variation was accomplished by a hierarchical analysis of molecular variance (AMOVA; Excoffier, 1992) in ARLEQUIN 3.5 with 10000 permutations. PairwiseSTwas also calcu- lated in the same software under the setting of pairwise difference with 10000 permutations followed by a standard Bonferroni correction (Rice, 1989).
3 Results
We successfully amplified and sequenced the partial 28S rRNA gene for all 93 individuals. As predicted, the data set was characterized by an extremely low level of sequence variation. The final alignment was 297bp long, including two polymorphic sites and four gaps, defining a total of seven haplotypes. Seven of the 11 populations were domi-nated by only one haplotype, and haplotype and nucleotidediversities for each of them were zero (Table 1). The rest populations had two or three haplotypes. JM showed the highest variation with haplotype diversity () of 0.464 and nucleotide diversity () of 0.004209, while the LYG was the lowest with=0.250 and=0.000847 (Table 1). The parsimony network of the haplotypes showed a simple to- pology with shallow genetic divergence. The haplotype H.1, as the most abundant one with 56 copies (accounting for 60.2%), showed significant geographic distribution in se- ven ECS populations.The second common haplotype H.5 had 32 copies (34.4%), with major distribution in four SCS populations, but also appeared in a neighbouring ECS po- pulation (XM) with 2 copies (Fig.1).
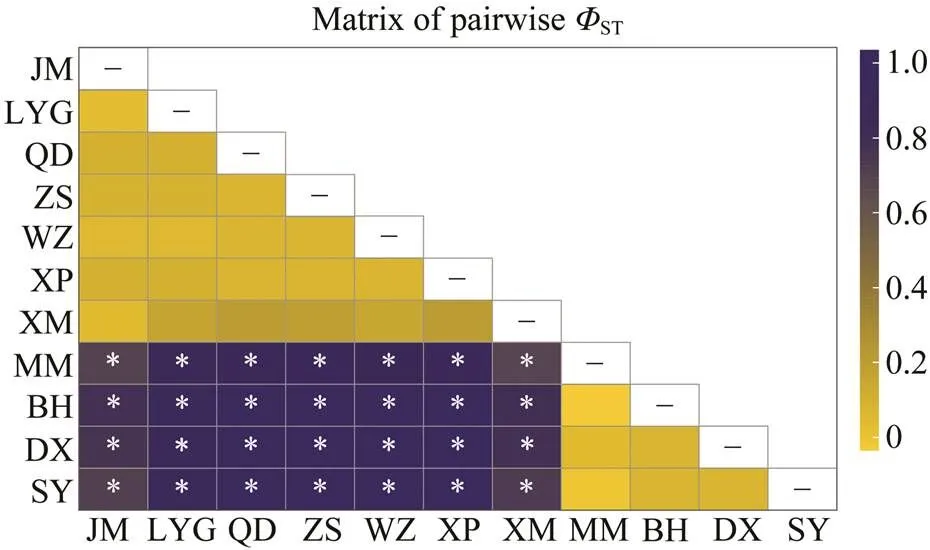
For SAMOVA analysis, the method determined the op- timal grouping, for which the among-group component (CT) of the total genetic variance was the highest. In this study, the highest value was observed at two groups, group 1 including JM, LYG, QD, ZS, WZ, XP and XM, and group 2 including MM, BH, DX and SY. Under this grouping strate- gy, hierarchical analyses of AMOVA indicated a significantlevel of differentiation among groups (CT=0.873,=0.003;Table 2), explaining 87.32% of the overall genetic variation.Variation within populations accounted for 12.29% (ST=0.877), while variation among populations withingroups (SC=0.031) only accounted for 0.39% of the total variation. Pairwise analyses revealed uniformly large and significantSTvalues between populations in different seas after a stan-dard Bonferroni correction, while none of the values betweenpopulations within the ECS or SCS was significant (Fig.2).

Table 2 Result of analysis of molecular variance (AMOVA)
Note: Significant differences (-value<0.05) are indicated in bold.

Fig.2 Heatmap visualizing pairwise ΦST values between theC. sinensis populations. Asterisk (*) indicates the signifi- cant P value after a standard Bonferroni correction.
4 Discussion
4.1 Low Variation of the 28S rRNA Gene in C. sinensis Populations
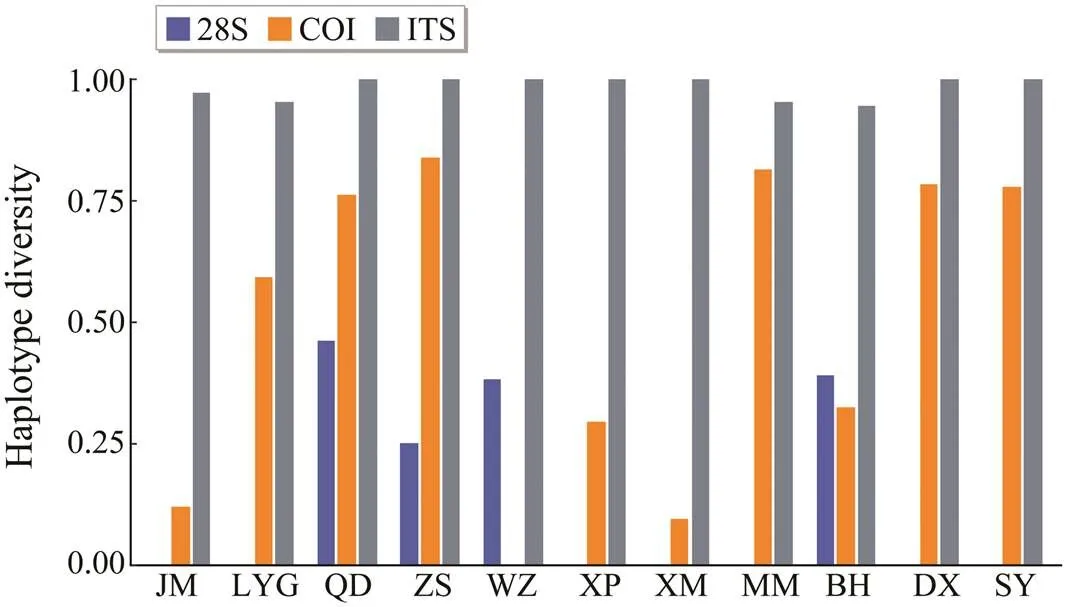
is one of the most widely distributed bival- ves in China, and its genetic pattern has been studied us- ing diverse genetic markers including amplified fragment length polymorphism (Zhao, 2007) and sequence data(Ni, 2012). In this study, we accessed its genetic patterns using a partial conserved 28S rRNA gene. Unsur- prisingly, the data set was characterized by an extremely low level of polymorphism. Only seven haplotypes were defined and no more than five mutations were required to connect them. When compared with the COI and ITS-1 ana- lyses results in the former study of Ni(2012), the 28S rRNA gene showed the lowest haplotype diversity in each population except for XM and MM (Fig.3), and so was the case for comparison of nucleotide diversity results (fi- gure not shown).

Fig.3 Haplotype diversity compared with three genes, ITS- 1 (grey), COI (orange), and 28S rRNA (blue) in each po- pulation. The ITS-1 and COI data are from a former study by Ni et al. (2012).
4.2 Phylogeographic Split Between the East and the South China Seas
Although the 28S rRNA data set has low variation, sig- nificant population differentiation was revealed between the ECS and SCS populations. Multiple evidences from the haplotype distribution, pairwiseST,and AMOVA analy- ses all support the conclusion. This finding was concordant with the results of COI and ITS-1 analyses in the former study (Ni, 2012), in which the significant population structure was also indicated between the two seas. The pat- tern can be explained by the ‘vicariance, then secondary contact’ hypothesis which represents a general phylogeo- graphic rule for coastal species in the seas of China (Ni, 2014). During the glacial periods, the sea level in the ECS and SCS declined about 120m (Wang and Sun, 1994). A large land bridge exposed from eastern China to Taiwan Is- land, serving as a barrier to the gene flow of marine spe- cies between the two sea basins (Voris, 2000). When sea levels rose as glaciers melted, the barrier disappeared and the isolated populations recolonized the coastline and met at borders of the sea basins. The same evolutionary sce- nario was also revealed in other coastal species, including clam(Kong and Li, 2009), mitten crab(Xu., 2009), and two fishes(Liu, 2007) and(Qiu, 2016).
4.3 Application of Conserved Nuclear rRNAs in Molluscan Phylogeography
The resolution of phylogeography is closely linked to the molecular methods generated to detect the variation. Different genetic markers may have different inheritance patterns and mutation rates, providing different informa- tion about genetic diversity and population differentiation (Freeland, 2011). There are no standard criteria to evaluate which one is superior to the others because each of them has inherent strengths and weaknesses.
In this study, with the short and conserved 28S rRNA gene, we found that although the alignment was with low variation, it could reveal the significant population diffe- rentiation between the ECS and SCS. This finding makes us believe that nuclear rRNAs are valuable in studying mol- luscan phylogeography. They have advantages and can be applied in some cases. First, rRNA genes can be directly amplified and sequenced,while cloning is usually requir- ed prior to sequencing for other nuclear genes. Some stud- ieshave revealed there were no putative heterozygotes in the 28S rRNA datasets (, Zhang,2006;Hurry, 2014). Second, inner primer pairs can be easily designed for the conserved rRNA genes. This approach enables nu- clear sequence acquisition from shelled molluscs with high DNA degradation due to an inadequate fixation of tissues in ethanol. Third, due to the phenotypic plasticity in shell morphology, molluscs contain high levels of cryptic spe- cies diversity (Lemer, 2014). Significant divergence in rRNAs can be treated as strong signal for the existence of cryptic species or long-term isolation of populations. Of course, this kind of genes shows low variation, and can not be employed to resolve fine-scale genetic patterns and de- tailed evolutionary processes in a short time scale. Markers with higher resolution such as microsatellites and SNPs are needed in such cases.
5 Conclusions
In this study, we applied a short and conserved 28S rRNA gene to reveal the genetic patterns of a clam, and discussed the potential and pitfalls of using nuclear rRNAs in molluscan phylogeography. Although the 28S rRNA gene here can reflect the genetic break in, it does not meanthat rRNAs should be considered in all studies. Instead, by demonstrating the possibility of us-ing short rRNAs in some specific situations, this study en- riches the toolbox of nuclear markers in genetic assessmentsof molluscs. Since no marker is perfect in all cases, it is worthy to know their strengths and limitations. It is no doubtthat the genomic approach based on next-generation sequen- cing will become more popular in future phylogeographic studies, and more molluscan species will be benefited from this advanced biotechnology revolution.
Acknowledgements
We thank Dr. Jie Bai from Shenzhen Genomics Research Institute and Dr. Ying Pan from Guangxi University for their kind help in sample collection. This study was supported by research grants from the Science and Technology De- velopment Project of Weihai City (No. 2018NS01), the In- dustrial Development Project of Qingdao City (No. 20-3- 4-16-nsh), and Guangxi Province (No. AA17204080-4).
Avise, J. C., 2009. Phylogeography: Retrospect and prospect., 36: 3-15.
Beheregaray, L. B., 2008. Twenty years of phylogeography: The state of the field and the challenges for the Southern Hemi-sphere., 17: 3754-3774.
Clement, M., Posada, D., and Crandall, K. A., 2000. TCS: A com-puter program to estimate gene genealogies., 9: 1657-1659.
Cutter, A. D., 2013. Integrating phylogenetics, phylogeography and population genetics through genomes and evolutionarytheory., 69: 1172-1185.
Dover, G., 1982. Molecular drive: A cohesive mode of species evolution., 299: 111-117.
Dupanloup, I., Schneider, S., and Excoffier, L., 2002. A simulated annealing approach to define the genetic structure of popula- tions., 11: 2571-2581.
Emerson, K. J., Merz, C. R., Catchen, J. M., Hohenlohe, P. A., Cresko, W. A., Bradshaw, W. E.,., 2010. Resolving post- glacial phylogeography using high-throughput sequencing., 107: 16196-16200.
Excoffier, L., and Lischer, H. E. L., 2010. Arlequin suite ver 3.5: A new series of programs to perform population genetics ana- lyses under Linux and Windows., 10: 564-567.
Excoffier, L., Smouse, P. E., and Quattro, J. M., 1992. Analysis of molecular variance inferred from metric distances among DNAhaplotypes: Application to human mitochondrial DNA restric- tion data., 131: 479-491.
Freeland, J. R., Kirk, H., and Petersen, S., 2011.. John Wiley & Sons, Ltd., Chichester, UK, 35-76.
Funk, D. J., and Omland, K. E., 2003. Species-level paraphyly and polyphyly: Frequency, causes, and consequences, with in- sights from animal mitochondrial DNA, 34: 397-423.
Hare, M. P., 2001. Prospects for nuclear gene phylogeography., 16: 700-706.
Hickerson, M. J., Carstens, B. C., Cavender-Bares, J., Crandall, K. A., Graham, C. H., Johnson, J. B.,.,2010. Phylogeo- graphy’s past, present, and future: 10 years after Avise, 2000., 54: 291-301.
Hurry, C. R., Schmidt, D. J., Ponniah, M., Carini, G., Blair, D., and Hughes, J. M., 2014. Shared phylogeographic patterns be-tween the ectocommensal flatwormand its host, the endangered freshwater crayfish., 2: e552.
Kong, L. F., and Li, Q., 2009. Genetic evidence for the existence of cryptic species in an endangered clam., 156: 1507-1515.
Lemer, S., Buge, B., Bemis, A., and Giribet, G., 2014. First mole- cular phylogeny of the circumtropical bivalve family Pinnidae (Mollusca, Bivalvia): Evidence for high levels of cryptic spe- cies diversity., 75: 11-23.
Li, Q., Park, C., and Kijima, A., 2002. Isolation and characteri- zation of microsatellite loci in the Pacific abalone,, 21: 811-816.
Librado, P., and Rozas, J., 2009. DnaSP v5: A software for com- prehensive analysis of DNA polymorphism data., 25:1451-1452.
Liu, J. X., Gao, T. X., Wu, S. F., and Zhang, Y. P., 2007. Pleisto- cene isolation in the Northwestern Pacific marginal seas and limited dispersal in a marine fish,(Tem-minck & Schlegel, 1845)., 16: 275-288.
May, R. M., and Godfrey, J., 1994. Biological diversity: Diffe- rences between land and sea [and discussion]., 343: 105-111.
Mikkelsen, P. M., Bieler, R., Kappner, I., and Rawlings, T. A., 2006. Phylogeny of Veneroidea (Mollusca: Bivalvia) based on mor- phology and molecules., 148: 439-521.
Ni, G., Li, Q., Kong, L. F., and Yu, H., 2014. Comparative phy- logeography in marginal seas of the northwestern Pacific., 23: 534-548.
Ni, G., Li, Q., Kong, L. F., and Zheng, X. D., 2012. Phylogeogra-phy of bivalve: Testing the historical glacia- tions and Changjiang River outflow hypotheses in northwes- tern Pacific., 7: e49487.
Qi, Z. Y., 2004.. China Ocean Press, Beijing, China, 608pp.
Qiu, F., Li, H., Lin, H., Ding, S., and Miyamoto, M. M., 2016. Phylogeography of the inshore fish,, along the Pacific coastline of China., 96: 112-117.
Rice, W. R., 1989. Analyzing tables of statistical tests., 43: 223-225.
Schlötterer, C., 2004. The evolution of molecular markers–Just a matter of fashion?, 5: 63-69.
Shafer, A., Cullingham, C.I., Cote, S.D., and Coltman, D.W., 2010. Of glaciers and refugia: A decade of study sheds new light on the phylogeography of northwestern North America, 19: 4589-4621.
Turchetto-Zolet, A., Pinheiro, F., Salgueiro, F., and Palma-Silva, C., 2013. Phylogeographical patterns shed light on evolutionaryprocess in South America., 22: 1193-1213.
Voris, H. K., 2000. Maps of Pleistocene sea levels in Southeast Asia: shorelines, river systems and time durations., 27: 1153-1167.
Wang, P. X., and Sun, X. J., 1994. Last glacial maximum in Chi- na: Comparison between land and sea., 23: 341-353.
Xiao, Y. S., Zhang, Y., Gao, T. X., Yanagimoto, T., Yabe, M., and Sakurai, Y., 2009. Genetic diversity in the mtDNA control re- gion and population structure in the small yellow croaker., 85: 303-314.
Xu, J., Chan, T. Y., Tsang, L. M., and Chu, K. H., 2009. Phylo- geography of the mitten crabin East Asia: Pleistocene isolation, population expansion and second- ary contact., 52: 45-56.
Zane, L., Bargelloni, L., and Patarnello, T., 2002. Strategies for microsatellite isolation: A review., 11: 1-16.
Zeng, Z. N., and Li, F. X., 1991. The study of reproductive cycle of., 10: 86-93.
Zhang, A. B., Kubota, K., Takami, Y., Kim, J. L., Kim, J. K., and Sota, T., 2006. Comparative phylogeography of three Lepto- carabus ground beetle species in South Korea, based on the mitochondrial COI and nuclear 28S rRNA genes., 23: 745-754.
Zhao, Y. M., Li, Q., Kong, L. F., Bao, Z. M., and Wang, R. C., 2007. Genetic diversity and divergence among clampopulations assessed using amplified fragment length polymorphism., 73: 1338-1343.
November 21, 2020;
December 14, 2020;
May 25, 2021
© Ocean University of China, Science Press and Springer-Verlag GmbH Germany 2022
. Tel: 0086-532-82031622
E-mail: qili66@ouc.edu.cn
(Edited by Qiu Yantao)
杂志排行
Journal of Ocean University of China的其它文章
- Study of the Wind Conditions in the South China Sea and Its Adjacent Sea Area
- A Spatiotemporal Interactive Processing Bias Correction Method for Operational Ocean Wave Forecasts
- Characteristics Analysis and Risk Assessment of Extreme Water Levels Based on 60-Year Observation Data in Xiamen, China
- Underwater Target Detection Based on Reinforcement Learning and Ant Colony Optimization
- Polar Sea Ice Identification and Classification Based on HY-2A/SCAT Data
- Thermo-Rheological Structure and Passive Continental Margin Rifting in the Qiongdongnan Basin,South China Sea, China
