Structure of the Potential Vorticity of an Explosive Cyclone over the Eastern Asian Region in Late November 2013
2022-02-24PANGHuajiFUGangandLUChungu
PANG Huaji, FU Gang, and LU Chungu
Structure of the Potential Vorticity of an Explosive Cyclone over the Eastern Asian Region in Late November 2013
PANG Huaji1), FU Gang2), *, and LU Chungu3)
1)Qingdao Engineering Technology Research Center for Meteorological Disaster Prevention, Qingdao Meteorological Bureau, Qingdao 266003, China 2)Department of Marine Meteorology, Laboratories of Physical Oceanography, Ocean-Atmosphere Interaction and Climate, Ocean University of China, Qingdao 266100, China 3) National Science Foundation, Arlington, VA 22230, USA
An explosive extratropical cyclone (EC) over the Eastern Asian region that caused two shipwrecks is analyzed using ERA-Interim reanalysis data from the European Center for Medium-Range Weather Forecasts. Analyses of the evolution of the EC reveal that the positive potential vorticity (PV) at the upper-tropospheric level displays a hook-shaped structure during the mature period of the cyclone. The PV distribution forms a vertically coherent PV structure called a PV tower. The vertical distribution of the PV can induce and strengthen cyclonic circulation from the lower- to upper-levels of troposphere, which is an important deepening mechanism of explosive cyclone. The PV tower occurs approximately ten hours prior to the development of surface occlusion in the cyclone. The evolution of surface fronts closely follows the development of the horizontal upper-tropospheric PV. This tandem development is largely attributed to the ability of the positive upper-tropospheric PV and the PV tower to induce cyclonic circulation simultaneously. The kinematic wrap-up process of cyclonic circulation also accelerates the formation of warm occlusion. A conceptual model of the distributions of positive PV and potential temperature combining the perspectives of dynamic tropopause folding, PV tower, and atmospheric stability, including westward tilting and baroclinicity, is proposed. This model can illustrate the explosive deepening mechanism of ECs. The regions of convective instability and rainfall determined by this model are consistent with those identified from the actual observation.
extratropical cyclone; rapidly deepening mechanism; potential vorticity; front evolution; coupling of upper- and low-troposphere
1 Introduction
Explosive extratropical cyclones (ECs) were jointly-termed as ‘meteorological bombs’ by Rice (1979) and San- ders and Gyakum (1980), because their heavy precipitation and strong winds pose serious threats to life and property. Owing to the complicated rapidly-deepening mechanism of such cyclones and their interrelated dynamic/thermodynamic processes, various methods have been used to analyze these dangeous weather systems (Sanders and Gyakum,1980; Sanders, 1986; Martin and Otkin, 2004; Yoshida and Asuma, 2004;Rivière, 2010; Iwao, 2012; Liberato, 2013; Hirata, 2015; Pang and Fu, 2017). The concept of potential vorticity (PV) was first introduced by Rossby (1940), expanded to a fully hydrodynamic form by Ertel (1942), and then theoretically improved by Hoskins(1985). Today, it is an important tool in the diagnosis and simulation of synoptic weather systems. PV has been widely used to analyze and diagnose severe convective weather systems (, Liang, 2010; Čampa and Wernli, 2012). Because this concept covers dynamic and thermodynamic factors, PV perspectives and diagnoses are also regarded as major approach for analyzing observational data or numerical modeling results (Hoskins, 2015).
Several studies (, Thorncroft, 1993; Martin, 1998; Posselt and Martin, 2004) have revealed that high upper-tropospheric PV may assume a unique shape during the intensive deepening processes of ECs. Specifically, high-PV contours can extend southward and curve cyclonically into ahook-shaped structure known as the ‘PV hook’.Novak(2010) indicated that the local maximum distribution of the upper-tropospheric PV is associated with intense precipitation regions and that major intense precipitation bands develop along the northern portion of the PV hook. Several case studies (, Davis and Emanuel, 1988; Kuo, 1991; Čampa and Wernli, 2012) have revealed that the development of lower-tropospheric cyclogenesis is closely associated with the distribution of the upper-tropospheric PV.
During the mature stage of a cyclone, high PVs vertically align and form what is known as a ‘PV tower’ (Martin and Otkin, 2004), which represents a tropospheric span-ning column of air with anomalously high-PV values. ThesePV anomalies may induce strong cyclonic circulation that extends from the tropopause to the earth’s surface, thereby exerting a significant impact on the development of ECs. Such a coherent structure can affect the mechanism of cyclone deepening (Wang and Rogers, 2001). Lim and Simmonds (2002) indicated that the well-organized vertical structure of PVs could develop into larger and stronger cyclones lasting longer than shallow systems, especially in explosive cyclones.
In a seminal study, Hoskins(1985) observed the dynamic coupling of the upper-tropospheric PV morphology associated with a cyclone and the thermal structure of the underlying troposphere. Martin (1998) argued that ‘the presence of an upper-tropospheric treble clef PV signature serves as a sufficient condition for asserting the presence of a warm-occluded thermal structure in the underlying troposphere’ because a high (low) upper-tropospheric PV is characterized by a cold (warm) column of air beneath it.
Intense ECs are usually accompanied by fronts, and an occlusion marks the maturity of the cyclone. The phenomena of fronts and occlusions were first proposed by Bjer- knes (1919) and Bjerknes and Solberg (1921, 1922) in their Norwegian cyclone model, which contributed to the classic understanding of cyclones and frontogenesis. The front structure plays an important role in the production and distribution of precipitation. In the conceptual model of surface front evolution introduced by Shapiro and Keyser (1990), precipitation and dynamic boundary-layer processes jointly modulate the time-scale and intensity of baroclinic waves and their internal fronts, and the frontal structure develops further to the warm-occluded stage. The basic structural evolution of fronts within cyclones is driven by the adiabatic component of motions. The frontal structure, which is the structure of a mature cyclone, and the occlusion process of explosively-deepening cyclones have been studied comprehensively by Massand Schultz (1993) as well as Schultz and Mass (1993).
Although the upper-tropospheric PV morphology has been investigated in several studies, some detailed relationships, such as the timing, mutual influence, and coordination among specific morphological changes, vertical PV development, and the surface warm occlusion of explosive cyclones, have not been completely explored. In the present paper, an EC over the Eastern Asian region thatcaused two shipwrecks and left 26 people dead or missing in the night of 24 November 2013①http://sd.ifeng.com/zbc/detail_2013_11/25/1506118_0.shtml, ac- cessed on 12 May 2021.is investigated. The development of this EC is analyzed by examining the char- acteristics of the upper-tropospheric PV and the vertical PV structure, as well as the connection between the evolution of PV and surface warm occlusion. The influence of PV and equivalent potential temperatures on the explosive deepening of the EC will also be examined to understand the possible mechanisms responsible for the explosive development of this cyclone.
2 Data Source and PV Theory
The data source for this study is the ERA-Interimdata provided by the European Center for Medium-Range Weath- er Forecasts.ERA-Interim is a global reanalysis data of recorded climate observations, including geopotential height, air temperature,andcomponents of wind, vertical velocity, relative vorticity at 37 vertical pressure levels, 10-m height U and V components of wind, mean sea level pressure, precipitable water content and 2-m height surface air temperature PV, and pressure in 15 vertical potential temperature levels. Data of these variables are available at 00, 06, 12, and 18 UTC every day with a horizontal grid spacing of 0.75˚×0.75˚.
The precipitation data are provided by the Tropical Rainfall Measuring Mission (TRMM) 3B42.
Some of the basics concepts of PV theory are reviewed here. PV can be expressed as follows (Hoskins, 1985):


PV is proportional toand −(∂/∂);is associated with the sine of the latitude, and −(∂/∂)is associated with the vertical gradient of the potential temperature. The PV distribution shows large values in the upper-level atmosphere and high-latitudes and small values in the lower-level atmosphere and low-latitudes. In other words, the change of PV isapproximately proportional to the height and latitude. The stratosphere is a high-PV reservoir because of its large static stability. The detailed PV distribution is subject to the evolution and distribution of the relative vorticity, which depends on the distribution of wind fields.
In this paper, the characteristics and evolution of PV in the upper-, middle- and lower-levels of troposphere are analyzed respectively. And the mechanism of combined effect of the three-level PV on cyclone development and the surface front evolution is also analyzed.
In the present study, the EC is defined as one in which the deepening rate of its central sea level pressure (SLP) is the geostrophic equivalent of at least 12hPa over 12h at 60˚N (Yoshida and Asuma, 2004). The explosive development is regarded as a deepening rate with a value greater than or equal to 1Bergeron (1Bergeron=1hPah−1).
3 Overview of the EC Case
An extratropical cyclone was generated at 00 UTC 24 November 2013, over the eastern coastal regions of China (Fig.1). This cyclone swept the Yellow Sea (YS) in the southern portion of the Shandong Peninsula (SDP) and arrived at the eastern portion of the peninsula around 12 UTC 24 November. The cyclone moved northeastward to the north of the Japan Sea after crossing the Korean Peninsula (KP) and landed near Vladivostok Russia again around 06 UTC 25 November, then gradually weakened while traveling continuously to the northeast.
This cyclone demonstrated explosive deepening imme- diately after its generation (Fig.2). Rapid deepening oc- curred as SLP of the cyclone center decreased to approxi- mately 16.3hPa from 00 UTC to 12 UTC 24 November 2013 with the deepening rate of 2.0 Bergeron. According to the classification criteria of explosive intensity by San- ders (1986), this cyclone was categorized as a‘strong bomb’ because its deepening rate was rapid during this period. The news reported that two cargo tankers sank in the eastern region of the SDP because of the strong winds and huge waves accompanying with this cyclone.
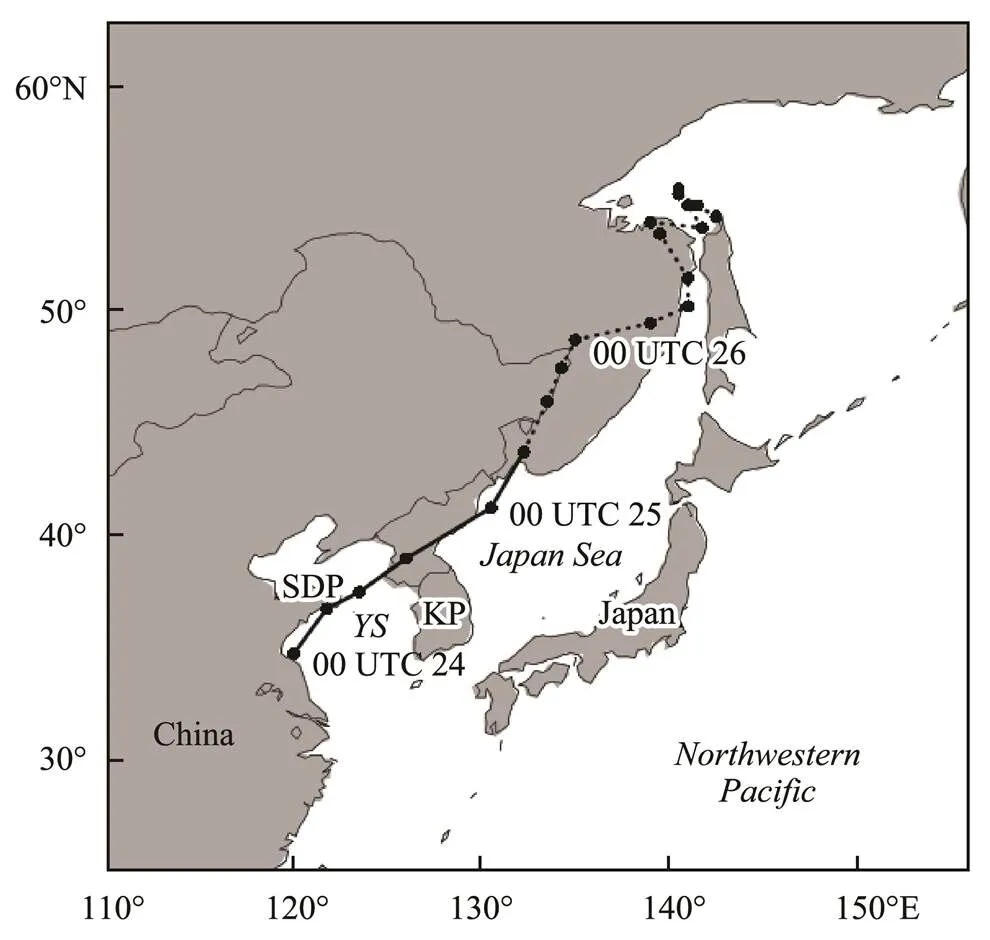
Fig.1 Moving track of the cyclone. Black dots indicate the locations of the cyclone center at intervals of 6h. Solid lines reflect the explosive stage and dotted lines indicate thedecaying stage of the cyclone. SDP, the Shandong Peninsula; YS, the Yellow Sea; KP, the Korean Peninsula.
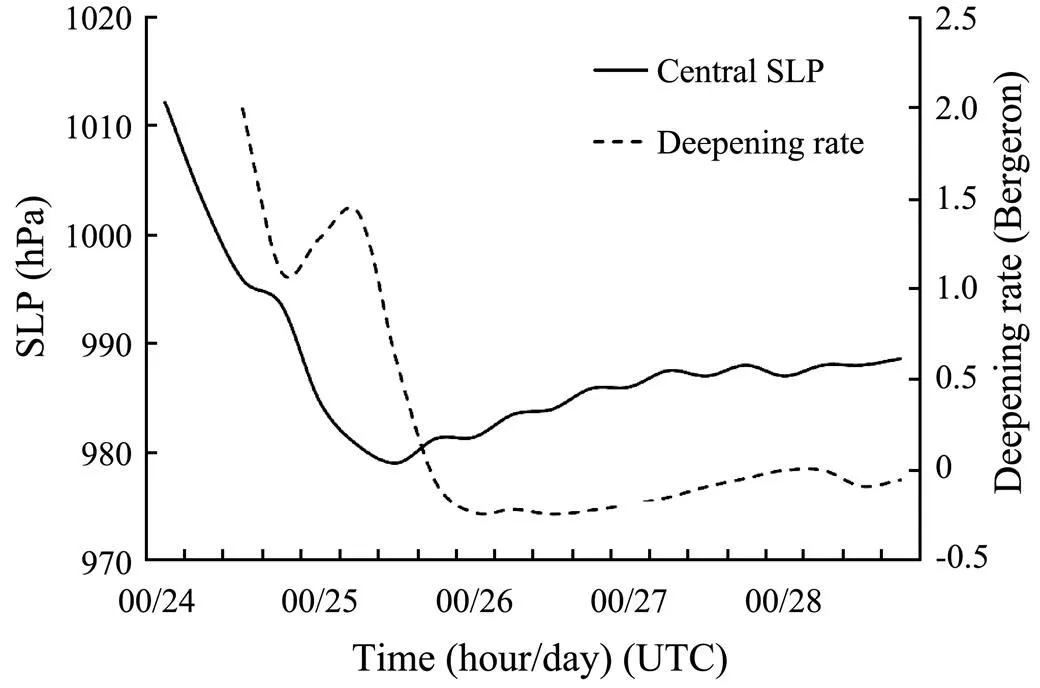
Fig.2 Time series of the central sea level pressure of the cyclone (solid line, unit: hPa) and its deepening rate (dashed line, unit: Bergeron).
The cyclone continued its explosive development until 06 UTC 25 November 2013, and reached its most intense stage at 12 UTC 25 November 2013. At this time, the central SLP of the cyclone was 979.0hPa, which is the minimum of central SLP during its life cycle.
4 Evolutionary Processes of the Upper-Level PV
4.1 Characteristics of Upper-Tropospheric PV
Initially, the center of a high upper-tropospheric PV (≥1potential vorticity unit {PVU}, 1PVU=10−6Kkg−1m2s−1), with a central intensity of greater than 6PVU, was observed around (30˚–40˚N, 100˚–105˚E) at 300hPa at 18 UTC 23 November 2013, six hours prior to the cyclone origin (Fig.3a). A low trough was found at approximately (30˚–40˚N, 100˚–110˚E) at 500hPa (Fig.3b). A high-pressure system at 850hPa was also noted in this region, and the geopotential height contour at the northern part of the region showed a transverse trough (Fig.3c).
After the cyclone was generated (at 00 UTC 24 November 2013), the high-PV center moved southeastward, and the cyclone center moved to (37˚N, 110˚E). The 1-PVU contour from the high-PV center connected to the northern high-PV reservoir (Fig.3d). The geopotential height trough also moved to the region and deepened at 500hPa. A cold area was located to the west of the trough (Fig.3e), which is an indicator of enhanced baroclinicity. At this time, a low trough located in east of the 500hPa trough slightly appeared at 850hPa (Fig.3f).
During the explosive deepening of this cyclone (at 06 UTC 24 November 2013), the high-PV center moved closer to the surface center at 300hPa (Fig.3g). The cold advection behind the trough remained strong, and the wind direction was perpendicular to the geopotential height line in front of the trough at 500hPa (Fig.3h). At low-levels of troposphere, the warm advection in front of the cyclone was also strong at 850hPa (Fig.3i). These conditions are favorable to the intense deepening of the cyclone.
The aforementioned analyses show that a bugle of high-value PV in the upstream area appeared on the upper-tropospheric PV approximately six hours or more prior to thecyclone generation. Cyclone generation appeared to be re- lated to the continuous merger of this high-PV blob with a large-PV reservoir to the north. Baroclinicity, which triggers the formation of surface cyclones, was enacted by the upper-level PV reinforcement. During this chain process, the precursor of the upper-tropospheric PV achieved stronger and more meaningful predictive signals than the geopotential height and temperature fields at 500 and 850hPa, respectively. The geopotential height and temperature fields at 500 and 850hPa are traditionally used to predict the generation of severe weather systems.
As the high-PV reservoir extended southward from the northern region, it connected to the PV blob in the south and extruded a high-PV tongue at 300hPa (Fig.4a) at 12 UTC 24 November 2013,, the beginning of the explosive deepening episode of the cyclone.
As deepening continued, the high-PV reservoir morphed high-PV air into the southern blob of the PV, and the high-PV blob was reinforced and began to stretch extensively in the west-east direction (Fig.4b).
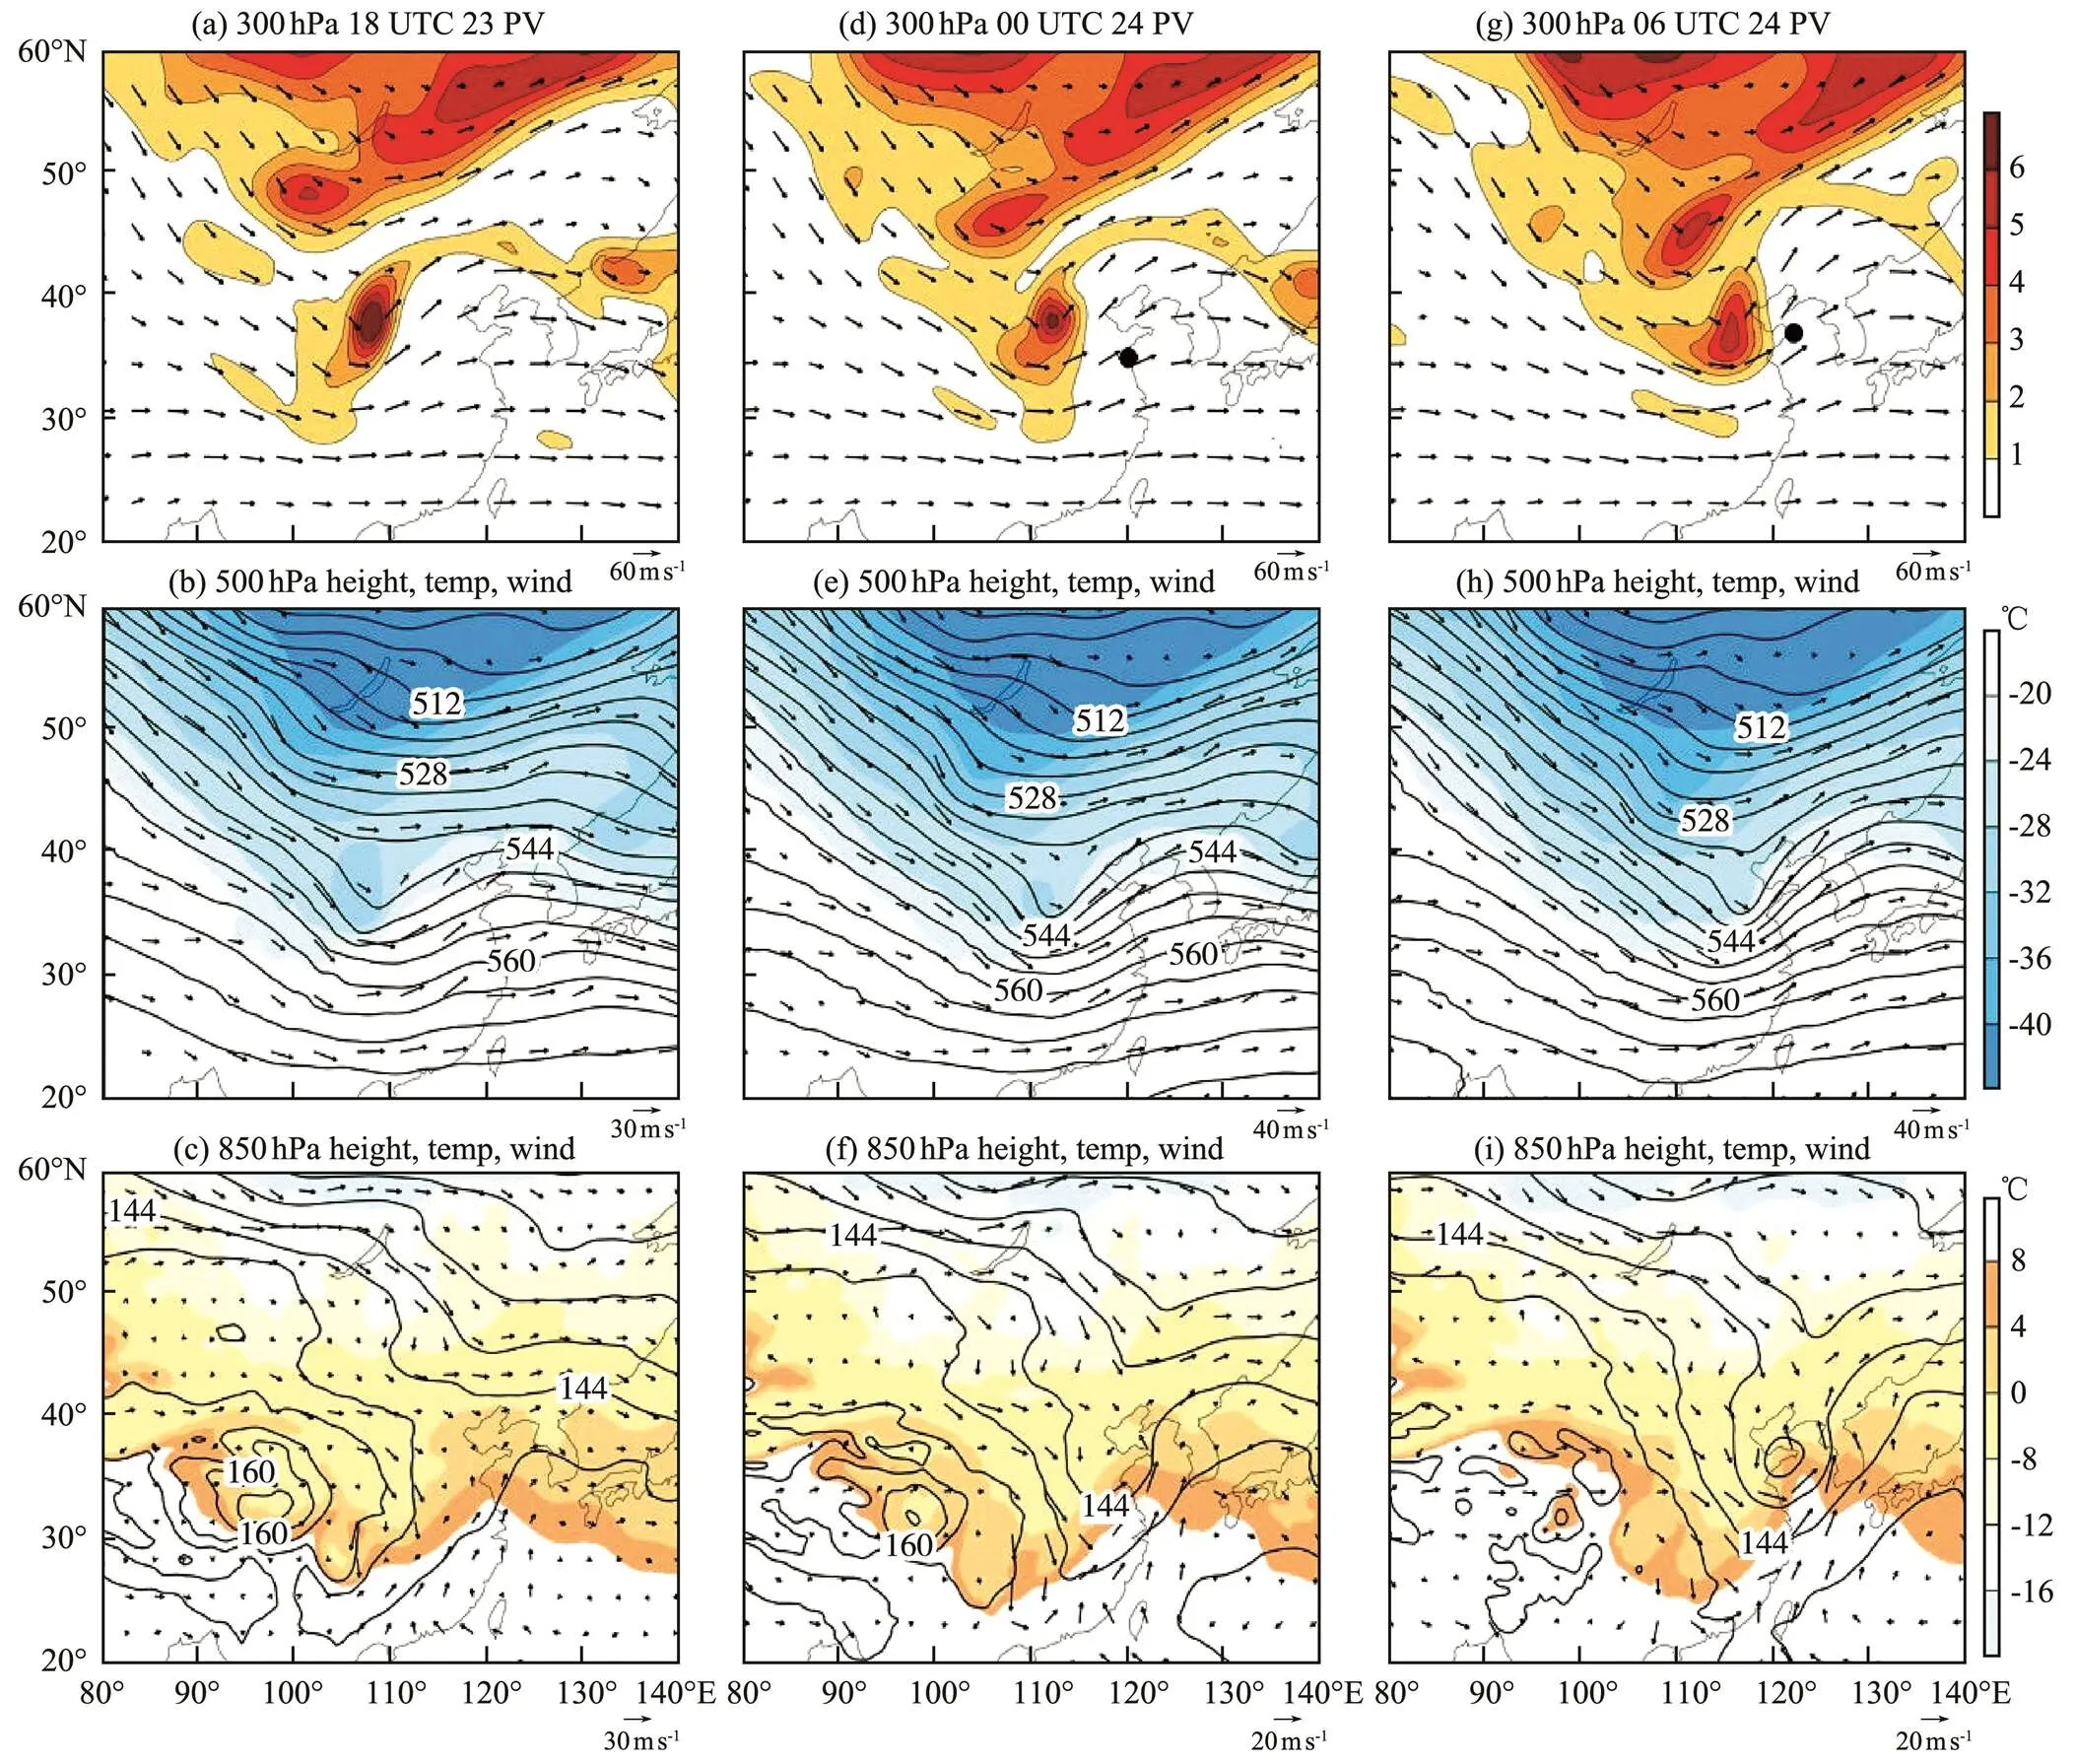
Fig.3 Synoptic maps for extratropical cyclone. (a), (d), and (g) PV (solid lines, unit: PVU, interval: 1PVU). (b), (c), (e), (f), (h), and (i) Geopotential heights (solid lines, unit: dagpm, interval: 4 dagpm), air temperatures (shaded, unit: ℃, interval: 4℃), and wind fields (unit: ms−1). (a)–(c) 18 UTC 23 November 2013, i.e., the beginning of explosive deepening. (d)–(f) 00 UTC 24 November 2013, i.e., the first explosive moment. (g)–(i) 06 UTC 24 November 2013, i.e., the most intensive point of explosive deepening. PV, potential vorticity.
Continuous injection of high-PV air into the southernmost PV blob was realizedthe opening of a PV channel between the high-PV reservoir and blob. Hook curving appeared in the PV contours in the southern prominent portion of high-value PV bulge at 00 UTC 25 November 2013 (Fig.4c). Moreover, the southeastern part of the prominent portion began to extend northeastward, and the high-PV area (PV contour≥1PVU) cut across the cyclone center, thereby indicating that the cyclone had entered into the mature stage.
At 06 UTC 25 November 2013, the PV contour of the ‘hook head’ displayed cyclonic curving northeastward at 300hPa, and the ‘hook-shaped’ structure of the high-PV became more prominent (Fig.4d). The high-PV area completely covered the surface cyclone center, and the 5-PVU contour approached the location of surface cyclone center. The high-PV shape could be linked to a treble clef, as pre-viouslydescribed by Martin (1998), because the western portion of the hook head extended to the southwest whereas the eastern portion began to extend to the northeast.
After the explosive deepening stage, the hook-shaped structure transformed into a wide blob and the PV values began to decrease gradually. Thereafter, the PV value at the hook head region decreased as the cyclone began to dissipate.The hook-shaped PV structure lost its original shape and eventually disappeared (not shown here).
The hook-shaped structure also appeared vaguely at 450hPa level, which indicates that the high-PV air in the upper-level may extend downward as the cyclone develops. This analysis is consistent with the vertical distribution of PV, which will be analyzed in the following subsection.
4.2 Vertical Structure of PV
During the rapidly-deepening stage of the EC, the upper-tropospheric PV can stretch downward from the tro- popause to low-levels of troposphere. Simultaneously, the low-tropospheric positive PV may stretch upward, passthrough the whole troposphere, and eventually connect with the upper-tropospheric PV. Such a PV distribution forms a vertically coherent PV structure known as a ‘PV tower’ (Rossa, 2000; Wang and Rogers, 2001; Pang and Fu, 2017).

Fig.4 300hPa PV field (shaded, unit: PVU, PV≥1PVU) of the cyclone at: (a), 12 UTC 24 November 2013; (b), 18 UTC 24 November 2013; (c), 00 UTC 25 November 2013; and (d), 06 UTC 25 November 2013. Solid dots indicate the location of the surface cyclone center.
The vertical distribution of the averaged PV within a bin of 2˚(latitude)×2˚(longitude) near the surface cyclone center, which is similar to the circlewith a radius of 200km suggested by Čampa and Wernli (2012), was calculated. The PV tower can be considered to form if all central PV values are greater than 1 PVU throughout the cross-section of the troposphere at the same time.
Fig.5 shows that the PV tower was formed around 18 UTC on 24 November 2013. The upper-tropospheric PV was larger than 4 PVU at 250hPa, while the low-tropospheric PV was larger than 1.5 PVU. When the intensity of the cyclone peaked at 12 UTC 25 November 2013, the 1-PVU contourat the upper-level began to disconnect from that at the lower-level, which suggests that the PV tower collapsed and that the cyclone had begun to dissipate.
4.3 Dynamic Tropopause Folding
Martin (1998) used the 1.5-PVU contour to capture dynamic changes in the tropopause to identify the location of dynamic tropopause folding. Hoskins (2015) revealed that PV and potential temperature are conserved in an adiabatic and frictionless atmosphere. If the high PV intrudes from the upper-level to the lower-level of troposphere cyc- lonic circulation may be induced. Therefore, the dynamic evolution of the tropopause can be studied in a straightforward manner by analyzing the PV on a particular isentropic surface. The present study follows Martin (1998) in using the 1.5-PVU contour to represent the tropopause.
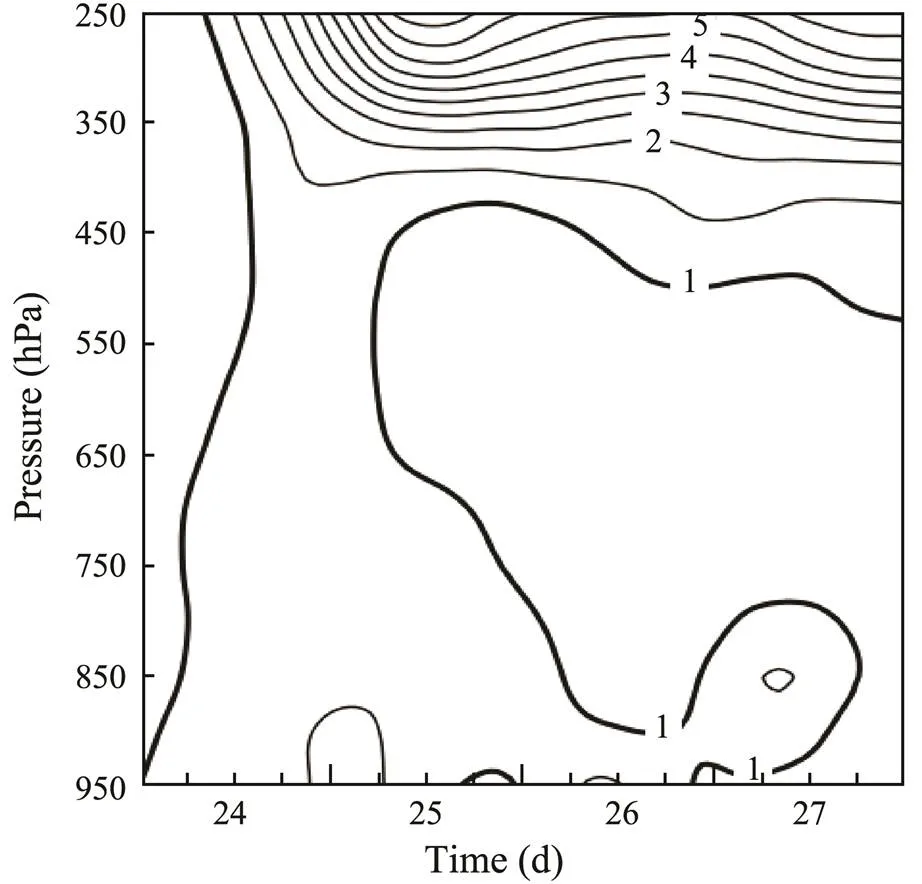
Fig.5 Time series of the vertical profile of the PV (unit: PVU, PV≥1PVU, interval: 0.5 PVU) averaged within a bin of 2˚(latitude)×2˚(longitude) centered at the cyclone surface.
On 315K isentropic surface, an apparent PV trough was located near 110˚E at the upstream portion of the cyclone center, and a PV ridge was found near 125˚E at 00 UTC 24 November 2013(Fig.6a). A strong northwesterly jet was established at the upstream portion of the trough, thus increasing the horizontal deformation on the western portion of this trough. The PV gradient was extremely large in the eastern side of the trough. The 1.5-PVU contour was close to 400hPa, thereby indicating that tropopause folding was underway.
At 12 UTC 24 November 2013, that is, the first explo- sive deepening time, the amplitudes of the PV trough and ridge increased. Moreover, the PV distribution revealed a classic trough-ridge coupling pattern on the overall isen- tropic surface (Fig.6b). The trough widened, and the 1.5-PVU contour increased to nearly 450hPa. Strong winds behind the trough blew from the stratosphere to the up- per- and mid-tropospheric levels to promote high-PV air invasion from the stratosphere to the upper- and middle-troposphere upstream of the cyclone. While the trough ex- tended southeastward, the high-PV area remained close to the cyclone center.
The PV gradients at the bottom of the trough and the top of the ridge were large at 00 UTC 25 November 2013(Fig.6c). The wind blew along the PV contour, and the 1.5-PVU contour was close to 400hPa.
At 12 UTC 25 November 2013(Fig.6d), the surface cyclone center area was completely covered by high-PV air at the 315 K isentropic surface. The depth of tropopause folding was shallower than previously noted, thereby indicating that the cyclone had begun to decay.
In summary, the stratospheric intrusion caused by strong winds behind the trough blew from the stratosphere to the upper- and mid-troposphere, and the high-PV air mass extended downward to the mid-tropospheric levels. Thus, the upper- and mid-tropospheric levels were dominated byhigh-PV air during the establishment of the PV tower in the vertical cyclone center along with the cyclone’s rapid development.
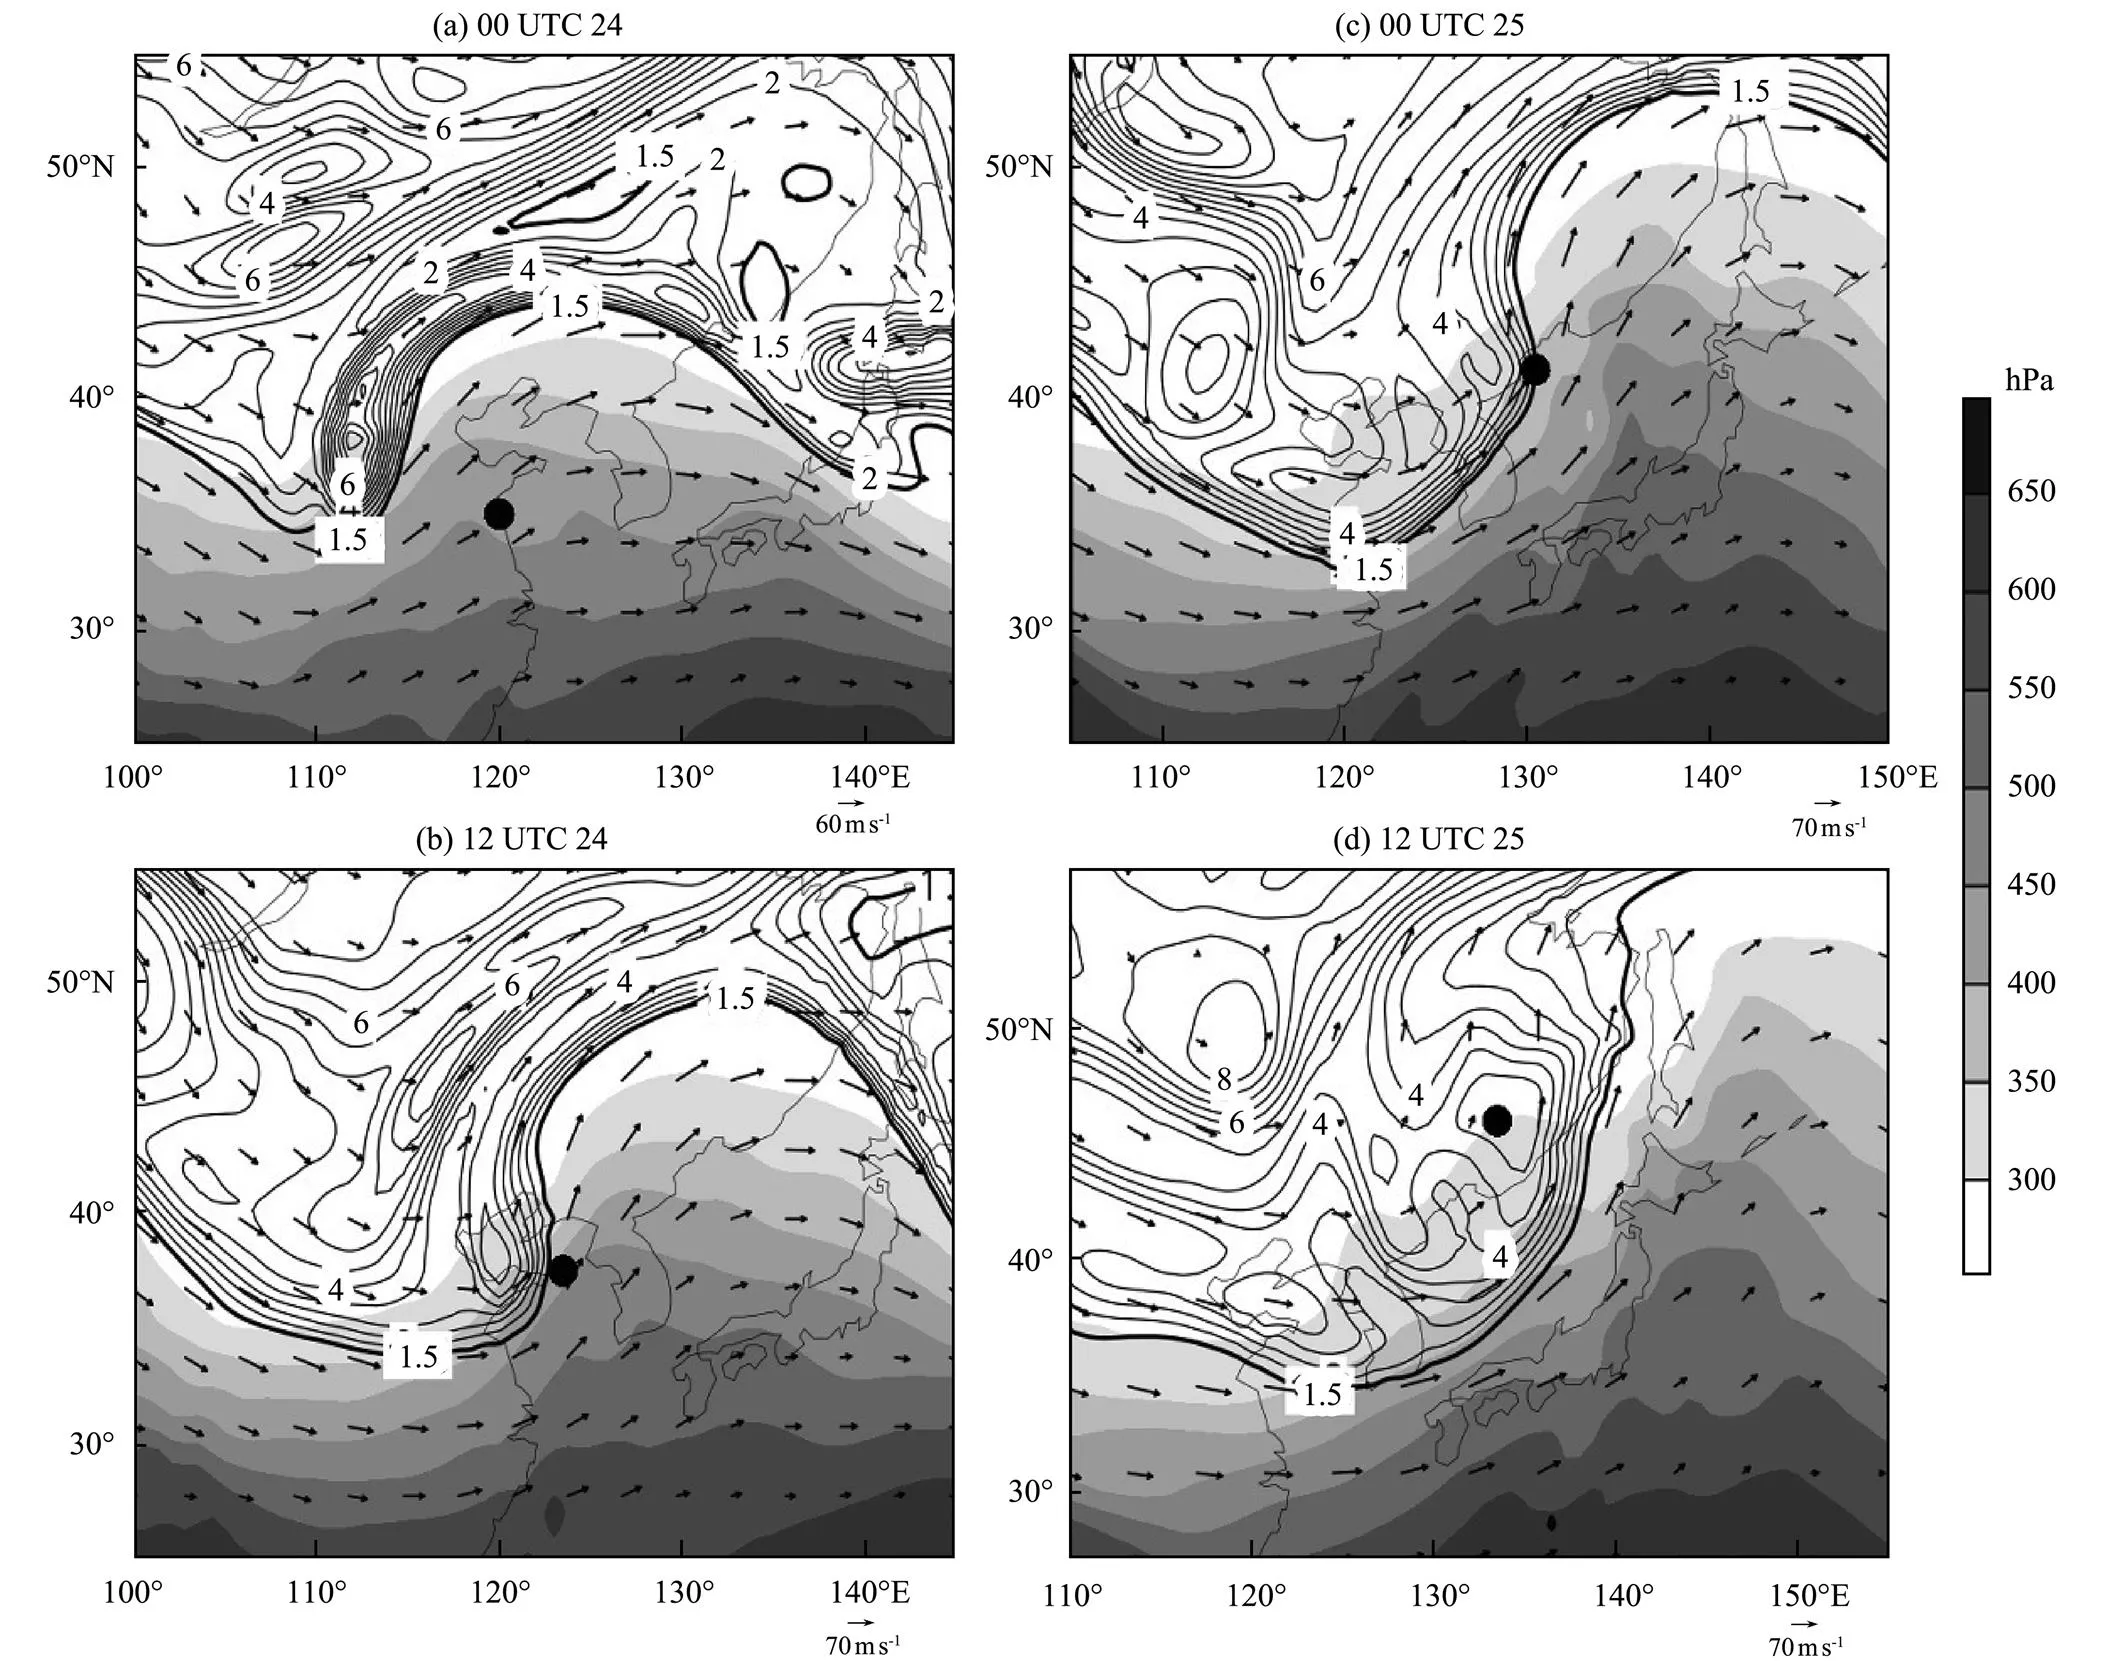
Fig.6 PVs (solid line, PV≥1.5PVU, unit: PVU) and pressures (shaded, unit: hPa, interval: 50hPa) on the 315 K (potential temperature) isentropic surface. Bold lines indicate the 1.5-PVU contour. (a), 00 UTC 24 November 2013; (b), 12 UTC 24 November 2013; (c), 00 UTC 25 November 2013; and (d), 12 UTC 25 November 2013. Solid dots indicate the location of the surface cyclone center.
5 PV Evolution and Surface Occlusion Process
5.1 Evolution of Surface Fronts
Occlusion in the Norwegian cyclone model occurs whenthe cold front catches up with the warm front, and the warm air subsequently ascends over the cold air (Bjerknes and Solberg, 1921, 1922). Schultz and Mass (1993) defined occlusion as a process during which the cyclone center separates progressively from the warm sector. These two definitions indicate that the surface cyclone center area is dominated by cold air when the occlusion appears.This process is also called warm occlusion because the temperature of the air mass ahead of the cold front is higher than that ahead of the warm front(Saucier, 1989; Schultz and Vaughan, 2011). The appearance of an occlusion implies that the cyclone is undergoing rapid deepening and will soon reach its deepest state.
The positions of cold and warm fronts can be located on the basis of the wind shear and air temperature characteristics,, strong westerlies behind the front and southerlies ahead of the front. Cold or warm fronts are located in the most significant regions of wind shear. The occluded front did not form at 00 UTC 25 November 2013 (Fig.7a) because the cold air had not invaded the surface cyclone center at this time.
A warm occlusion was formed at approximately 06 UTC 25 November 2013, and marked by cold air intruding into the area of the surface cyclone center,, a cold tongue extended progressively from the northwest to the center of the cyclone (Fig.7b). The temperature of the surface center decreased to 4℃. The winds increased behind the cold front, thereby enhancing cold-air advection.
At 12 UTC 25 November 2013, the temperature of the surface center decreased further and approached to 0℃(Fig.7c). The center area was dominated by cold air at the surface and transformed into a stable atmospheric stratification, which could establish a stage in which the cyclone begins to decay at the lower portion of the troposphere.
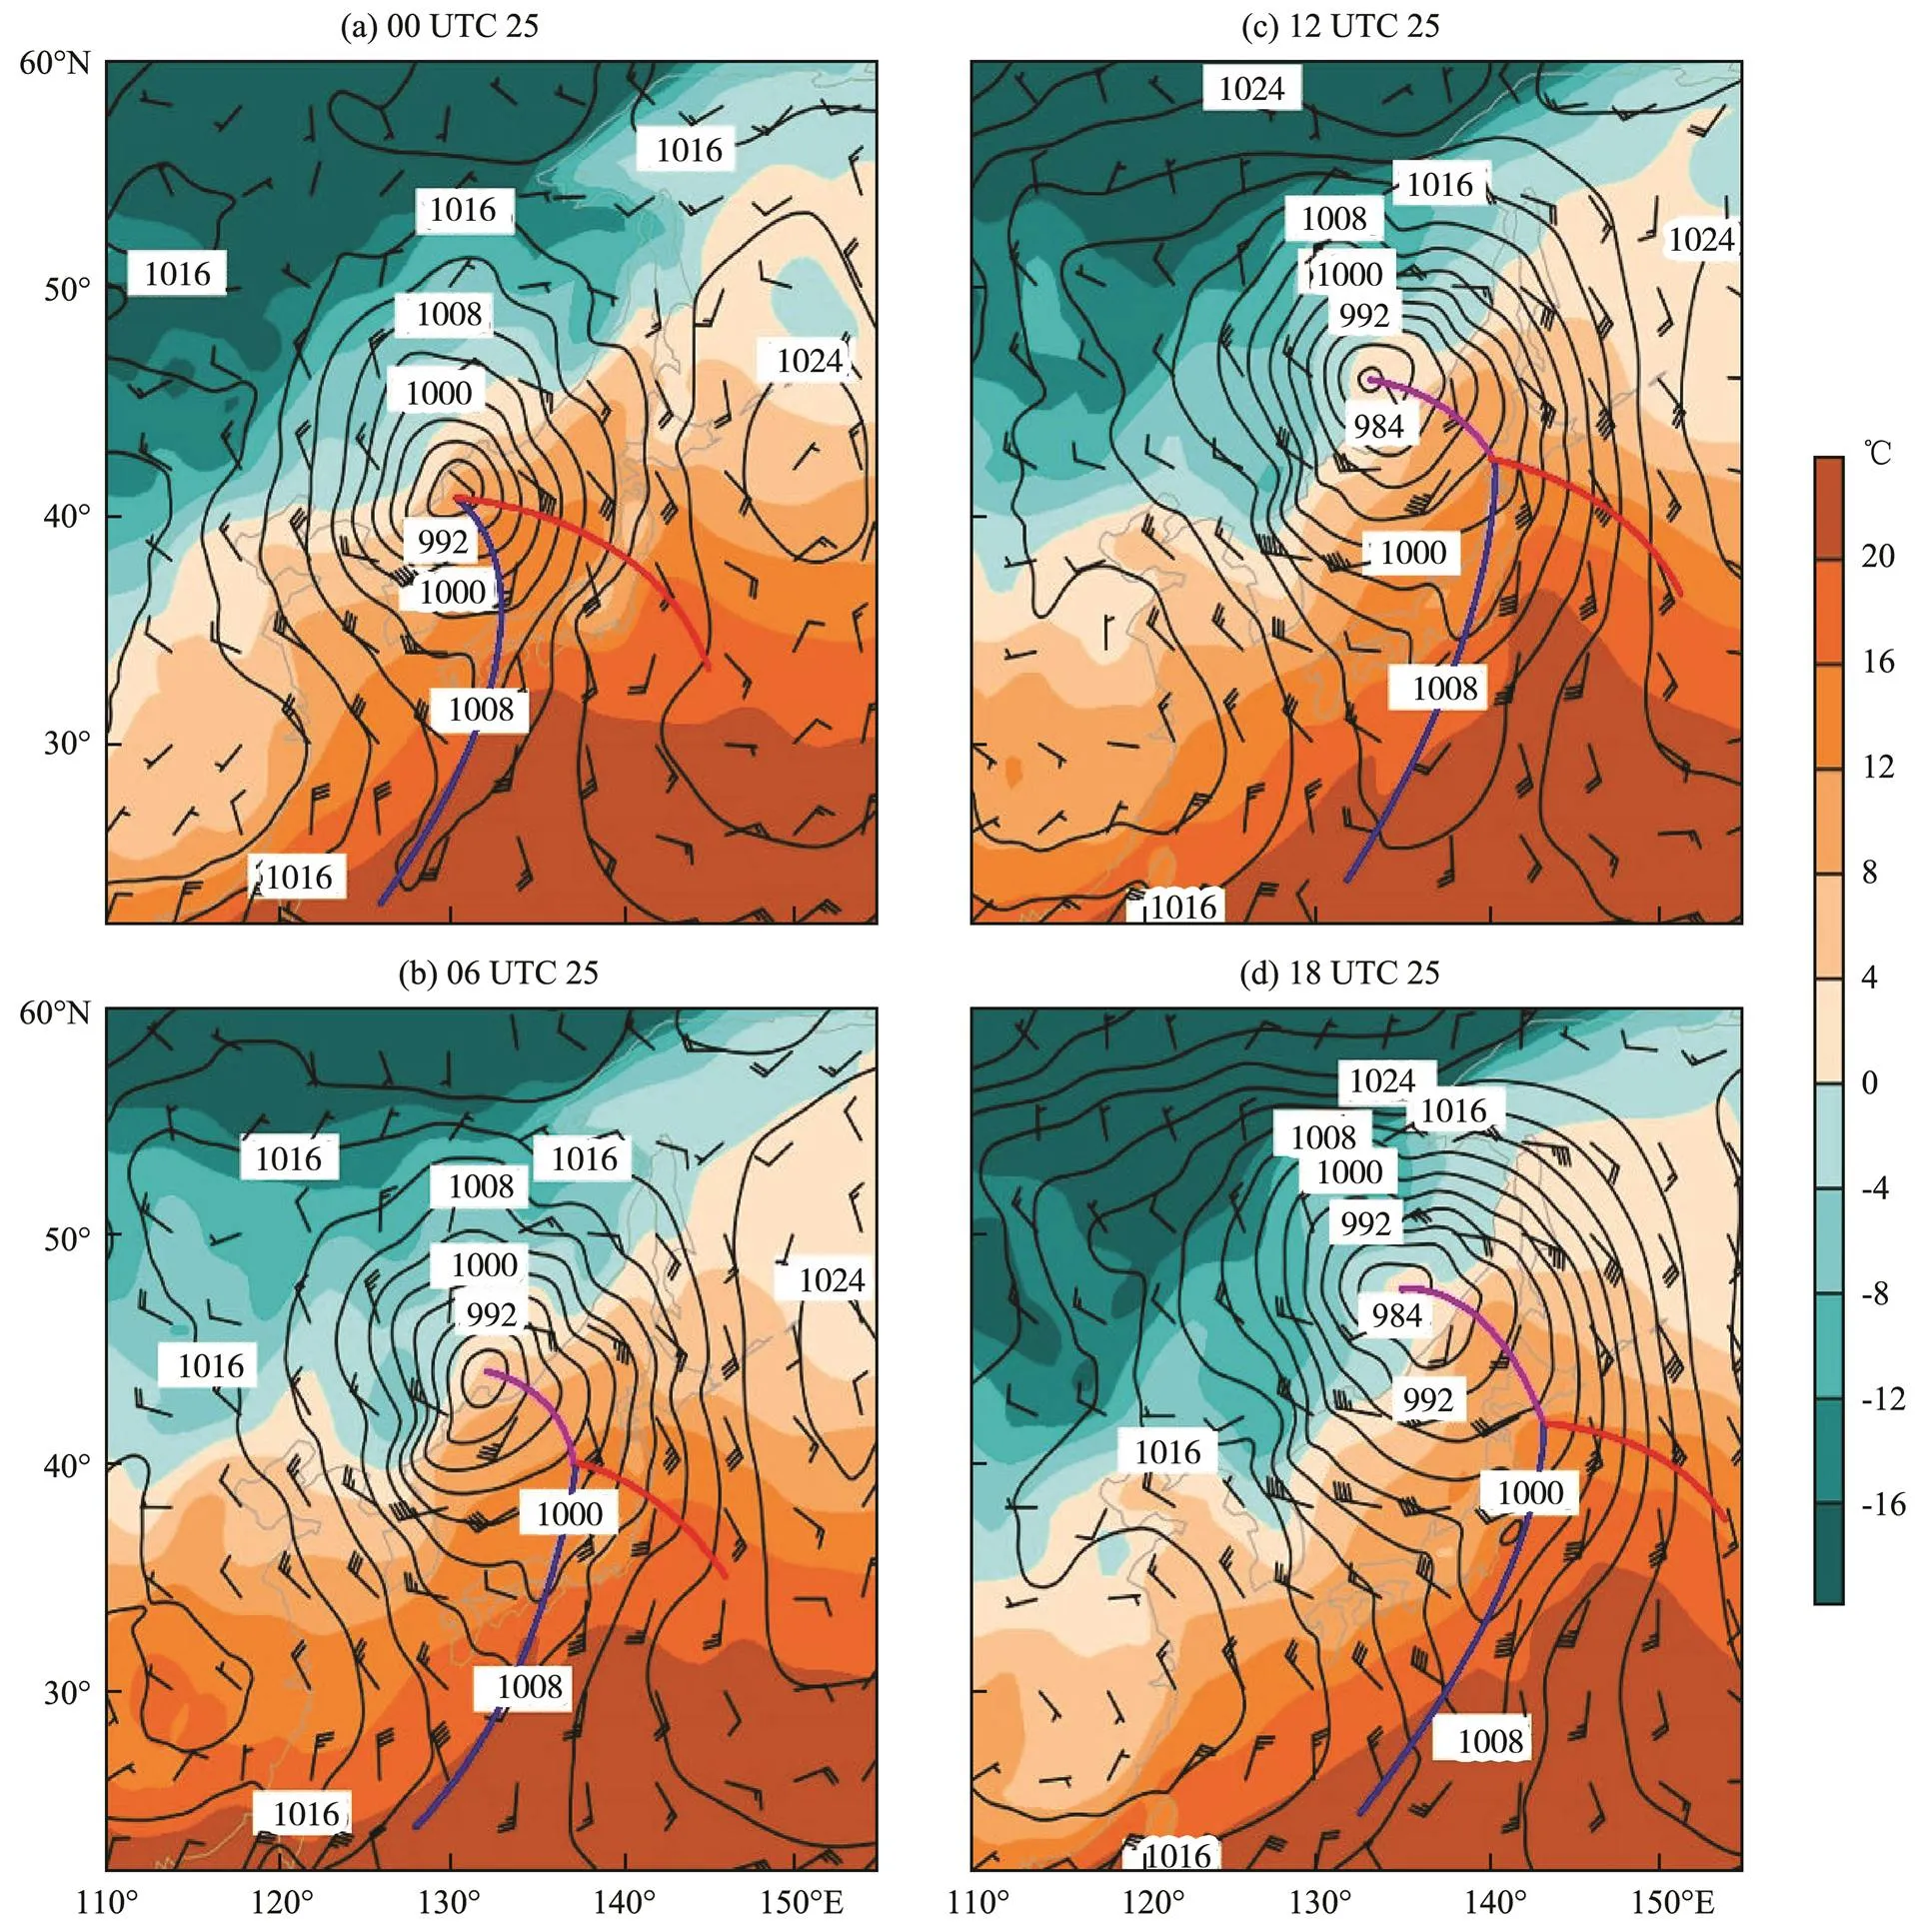
Fig.7 Synoptic surface maps for extratropical cyclone. Sea level pressures (black solid lines, unit: hPa, interval: 4hPa), air temperatures (shaded, unit: ℃, interval: 4℃), and wind barbs at 10-m height. (a), 00 UTC 25 November 2013; (b), 06 UTC 25 November 2013; (c), 12 UTC 25 November 2013; and (d), 18 UTC 25 November 2013. Blue lines represent cold fronts, red lines represent warm fronts, and purple lines represent occluded fronts.
The wind shear extended from the cyclone center to the southeast along the warm air ridge (Fig.7d), and the surface center was situated entirely in the cold sector, that is, the cyclone center separated completely from the warm sector.
5.2 Timing of Surface Occlusion
Previous analyses indicated that the surface occlusion occurred around 06 UTC 25 November 2013, and that the center of the SLP decreased to 981hPa. The cyclone deepened slowly over the next six hours, and the SLP dropped to only 979hPa at 12 UTC 25 November 2013. Thereafter, the SLP began to increase. The last explosive deepening occurred at 06 UTC 25 November 2013, with a deepening rate of 1.4 Bergeron. According to the vertical PV distribution, PV tower formation occurred approximately 12 hours prior to the occurrence of surface occlusion (Fig.5).
The evolution of the surface fronts closely followed the development of the upper-tropospheric PV characteristics. The surface fronts began to form an occlusion when the PV hookextended southeastward, and the hook-shaped PVregion substantially moved over the center of cyclonesurface. With the head of the PV hook continuously overshadowing the surface cyclone center area, the hook shape of the upper-tropospheric PV became more pronounced, which indicates that the occluded front had reached its maturity.
5.3 Causality Relationship of PV Development and Occlusion
PV anomalies in the dynamic folding region of the tropopause,, the region in which the PV is larger than that of the surrounding air, are positive. Eq. (1) states that the absolute vorticity and static stability in the folding region are larger than those in the surrounding region. Hoskins (1997) revealed that isentropes, which are located closely but outside the anomaly region, should be separated, especially if the anomaly is not present. Isentropes decrease the static stability of the surrounding regions,, the upper- and lower-levels of the regions. The vorticity must be large because PV is conserved in an adiabatic and frictionless atmosphere (Hoskins, 2015). Thus, cyclonic circulation appears around the region of the positive vorticity anomaly (Fig.8a).
Hoskins (1997) also revealed that if a uniform PV fluid is present near a lower boundary with a warm anomaly, isentropic separation is enhanced, and the cyclonic motion must be similarly strengthened in the lower boundary region (Fig.8a).
In this case, upper-troposphericpositive PV anomalies and lower boundary warm anomalies appear during the rapidly-deepening period. Enhancements in cyclonic circulation provide positive feedback for PV amplification. After the PV tower is formed, the vertically aligned large PV promotes the development of cyclonic circulation throughout the troposphere (Fig.8b). The kinematic wrap-up process of cyclonic circulation also accelerates the formation of warm occlusion at the earth’s surface. Thermodynamic wrap-up proceeds at a faster rate at the middle- and upper-levels than near the earth’s surface, because cyclone occlusion may be considered a wrap-up process of thermal waves (Schultz and Vaughan, 2011). The high upper-tropospheric PV extends southward prior to the formation of the warm-occluded structure. Therefore, the upper and lower atmospheric dynamics and thermodynamics responsible for the development of the warm-occluded structure occur in a tandem fashion.
Hoskins(1985) suggested that high-PV regions in the vicinity of the tropopause are located above columns of relatively colder air and that low-value PV regions are located above columns of relatively warmer air. Martin (1998) further revealed that cold cutoff air masses aloft must be associated with upper-tropospheric positive PV anomalies in an atmosphere with approximate thermal wind balance. According to the findings of the current study, a dynamic consequence of the above scenario is that thermodynamic variables at the upper- and mid-tropospheric levels will generally be influenced by the circulation, which is associated with upper-tropospheric PV anomalies. If an isolated vortex is located at the tropopause with the northward and westward cyclonic advection of high equivalent potential temperatures, kinematic processes are necessary to form a horizontal warm-occluded structure at lower-levels of the troposphere. Therefore, this PV feature and equiv- alent potential temperature may be responsible for the asynchronous development of the warm-occluded structure. The characteristic of the upper-level PV distribution is a sufficient condition for the appearance of a warm-occluded structure at the near-surface level of the earth.
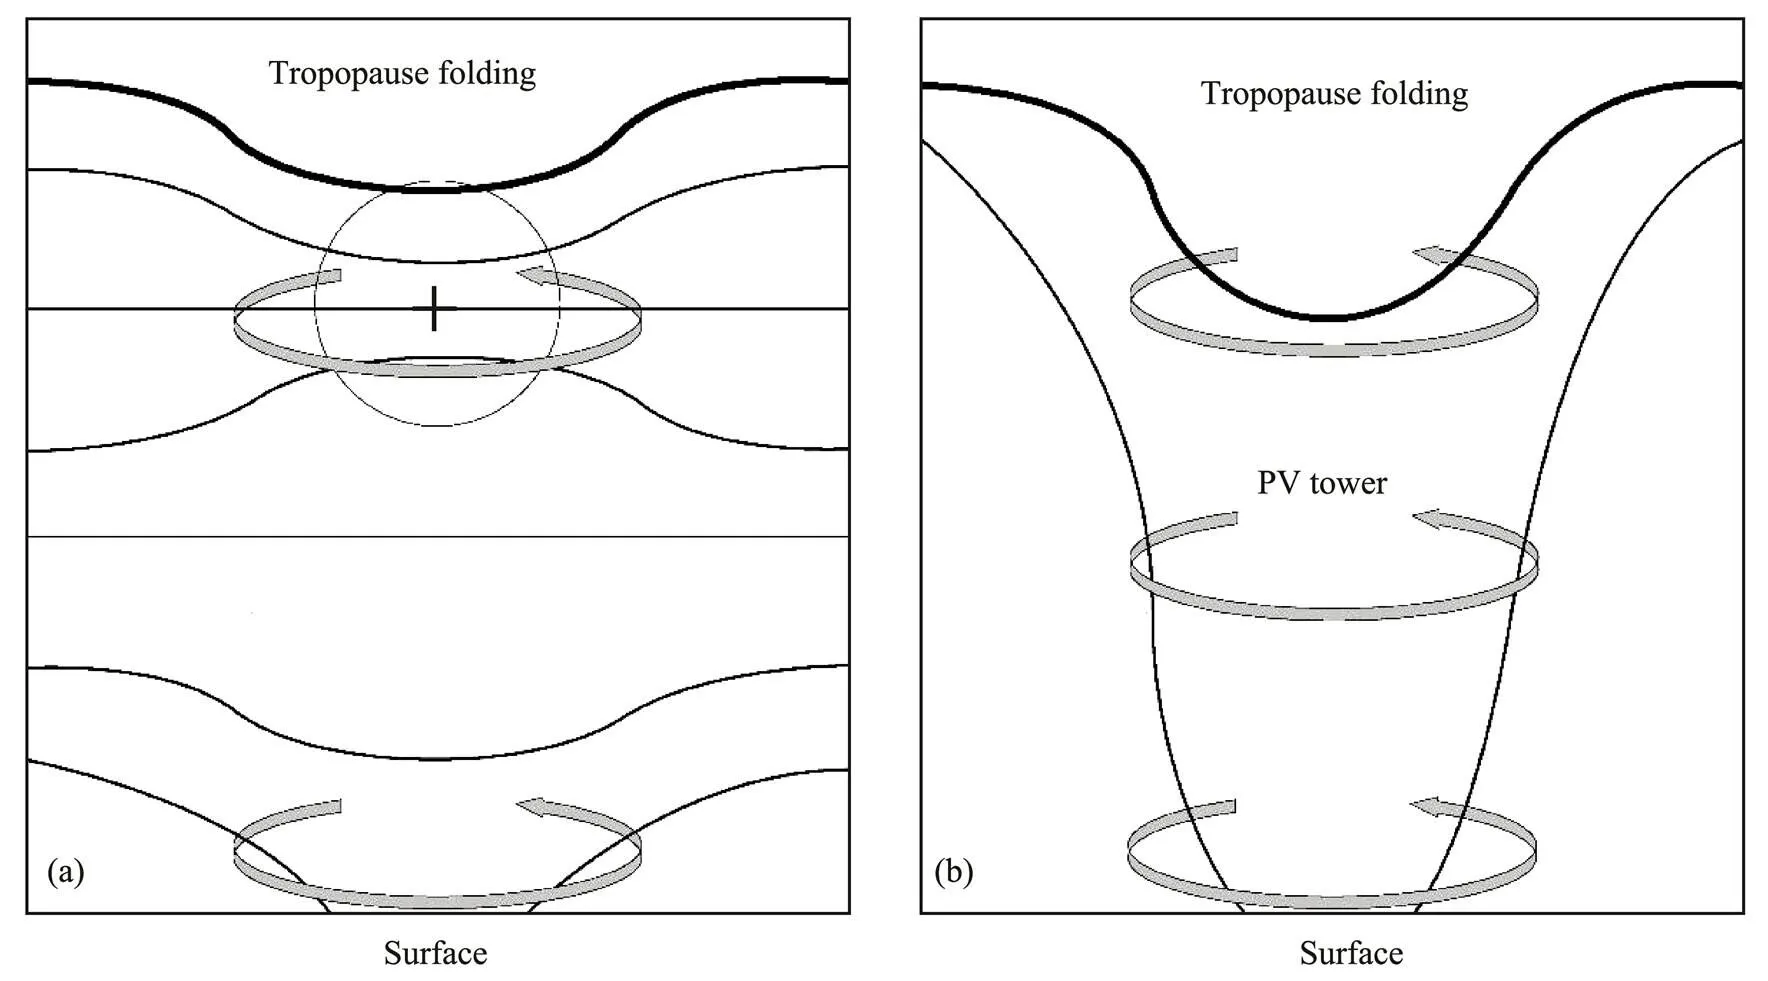
Fig.8 Vertical distributions of the PV and temperature anomalies with the corresponding circulation. (a), Isentrope and circulation of idealized positive PV anomalies (upper) and warm surface temperature anomalies (lower) (redrawn and adapted from Figs.6(a) and (c) of Hoskins, 1997). ‘+’, a positive PV anomaly. (b), Isentrope and circulation after the establishment of the PV tower.
Given these descriptions, the low-tropospheric thermodynamic structure is associated with the horizontal juxtaposition of the upper-tropospheric PV anomalies. The warm occlusion at the earth’s surface is a hydrostatic consequence of the extraordinary upper-tropospheric PV distribution. Our findings suggest that the morphological characteristics of the upper-tropospheric PV,, the hook-shaped PV structure, may predict the presence of a cyclone with a warm-occluded structure in the underlying troposphere.
6 Discussion
Fig.9 shows the distribution of positive PVs and potential temperatures in the present case. Most of the intense- ly-developed ECs in the northern hemisphere tilt westward,, a large upper-tropospheric positive PV and low potential temperature are usually located in the west of the cyclone center. The model in Fig.10 shows that a vertically coherent PV structure called the PV tower can reinforce cyclonic circulation in the upper- and low-levels of troposphere at explosively-deepening stage. The contours of potential temperature near the tropopause extend downward, indicating cold-air intrusion from the stratosphere to the upper troposphere. The strengthening of the upper-tropospheric baroclinicity favors the cyclone development. Thus, the westward-tilting and baroclinic model demonstrated in this study reflect a highly plausible mechanismthat could facilitate the explosive development of cyclones.
A region of convective instability (∂/∂)>0 resulting in a strong updraft in the eastern side of cyclone centercould be observed at lower portions of the troposphere (the shaded region in Fig.10). Fig.11 confirms that the negative-value center of vertical velocity is located in this region, especially below 600hPa. The strong convective instability in the region can produce heavy rainfall. The main rainfall region observed by the TRMM data indeed overlaps with the region of convective instability (Fig.12).
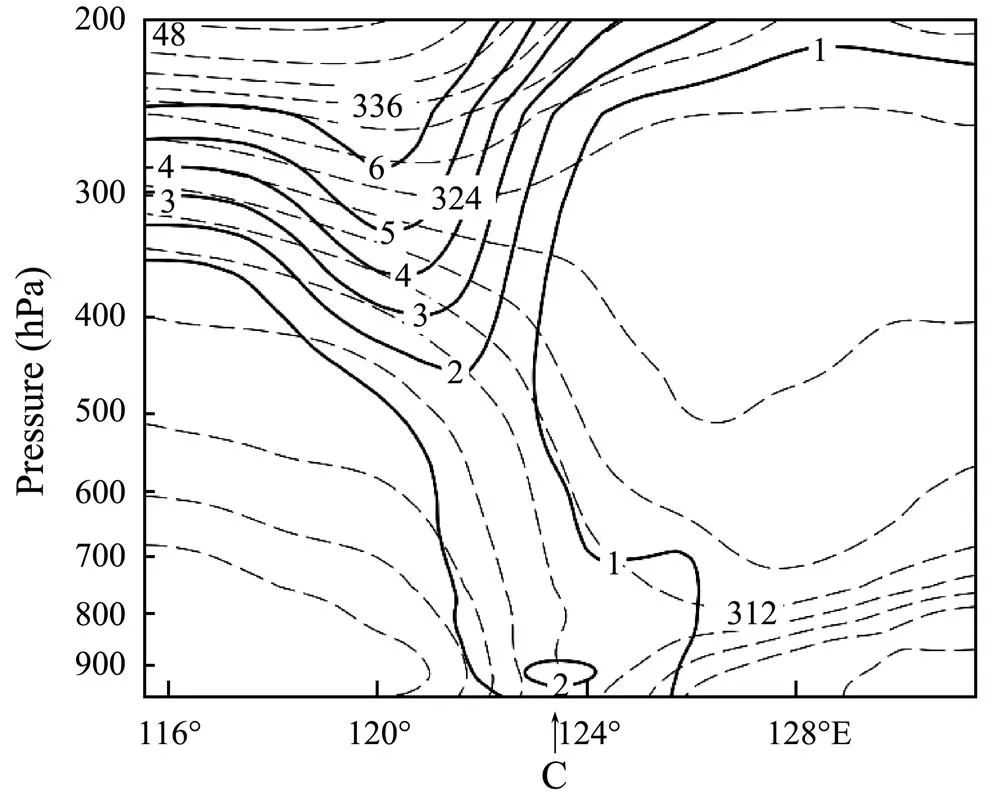
Fig.9 West-east cross-section of the PV (solid lines, PV≥1PVU, unit: PVU, contour interval: 1PVU) and equivalent potential temperatures (dotted lines, unit: K, contour interval: 4K) across the surface cyclone center at 12 UTC 24 November 2013. ‘C’ refers to the location of the surface cyclone center.
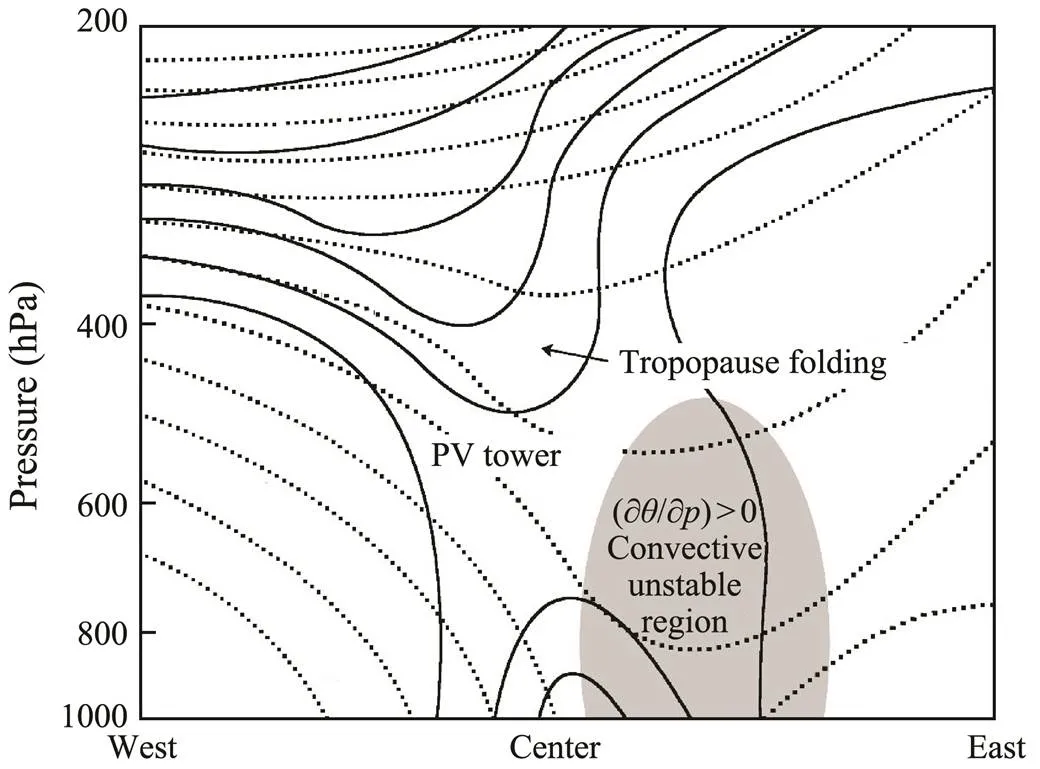
Fig.10 Schematic diagram of the distribution of the PV (solid lines) and equivalent potential temperatures (dotted lines) during the explosive deepening stage of the EC. The horizontal west-east distance is 1500km.
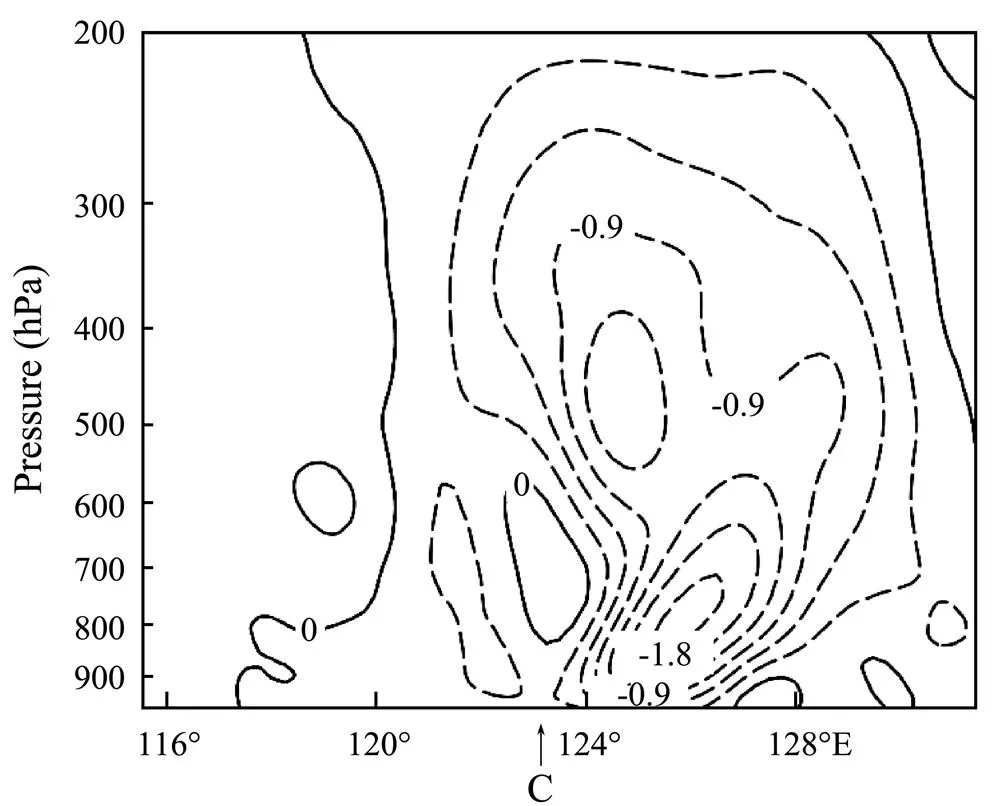
Fig.11 West-east cross-section of the vertical p-velocity (unit: Pas−1, contour interval: 0.2Pas−1) across the surface cyclone center at 12 UTC 24 November 2013. ‘C’ refers to the location of the surface cyclone center.
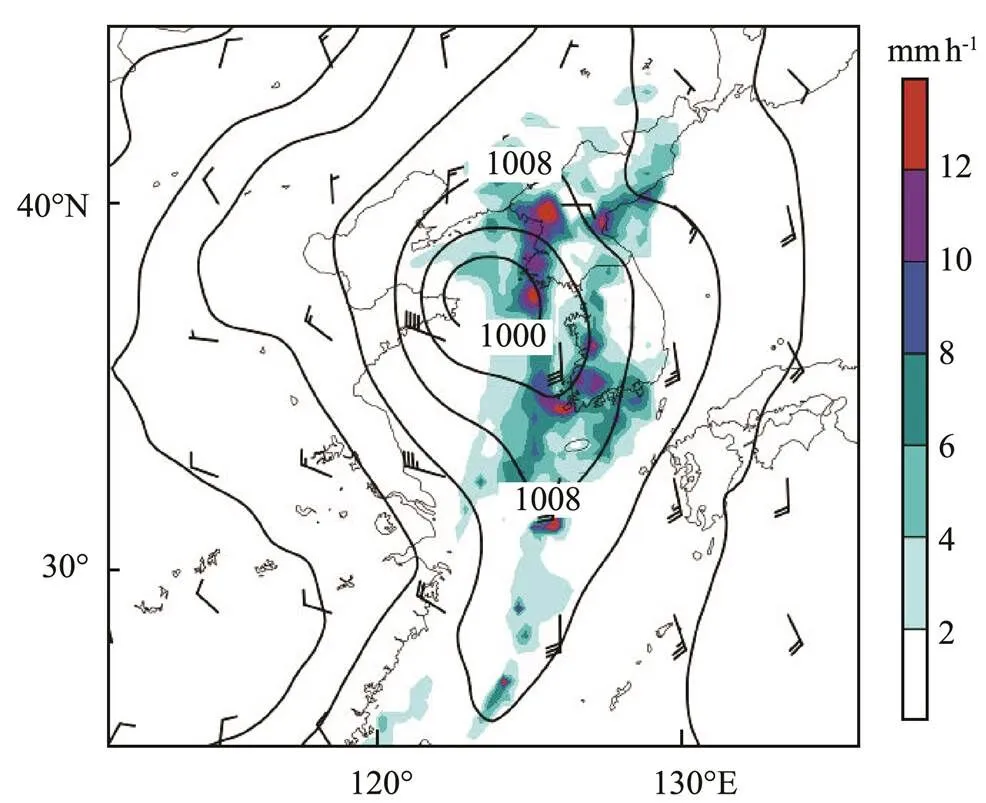
Fig.12 Horizontal distributions of precipitation (shaded, unit: mmh−1) provided by the TRMM 3B42 data and the SLP (solid lines, unit: hPa, interval: 4hPa) at 12 UTC 24 November 2013.
According to the discussion above, if the upper-level jet intensifies or the cyclone moves into the westerly jet belt, the momentum will propagate downward on account of the Ekman effect. The PV, which is closely related to momentum, will also propagate downward, and the high-value PV intrudes from the upper-level to the lower-level of troposphere. In terms of the PV, the isentropic surface in the anomaly region of the positive PV is close to the center of the anomaly, which leads to a widening of the space between the isentropic surfaces around the region and a decrease in the static stability of the surrounding region. Conservation of PV enhances the cyclonic vorticity and induces cyclonic circulation or cyclogenesis around the anomaly region. The low- and mid-tropospheric PVs are also enhanced. The positive vorticity increases synchronously, and the PV increases once more.A coherent vertical PV tower eventually forms to strengthen the cyclonic circulation from the low to the upper troposphere. This process represents the positive feedback mechanism of cyclone explosive deepening.
7 Conclusions
According to the analysis on the evolution of the upper-tropospheric PV, the upper-tropospheric PV appears with a high-value center in the upstream area, which occurs approximately several hours prior to the generation of the cyclone.
The vertical PV distribution indicates that the PV tower is formed approximately 12h prior to the occurrence of surface occlusion. The evolution of the surface fronts closely follows the development of the upper-tropospheric PV. The hook-shaped upper-tropospheric PV is nearly maintained along with the surface fronts. In particular, the surface fronts begin to form an occlusion as the head portion of the PV hookextends southeastward. The surface occlusion thenmatures as the hook shape becomes defined and the head portion of the PV hook cuts across the cyclone center area because the evolution of upper-tropospheric PV and the formation of PV tower can induce cyclonic circulation and sequentially reinforce the circulation. This kinematic wrap-up process of cyclonic circulation facilitates the formation of a warm occlusion at the earth’s surface as well. The time correspondence between the evolution of PV morphology and the frontogenesis at the surface is described in detail to help predict the development and movement of the surface front.
This study proposes the west-tilting and baroclinic model,which combines the perspectives of dynamic tropopause folding, PV tower, and atmospheric stability, to reveal the mechanism of the explosive development of ECs. In this model, upper-tropospheric baroclinicity is the main mechanism for the explosive development of the EC, which is located in west of the low-level convective instability region. These analyses are validated by the reanalysis data of the European Center for Medium-Range Weather Forecastsand the rainfall data of the TRMM.
Acknowledgements
This paper was financially supported by the National Natural Science Foundation of China (No. 41775042) and the China Bohai Rim Meteorological Science and Technology Collaborative Innovation Fund (No. QYXM201906). Dr. Chungu Lu was supported by the U.S. National Science Foundation’s Independent Research and Development Fund. The authors are grateful to the European Center for Medium-Range Weather Forecasts for providing the global reanalysis data and the TRMM for providing the precipitation data.
Bjerknes, J., 1919. On the structure of moving cyclones., 1: 1-8.
Bjerknes, J., and Solberg, H., 1921. Meteorological conditions for the formation of rain., 2:1-60
Bjerknes, J., and Solberg, H., 1922. Life cycle of cyclones and the polar front theory of atmospheric circulation., 3:1-18.
Čampa, J., and Wernli, H., 2012. A PV perspective on the vertical structure of mature midlatitude cyclones in the Northern Hemisphere.,69: 725-740.
Davis, C. A., and Emanuel, K. A., 1988. Observational evidence for the influence of surface heat fluxes on rapid maritime cyclogenesis., 116: 2649-2659.
Ertel, H., 1942. Ein neuer hydrodynamischer Wirbelsatz., 59: 271-281.
Hirata, H., Kawamura, R., Kato, M., and Shinoda, T., 2015. Influential role of moisture supply from the Kuroshio/Kuroshio Extension in the rapid development of an extratropical cyclone.,143: 4126-4144.
Hoskins, B., 1997. A potential vorticity view of synoptic development., 4: 325-334.
Hoskins, B.,2015. Potential vorticity and the PV perspective., 1: 2-9.
Hoskins, B., McIntyre, M. E., and Robertson, A. W., 1985. On the use and significance of isentropic potential vorticity maps., 111: 877-946.
Iwao, K., Inatsu, M., and Kimoto, M., 2012. Recent changes in explosively developing extratropical cyclones over the winter northwestern Pacific.,25: 7282-7296.
Kuo, Y. H., Low-Nam, S., and Reed, R. J., 1991. Effects of surface energy fluxes during the early development and rapid intensification stages of seven explosive cyclones in the western Atlantic.,119: 457-476.
Liang, Z., Lu, C., and Tollerud, E., 2010. Diagnostic study of generalized moist potential vorticity in a non-uniformly saturated atmosphere with heavy precipitation., 136: 1275-1288.
Liberato, M. L. R., Pinto, J. G., Trigo, R. M., Ludwig, P., Ordóñez,P., Yuen, D.,, 2013. Explosive development of winterstorm Xynthia over the subtropical North Atlantic Ocean., 13: 2239-2251.
Lim, E. P., and Simmonds, I., 2002. Explosive cyclone development in the Southern Hemisphere and a comparison with Northern Hemisphere events., 130: 2188-2209.
Martin, J. E., 1998. The structure and evolution of a continental winter cyclone. Part I: Frontal structure and the occlusion process., 126: 303-328.
Martin, J. E., and Otkin, J. A., 2004. The rapid growth and decay of an extratropical cyclone over the central Pacific Ocean.,19: 358-376.
Mass, C. F., and Schultz, D. M., 1993. The structure and evolution of a simulated midlatitude cyclone over land., 121: 105-117.
Novak, D. R., Colle, B. A., and Aiyyer, A. R., 2010. Evolution of mesoscale precipitation band environments within the comma head of Northeast U.S. cyclones., 138: 2354-2374.
Pang, H. J., and Fu, G., 2017. Case study of potential vorticity tower in three explosive cyclones over the eastern Asia., 74: 1445-1454, DOI: http://dx.doi.org/10.1175/JAS-D-15-0330.1.
Posselt, D. J., and Martin, J. E., 2004. The effect of latent heat release on the evolution of a warm occluded thermal structure., 132: 578-599.
Rice, R. B., 1979. Tracking a killer storm.,10: 106-107.
Rivière, G., Arbogast, P., Maynard, K., and Joly, A., 2010. The essential ingredients leading to the explosive growth stage of the European wind stormof Christmas 1999., 136: 638-652.
Rossa, A. M., Wernli, H., and Davies, H. C., 2000. Growth and decay of an extra-tropical cyclone’s PV-tower., 73: 139-156.
Rossby, C. G., 1940. Planetary flow patterns in the atmosphere., 66:68-87.
Sanders, F., 1986. Explosive cyclogenesis in the west-central North Atlantic Ocean, 1981–84. Part I: Composite structure and mean behavior., 114: 1781-1794.
Sanders, F., and Gyakum, J. R., 1980. Synoptic-dynamic climatology of the ‘Bomb’., 108: 1589-1606.
Saucier, W. J., 1989.Courier Corporation, New York, 271pp.
Schultz, D. M., and Mass, C. F., 1993. The occlusion process in a midlatitude cyclone over land., 121:918-940.
Schultz, D. M., and Vaughan, G., 2011. Occluded fronts and the occlusion process: A fresh look at conventional wisdom.,92: 443-466.
Shapiro, M. A., and Keyser, D. A., 1990. Fronts, jet streams and the tropopause. In:Newton, C. W., and Holopainen, E., eds., American Meteorological Society, 167-186.
Thorncroft, C. D., Hoskins, B. J., and McIntyre, M. E., 1993. Two paradigms of baroclinic-wave life-cycle behavior., 119: 17-55.
Wang, C. C., and Rogers, J. C., 2001. A composite study of explosive cyclogenesis in different sectors of the North Atlantic. Part I: Cyclone structure and evolution., 129: 1481-1499.
Yoshida, A., and Asuma, Y., 2004. Structures and environment of explosively developing extratropical cyclones in the northwestern Pacific region., 132: 1121-1142.
October 5, 2020;
February 4, 2021;
April 23, 2021
© Ocean University of China, Science Press and Springer-Verlag GmbH Germany 2022
. Tel: 0086-532-66781920
E-mail: fugang@ouc.edu.cn
(Edited by Xie Jun)
杂志排行
Journal of Ocean University of China的其它文章
- Probabilistic Methods for Reliability Assessment of Floating Structures Based on Extreme Wave Simulation
- Enzyme-Induced Carbonate Precipitation for the Protection of Earthen Dikes and Embankments Under Surface Runoff: Laboratory Investigations
- Isolation, Identification, and Quantitative Determination of Saponin in Apostichopus japonicus by HPLC-DAD
- Transcriptome Analysis of Pacific White Shrimp (Litopenaeus vannamei) Under Prolonged High-Salinity Stress
- Evaluation of the Bioavailability of Metals in Sediment from the Southern Coastal Wetland of the Qiantang Estuary by Using Diffusive Gradients in Thin Films Technique
- The Combined Effect of Plastic Particles Size and Concentration on Rotifers’ (Brachionus plicatilis) Performance
