Screening and comprehensive analysis of key genes in liver hepatocellular carcinoma based on bioinformatics
2022-02-04WANGRuiBAIHaotianLIYalanYANGJing
WANG Rui,BAI Hao-tian,LI Ya-lan,YANG Jing
1.Heilongjiang University of Traditional Chinese Medicine, Harbin 150040, China
Keywords:
ABSTRACT
1. Introduction
Hepatocellular carcinoma belongs to liver cancer. It is one of the malignant tumors of digestive system that pose a great threat to human life and health all over the world. In recent years, the global cancer statistics show that liver cancer ranks the top of the list of malignant tumors, from lung cancer, breast cancer and stomach cancer, from the perspective of incidence rate or mortality rate[1]. The incidence rate of incidence of cancer increased year by year[2], the incidence rate of liver cancer in 2007 was about 700 thousand. By 2017, the incidence rate of liver cancer had reached 950 thousand. The incidence of female was generally higher than that of men, and the mortality rate of men was about 2 times[3].Worldwidely, more than half of the incidence rate is from China,which shows that liver cancer is a serious threat to people's health.Liver cancer is generally divided into primary liver cancer and metastatic liver cancer[4]. There is no essential difference between primary liver cancer and hepatocellular carcinoma, which is difficult to treat, difficult to find, easy to metastasis and high mortality. Due to the hidden incidence of hepatocellular carcinoma, most of the patients found clinically are late stage patients[5]. At present, there are many clinical treatment methods for hepatocellular carcinoma,but the treatment effect is not very good and the survival rate is low.Even in developed countries, the survival rate is only about 3%[6].The widely accepted pathogenesis of hepatocellular carcinoma is a complex process involving multiple genes and affected by both heredity and environment. Among these pathogenic factors, the most important are hepatitis B virus and hepatitis C virus[7]. Therefore, the study of the pathogenesis of hepatocellular carcinoma and the related genes of hepatocellular carcinoma can promote the early diagnosis and treatment of hepatocellular carcinoma, and effectively alleviate the current situation of hepatocellular carcinoma. Existing literature reports show that the molecular mechanisms of hepatocellular carcinoma mainly include proto oncogene activation and tumor suppressor gene inactivation, abnormal activation of multiple molecular signaling pathways, abnormal expression of related proteins and growth factors in vivo[8]. The molecular mechanism of hepatocellular carcinoma is complex. At present, the most dominant signal pathway has not been found. Therefore, in recent years, more and more biological analysis methods have been applied to cancer research. Mining from gene chip through bioinformation technology can explore the pathogenesis of hepatocellular carcinoma from the molecular level.
In this paper, we use GEO to search hepatocellular carcinoma genes, and then screen hepatocellular carcinoma related expression genes. Then, we analyze go function and KEGG function, construct differential gene characteristics and protein interaction network,screen key genes, and clarify the differential expression of key genes, prognosis analysis and immune infiltration. It provides a new idea for the selection of prognostic biomarkers of hepatocellular carcinoma.
2. Materials and methods
2.1 Microarray data analysis
At GEO(https://www.ncbi.nlm.nih.gov/geo/)Input the search term"liver hepatecellular carcinoma" into the database to download the gene expression profile of gse109903. The expression profile is from Affymetrix GPL19057 platform and provided by Fong el.GSE109903 data included 28 samples, including 14 hepatocellular carcinoma samples and 14 normal control samples.
2.2 Screening differential genes
The downloaded sample data were grouped and named as hepatocellular carcinoma group and control group respectively.Biojupiter was introduced to process and screen the differential genes. Principal component analysis is a statistical method used to identify the global pattern of concentrated high-dimensional data. It is usually used to explore the high similarity of biological samples in RNA SEQ data sets[9]. The processed data were further screened to identify differentially expressed genes (DEGs). Set the condition log2 fold change 2, and the corrected data set condition P < 0.05 is used as the screening condition.
2.3 Functional analysis and pathway analysis of differential genes
Go analysis process exists in large-scale function enrichment and is a common research method in function enrichment research. Gene function can be divided into the following three steps: biological process (BP), molecular function (MF) and cellular component (CC).KEGG database is also widely used in the process of biomedical analysis, which contains a large number of data on genome,biological processes and diseases. Then, the David database is used for annotation analysis and pathway enrichment analysis of DEGs in this study. Among them, the screening conditions set in go analysis and KEGG analysis were P<0.05 and gene count>5.
2.4 Visualization of differential gene expression
L1000FWD database(https://maayanlab.cloud/l1000fwd/),it provides interactive visualization of gene expression characteristics induced by more than 16000 drugs and small molecules. It also supports coloring the characteristics through different attributes(such as cell type, time point, concentration) and drug attributes, so as to analyze the function of small molecules and the mode of action of drugs, so as to infer the affinity of drugs to the above different genes[10]. The obtained drug data were ranked from high to low according to the similarity score.
2.5 Construction of PPI interaction network
String database(https://string-db.org/)It is a website that can visualize protein interactions[11] and can be used to predict the analysis database of gene interaction network in EMBL[12]. The relationship between different genes can be visually analyzed. The protein network interaction map can be obtained by submitting the studied genes to the string database for protein interaction data analysis, setting a high confidence score (0.500) and hiding the nodes without interaction relationship. Screen the proteins related to hepatocellular carcinoma for further research.
2.6 Differential expression of key genes and prognostic analysis
GEPIA (http://GEPIA.cancer-pku.cn/index.html)It is an analysis tool using standard processing pathway, which is composed of thousands of tumor and normal tissue sample data[13]. In our study,GEPIA was used to compare the differential expression of genes between tumor and normal tissues, analyze the pathological stage,and finally analyze the related prognosis. It is generally considered that there is a significant difference between P<0.05.
Kaplan-Meier-plotter(http://kmplot.com/analysis/index.php?p=service&cancer= liver _ rnaseq)The mapping tool can carry out survival analysis for more than 54000 genes (mRNA, miRNA,protein) in 21 kinds of tumors, including breast cancer, ovarian cancer, hepatocellular carcinoma and gastric cancer. The mRNA expression of core genes screened in patients with hepatocellular carcinoma was analyzed by Kaplan Meier plotter. It was statistically significant when P<0.05[14].
2.7 Function prediction of key genes
GeneMANIA (http://www.genemania.org)It is a website with gene information and prioritization of genes for functional analysis, with high accuracy prediction algorithm[15]. Input the screened key genes into the platform, analyze the functions of the screened key genes,and infer the predictive value of the screened genes.
2.8 Relationship between key gene expression and immune infiltration level of hepatocellular carcinoma
TIMER2.0(https://cistrome.shinyapps.io/TIMER/),the infiltration of different immune cells and their clinical effects can be systematically evaluated through six main analysis modules[16]. The selected key genes were input through the "gene module" to generate a scatter diagram to observe the relationship between their expression and the level of immune invasion of hepatocellular carcinoma.
3. Results
3.1 Data processing and differential gene screening results
In principal component analysis, each point represents a selected sample, and different colors represent the control group and model group, thus forming an interactive three-dimensional scatter diagram.If the sample has a more similar gene expression profile, the distance will be closer in the three-dimensional space (Fig. 1). As shown in Fig 1, the expressions of the control group and the model group are independent of each other, so the next analysis can be carried out. After processing the obtained gene text, 1509 differentially expressed genes were screened, including 637 up-regulated genes and 872 down-regulated genes. Finally, the screened results were visually analyzed and volcanic map and cluster map were drawn(Fig. 2).
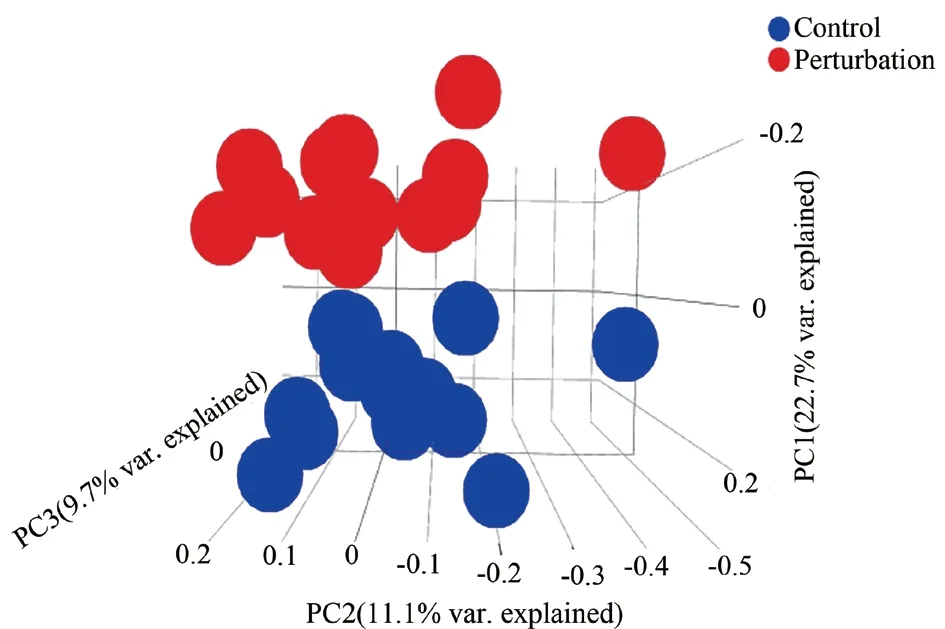
Fig1 Principal component analysis results
3.2 Functional enrichment of differential gene go and analysis results of KEGG pathway
After functional enrichment analysis and pathway analysis, the results are visualized (Fig. 3). After analyzing 1509 samples, the following results were obtained. Go enrichment analysis mainly includes three components. Firstly, the biological process (BP)enriched by differential genes includes positive regulation of transcription (DNA template) with DNA as template and positive regulation of transcription from RNA polymerase II promoter,Regulation of transcription (DNA templated), nucleosome assembly,chromatin assembly, nucleosome organization, mitochondrial ATP synthesis electron transport, Protein DNA complex assembly,respiratory electron transport chain, etc; The component analysis(CC) of differential genes mainly focused on nuclear body, nuclear chromatin, chromatin, focal adhesionx, nuclear chromatome part,nuclear speck, nuclear plast part, mitochondrial inner membrane,Mitochondrial respiratory chain complex I, nuclear periphery, etc;The molecular function (MF) of differential genes was analyzed as RNA binding, transcription coactivator activity, cadherin binding,RNA polymerase II core promoter proximal region sequence specific DNA binding, Protein kinase binding, RNA polymerase II transcription cofactor activity, activating transcription factor binding;Secondly, the pathways of differentially expressed genes were analyzed. The results are as follows: the main enrichment pathways of differentially expressed genes are related to systemic lupus erythematosus, alcoholism and other diseases, RNA polymerase I promoter opening and DNA methylation, Activated pkn1 stimulates the transcription of AR regulated genes klk2 and Klk3. The enriched genes and joint scores of each pathway are shown in the table(Tab.1).
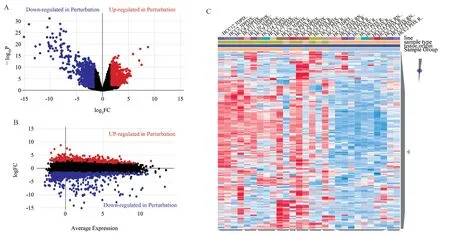
Fig2 Volcano map and heat map of differential gene clustering
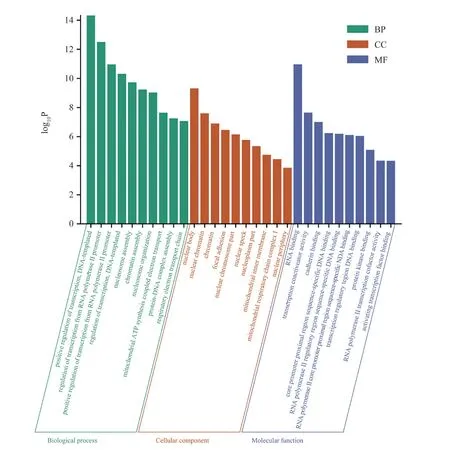
Fig3 GO enrichment analysis results of differential genes
3.3 Interactive visualization results of differential gene characteristic expression
L1000FWD platform can visualize the expression characteristics of more than 16000 drugs and small molecule induced genes.After introducing the differential gene into l1000FWD platform,the similarity results of small molecule and drug characteristics are obtained, as shown in Tab.2. Drugs with similar characteristicsof differential gene mainly include CDC inhibitor, prostaglandin,serotonin receptor antagonist, BAF transcription repressor, tyrosine phosphatase inhibitor, etc. After the data is processed, the shape represents the time point, the color represents the type of cells, and the fireworks diagram is drawn (Fig. 4).
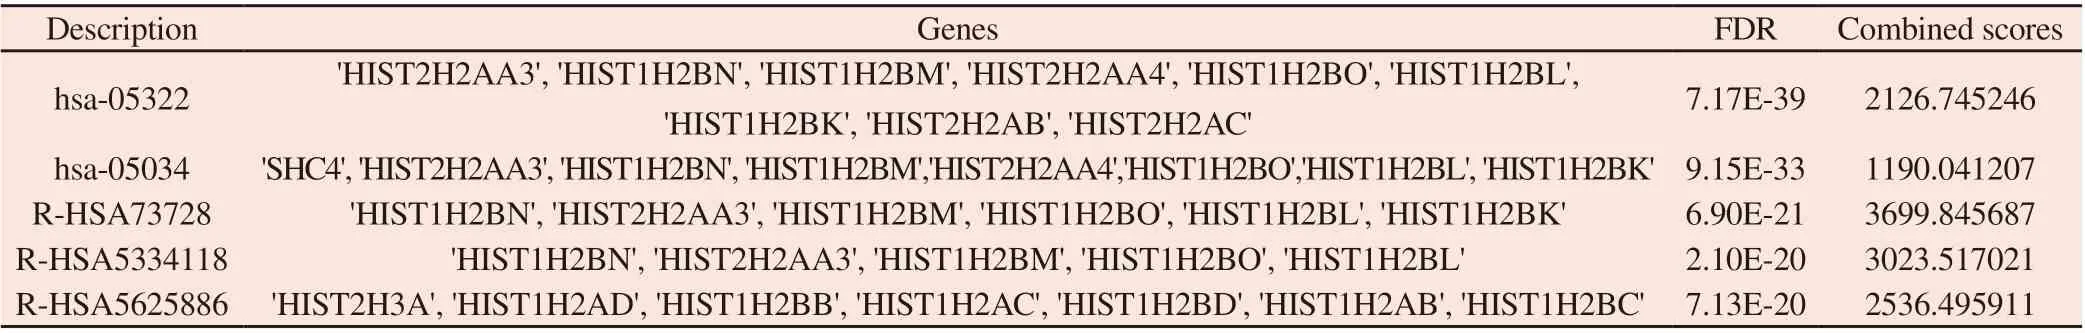
Tab1 KEGG pathway analysis
3.4 Visualization results of differential gene PPI network
out by using string database to explore the potential interaction between them. As expected, 160 nodes and 200 connections are obtained in the PPI network diagram. After removing the nodes without interaction relationship, the string connection diagram is drawn (Fig. 5). As shown in the Fig.5, the genes closely related to the occurrence and development of hepatocellular carcinoma are mainly EEF1A1, HK2, FAM38A, LAMB3, etc.
PPI network analysis of differentially expressed genes was carried

Fig4 Visual pyrotechnic map of the expression of differentially expressed genes
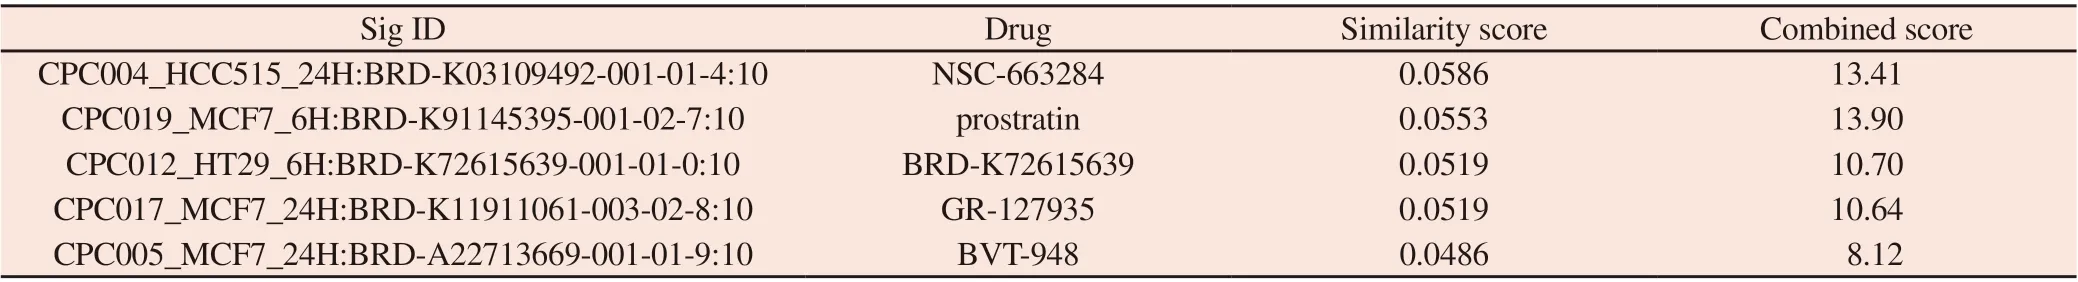
Tab2 Main drugs with similar characteristics with different genes
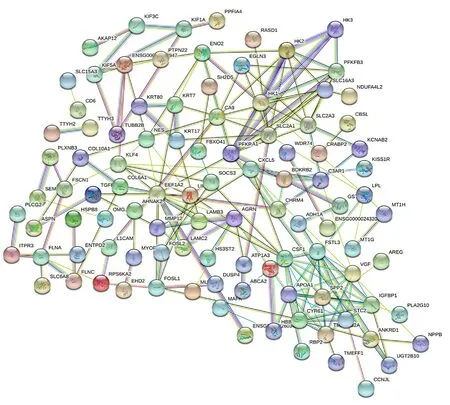
Fig5 Network diagram of different gene protein interactions
3.5 Different expression of EEF1A1and HK2 in patients with hepatocellular carcinoma
It can be seen from Fig. 5 that EEF1A1 is connected with 14 related proteins, with a total of 26 lines; HK2 was linked to 13 related proteins, with a total of 24 connections; Fam83a was connected with 8 related proteins, with a total of 22 lines; LAMB3 is connected with 5 related proteins, with a total of 18 lines. By comparing the degree of its internal network, we further analyzed the selected genes EEF1A1 and HK2, which are closely related to the occurrence and development of hepatocellular carcinoma.
Using the GEPIA data set, we compared the mRNA expression of EEF1A1 and HK2 in LIHC and normal hepatocytes. The results showed that the expression levels of EEF1A1and HK2 in hepatocellular carcinoma were higher than those in normal tissues(Fig.6). Next, we continued to evaluate the correlation between the expression difference of EEF1A1and HK2 and the pathological stage of patients with hepatocellular carcinoma. According to the violin diagram (Fig.7), the P values of EEF1A1and HK2 groups are less than 0.05, and the results are meaningful. The central points of EEF1A1and HK2 are not on the same straight line, and they all change significantly in the fourth stage, which proves that genes play an important role in this stage. The diagram shows that EEF1A1and HK2 may play an important role in the occurrence and development of hepatocellular carcinoma.
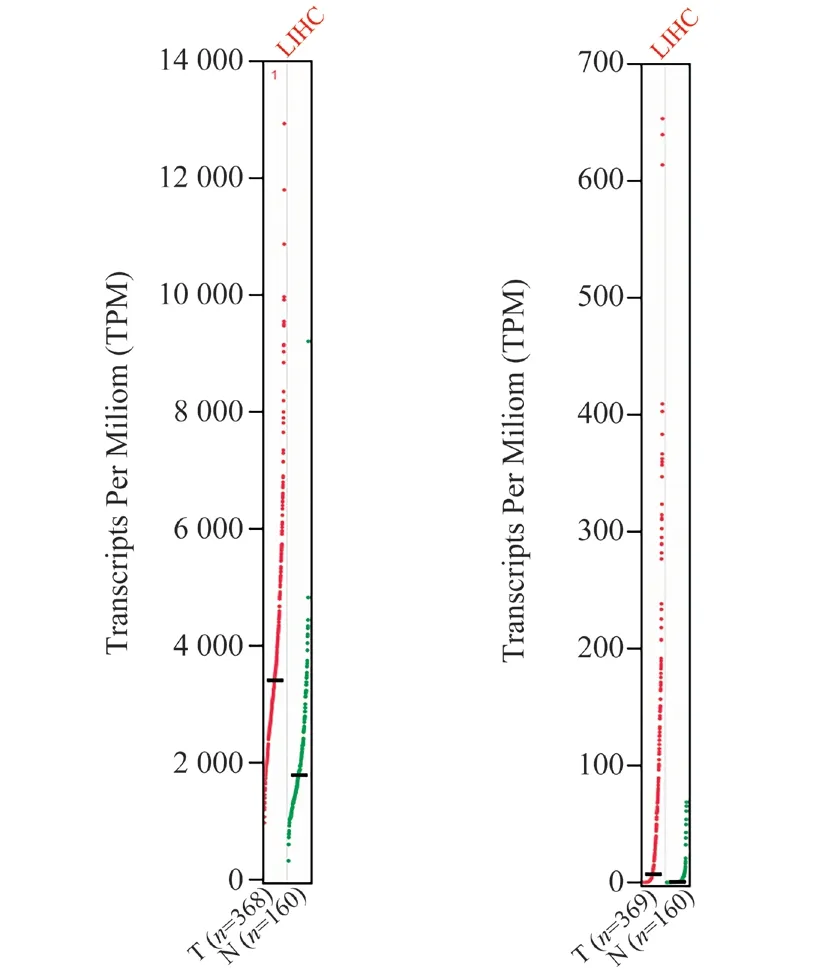
Fig6 Expression of EEF1A1 and HK2 in patients with liver hepatocellular carcinoma
3.6 Prognostic value of EEF1A1and HK2 expression in patients with hepatocellular carcinoma
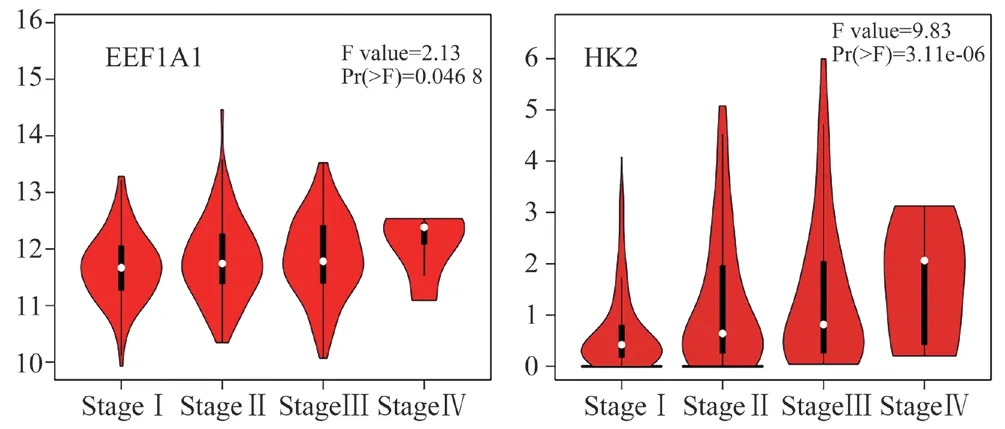
Fig7 Correlation between EEF1A1 and HK2 expression and tumor stage in patients with liver hepatocellular carcinoma
In order to evaluate the value of the expression of EEF1A1 and HK2 in the process of colorectal cancer, GEPIA was used to analyze the correlation between EEF1A1, HK2 and clinical results.(Fig. 8)shows the curve of disease-free survival (DFS) and overall survival (OS). Patients with high transcription level of EEF1A1(P= 0.036) were significantly correlated with short-term disease-free survival. Similarly, patients with high transcription level of HK2 (P= 0.02) were also significantly correlated with short-term diseasefree survival. It is proved that both EEF1A1 and HK2 are related to survival.
In addition, we also performed subgroup analysis of the model using the Kaplan Meier plotter mapping tool to obtain the prognostic value of EEF1A1 and HK2 in patients with hepatocellular carcinoma (Fig. 9). The expression of EEF1A1(HR = 0.8, P =0.03) and HK2 (HR = 1.82, P = 0.00086) mRNA in patients with hepatocellular carcinoma was significantly correlated with shortterm overall survival, which was the same as that obtained by GEPIA.
3.7 Prediction results of differential gene function analysis
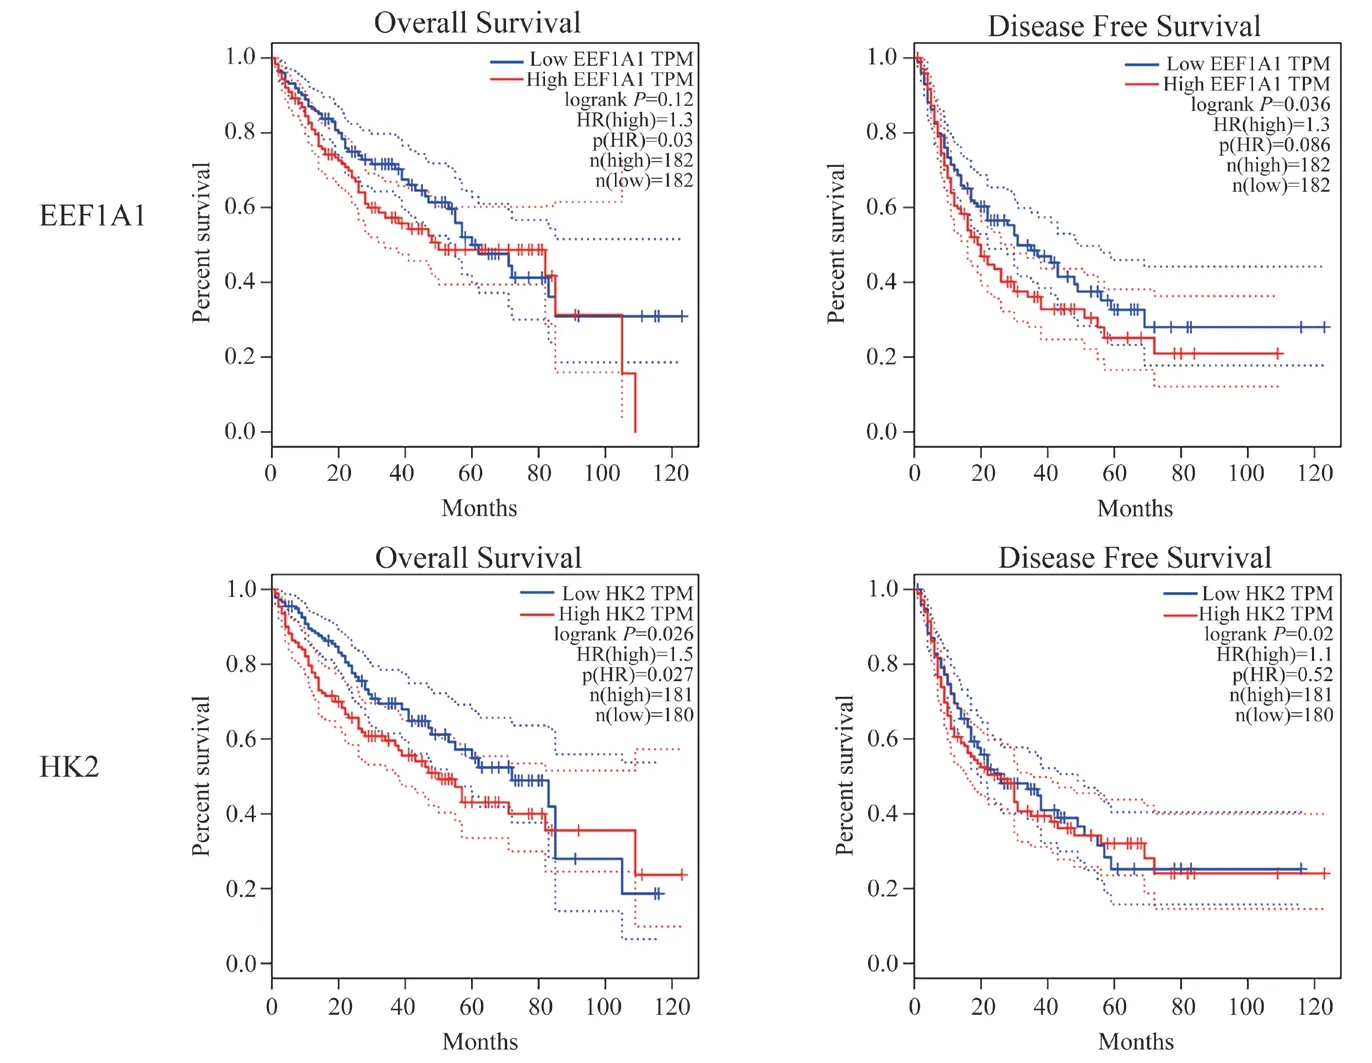
Fig8 Prognostic value of EEF1A1 and HK2 mRNA expression in liver hepatocellular carcinoma (GEPIA)

Fig9 Prognostic value of EEF1A1 and HK2 in liver hepatocellular carcinoma (Kaplan-Meier plotter)
EEF1A1and HK2 genes were input into the GeneMIANA platform respectively, and the interaction network diagram was obtained after processing (Fig.10). It can be seen from the Fig.10 that the results reflect the functions of differentially expressed genes EEF1A1and HK2 and the functions of genes similar to these two genes. For example, CHRM4, EEF1A2, ICA1 and GATA1 are also reflected in the string network interaction diagram. The Fig.10 shows the functionally similar parts of the selected genes and their similar genes. It is mainly related to translation factor activity, chaperone mediated autophagy, translation regulator activity, protein targeted endoplasmic reticulum and carbohydrate catabolism, purine nucleoside diphosphate metabolism, ADP metabolism, etc. Physical interaction accounted for 77.64%, and intergenic interaction accounted for 2.87%.
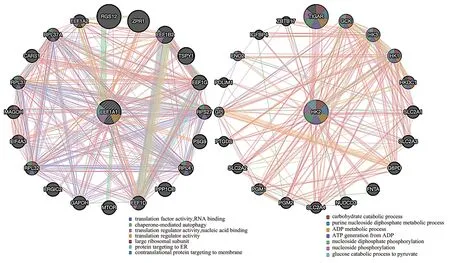
Fig10 Cluster analysis of key genes EEF1A1, HK2 and their similar genes
3.8 Immune cell infiltration of EEF1A1and HK2 in patients with liver cancer
The level of immune cells is related to the proliferation and development of cancer cells. In this study, we used TIMER2.0 database to explore the correlation between EEF1A1and HK2 immune cell infiltration. Input EEF1A1and HK2 into TIMER2.0 platform, and the results are shown in Fig.11. The expression of EEF1A1was positively correlated with the infiltration of B cells,CD8 + T cells, CD4 + T cells, macrophages and neutrophils in hepatocellular carcinoma. The expression of HK2 was positively correlated with the infiltration of macrophages and neutrophils in hepatocellular carcinoma, but not with the infiltration of B cells,CD8 + T cells, CD4 cells and dendritic cells .
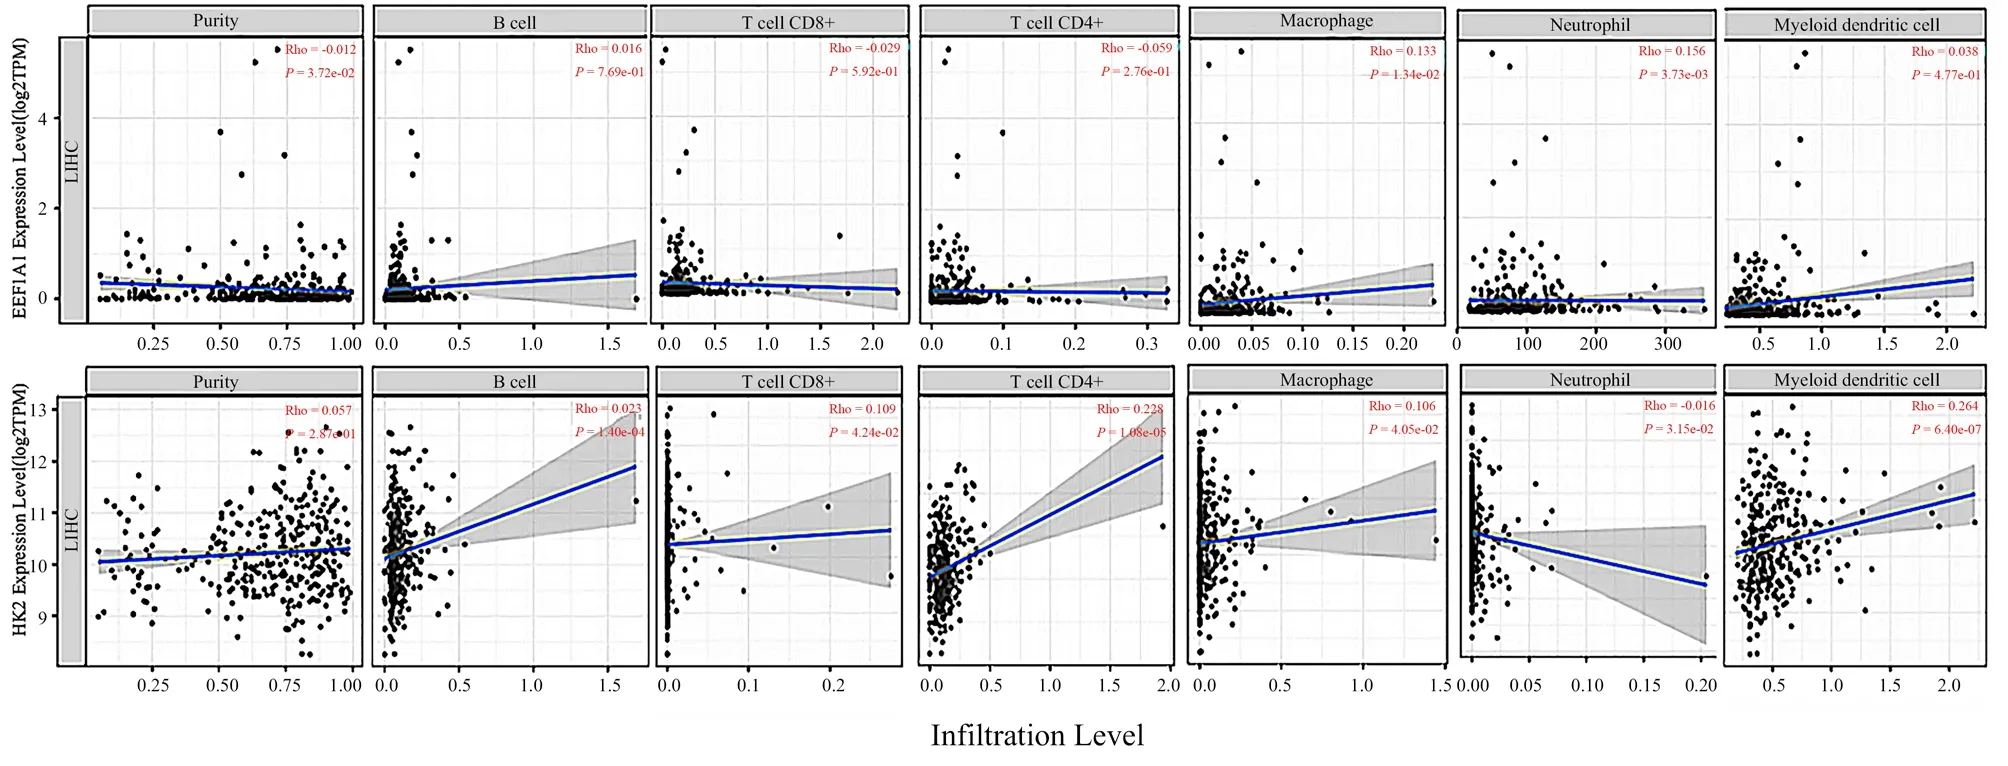
Fig11 Correlation between differentially expressed genes EEF1A1 and HK2 and immune cell infiltration
4. Discussion
As one of the malignant tumors that cause great harm to global health, hepatocellular carcinoma has shown an upward trend year by year. Due to its high degree of malignancy and easy recurrence,traditional treatment methods are difficult to improve the survival rate of patients with hepatocellular carcinoma, and due to the influence of genetic factors, the treatment methods of hepatocellular carcinoma have attracted extensive attention[17-18], Therefore, it is urgent to study the pathogenesis and related genes of hepatocellular carcinoma. With the development of bioinformatics, it provides great possibility and great convenience for studying the pathogenesis of hepatocellular carcinoma, exploring new targets, inventing new treatment methods and improving the survival rate of patients. In this study, using the rich data information of geo database, a total of 1509 differentially expressed genes were screened by bioinformatics technology, and the number of up-regulated and down-regulated genes were 637 and 872 respectively. PPI network visual analysis screened four genes closely related to hepatocellular carcinoma,including EEF1A1, HK2, fAM38A and LAMB3. Through node relationship comparison, it is clear that the core genes significantly related to hepatocellular carcinoma are EEF1A1and HK2. According to GEPIA and Kaplan-Meier plotter databases, the screened genes are closely related to the pathological stage and prognosis of hepatocellular carcinoma. GeneMANIA database shows that key genes are mainly related to translation factor activity, chaperone mediated autophagy, translation regulator activity, protein targeted endoplasmic reticulum and carbohydrate catabolism, purine nucleoside diphosphate metabolism, ADP metabolism, etc. Finally,through the analysis of TIMER2.0 database, it was found that the two genes were positively correlated with different immune cell infiltration in cancerous tissues. The differential expression,prognostic value and immune cell infiltration of EEF1A1 and HK2 in patients with hepatocellular carcinoma were further clarified. The results showed that EEF1A1 and HK2 mRNA were significantly expressed in HCC cells than in normal tissues, which may be potential prognostic biomarkers for the survival of HCC patients.
EEF1A1 is a trigger for protein translation extension[19-20],.which can participate in cell biological behavior, express significantly in a variety of cancer cells, and significantly inhibit the proliferation,invasion and migration of tumor cells. Zhou Shuting et al.[21]studied the effect of EEF1A1 on HCC HCA-P cells through RNA interference technology related experiments, and further analyzed the mechanism involved in regulation. The results showed that shRNA targeting EEF1A1could reduce the expression of EEF1A1, and low expression of EEF1A1could induce apoptosis and inhibit proliferation and migration of HCC cells. The regulation mechanism showed that EEF1A1 was closely related to ANXA7, It can participate in the regulation of tumorigenesis. The results also showed that the expression of EEF1A2 decreased with the decrease of EEF1A1,and the two were highly correlated. Qiu FN et al.[22] detected the expression of EEF1A2 in 62 HCC tissue samples and hepatocellular carcinoma by real-time PCR and immunohistochemistry. The results showed that EEF1A2 could effectively silence the proliferation,migration and invasion of cancer cells, promote the increase of apoptosis of liver cancer cells and induce cell cycle arrest.EEF1A2 reduces the occurrence of hepatocellular carcinoma by inhibiting P13K/Akt/ NFKB signaling pathway. HK2 is the first key rate limiting enzyme in the glycolysis pathway of the body. Its combination with mitochondrial outer membrane voltage dependent cation channel protein can promote the occurrence of glycolysis and the formation of tumor cells[23]. Inhibiting the expression of HK2 can inhibit the increase of tumor in tumor cells and animal models.Zhang Yu et al.[24] detected the expression of HK2 in 48 liver cancer tissues by immunohistochemistry, A series of experiments such as statistical analysis explored the relationship between HK2 and hepatocellular carcinoma. The results showed that HK2 was highly expressed in hepatocellular carcinoma, which could significantly reduce the value-added activity of hepatoma cells, make the cell cycle stagnate in S phase and promote the apoptosis of hepatoma cells. Finally, it was proved that HK2 showed strong antitumor effect and had certain clinical significance, It also lays a foundation for our further study on the survival relationship between HKs family and hepatocellular carcinoma.
In conclusion, this experiment uses bioinformatics and gene chip to explore the differentially expressed genes of hepatocellular carcinoma. After preliminary analysis of the genes, we get the signal pathways and functions involved in the genes, and further screen the key genes EEF1A1 and HK2, so as to provide potential prognostic biomarkers for the survival of patients with hepatocellular carcinoma, To provide theoretical support, new ideas and schemes for the clinical treatment and mechanism research of hepatocellular carcinoma, but more rigorous and reliable experiments are still needed for verification and analysis.
Description of the author's contribution: the design idea of this paper is provided by professors Wang Rui and Yang Jing; Bai Haotian is responsible for target screening, pathway analysis and differential gene expression analysis; Li Yalan is responsible for data visualization and data processing.
杂志排行

Journal of Hainan Medical College的其它文章
- Research progress on depression models of different strains of rats and mice
- Study on TCM intervention of NF-κB signal pathway in the treatment of bronchial asthma
- Meta-analysis of the clinical efficacy of Liqi Huoxue drop pill in the treatment of angina pectoris in coronary artery disease
- Systematic review and meta-analysis on efficacy of traditional Chinese medicine in treatment of inflammatory factors in patients with poststroke depression
- Mechanism of Gan Dou Ling in improving liver fibrosis in Wilson disease based on network pharmacology and experimental verification
- Design and characterization of a bi-functional bybrid antibacterial peptide LLM against Pseudomonas aeruginosa