Demands and technical developments of clinical flow cytometry with emphasis in quantitative,spectral,and imaging capabilities
2022-02-01TingZhangMenggeGaoXiaoChenChiyuanGaoShilunFengDeyongChenJunboWangXiaosuZhaoandJianChen
Ting Zhang, Mengge Gao, Xiao Chen, Chiyuan Gao, Shilun Feng, Deyong Chen,,5 Junbo Wang,,5,a)Xiaosu Zhao,,a)and Jian Chen,5,a)
ABSTRACT As the gold-standard method for single-cell analysis,flo cytometry enables high-throughput and multiple-parameter characterization of individual biological cells.This review highlights the demands for clinical flo cytometry in laboratory hematology(e.g.,diagnoses of minimal residual disease and various types of leukemia),summarizes state-of-the-art clinical flo cytometers(e.g.,FACSLyricTM by Becton Dickinson,DxFLEXby Beckman Coulter),then considers innovative technical improvements in flo cytometry(including quantitative,spectral,and imaging approaches)to address the limitations of clinical flo cytometry in hematology diagnosis.Finally,driven by these clinical demands,future developments in clinical flo cytometry are suggested.
KEYWORDS Clinical demand,Clinical flow cytometry,Quantitative flow cytometry,Spectral flow cytometry,Imaging flow cytometry
I.INTRODUCTION
Flow cytometry(FCy)is a precision technique in which single cells labeled with fluorescen probes travel rapidly through multiple laser beams,and the corresponding light scatterings and fluorescenc emissions are captured by optical detectors.As the gold-standard technique for single-cell analysis,FCy enables highthroughput and multiple-parameter characterization of individual biological cells,which then allows cells to be separated and sorted into subpopulations.
Historically,the firs flo cytometer(FCr)was the ICP 11(ICP stands for impulse cytophotometer)developed in 1968 by Partec,in which light absorption was used for optical characterization.In 1971,Bio/Physics Systems developed the Cytofluorograp FCr,which measured forward light scattering and two fluorescenc emissions.In 1974,Becton Dickinson commercialized the FACS II FCr,which integrated single-cell optical measurements and physical sorting based on droplet deflection
Since the 1980s,FCr manufacturers have competed over how many parameters can be measured simultaneously.Specifically in the 1980s,the EPICS C FCr of Coulter Electronics and the FACScan FCr of Becton Dickinson were capable of three-color analysis;then in the 1990s,simultaneous measurements of seven fluorescen markers were achieved by the PAS-III FCr of Partec;and in the 2000s,the LSR II FCr of Becton Dickinson could sample 14 parameters of single cells.Currently,the best FCrs can measure ca.50 parameters simultaneously by using ca.10 lasers(e.g.,the FACSymphony A5 FCr of BD Biosciences).
In this review,the demands for clinical FCy in laboratory hematology[e.g.,for diagnosing minimal residual disease(MRD)and various types of leukemia]are introduced in detail,followed by details about state-of-the-art instruments for clinical FCy(e.g.,the FACSLyricTMFCr of Becton Dickinson and the DxFLEX FCr of Beckman Coulter)to meet these clinical demands.Then,innovative technical improvements in FCy including quantitative,spectral,and imaging approaches are included to address the limitations of clinical FCy in hematology diagnosis.Finally,driven by these clinical demands,future developments in clinical FCy are suggested.In Fig.1,the key points including clinical demands,state-of-theart technical capabilities,and challenges and future directions are summarized as a framework.
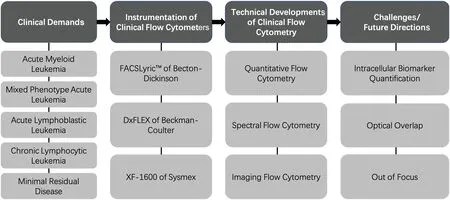
FIG.1.Framework of key points of present review,including clinical demands, state-of-the-art technical capabilities,and challenges and future directions.
II.CLINICAL DEMANDS
The demands for clinical FCy are mainly for diagnosing acute myeloid leukemia(AML),mixed phenotype acute leukemia(MPAL),acute lymphoblastic leukemia(ALL),chronic lymphocytic leukemia(CLL),and MRD,for which clinical FCy with three lasers and ca.10 colors is generally used to characterize the expression status of the surface or intracellular antigens of hematopoietic cells,leveraging a combination of multiple antibodies with various fluorescenc markers(see Table I).1–3
In the clinical classificatio of AML,the antibodies CD34,CD117,HLA-DR,and CD45 are“skeleton”antibodies for clinical FCy.Other myeloid markers such as cytoplasmic myeloperoxidase(cyMPO),CD13,CD33,and CD38 distinguish normal and abnormal hematopoietic cells,playing key roles in myelodysplastic syndrome-transformed AML.In addition,myeloid markers(CD11b,CD15,CD64,and CD65),monocytic markers(CD14,CD36,CD64,CD4,CD38,and CD11c),megakaryocytic markers(CD41,CD61,and CD36),and erythroid markers(CD235a,CD71,and CD36)are included for precise diagnosis of AML.
In MPAL,the expressions of cyMPO,CD3,and CD19 play key roles in determining the differentiation characteristics of myeloid and T/B-lineage leukemia cells,respectively.Among myeloid molecular markers,cyMPO is positive or two or more monocytic markers(CD14,CD11C,CD36,CD64,lysozyme)are positive,indicating the existence of myeloid phenotype leukemia cells.For B-lineage of MPAL,the diagnosis meets the requirements of strong CD19 with at least one B-lineage molecular marker(CD79a,cell surface or cytoplasm CD22,CD10)strongly expressed,or weak CD19 with at least two B-lineage molecular markers strongly expressed.T-lineage of MPAL is diagnosed by high expressions of CD3 in the cytoplasm or cell surface.
As for other types of leukemia,marker combinations of CD19,CD79a,and CD22 are used to diagnose B-lineage ALL,while CD3,CD2,CD7,and CD1a are used to classify T-lineage ALL based on FCy.When CLL is diagnosed,typical immunophenotypes of FCy include CD19+,CD5+,CD23+,CD200+,CD10-,FMC7-,CD43+,and weak expressions(dim)of CD20 and CD79b.
MRD refers to the residual tumor cells that cannot be detected by morphology and other traditional methods after achieving the hematological complete remission of hematologic malignancies.FCy detects MRD by analyzing the expression patterns of a series of cell-surface or intracellular antigens to identify the immunophenotypes that appear only in leukemia cells and either do not exist or have a very low proportion in normal bone marrow cells,i.e.,leukemia-associated immunophenotypes(LAIPs).
The antigens selected for the detection of MRD are of three main types.First,the antigens used for gate setting are a series of highly sensitive antigens that can preliminarily delineate all cells in a certain series,such as cytoplasmic CD3(cyCD3)or CD7 of T-lineage,CD19 of B-lineage,CD117 of myeloid,and CD38 and CD138 of plasma cells.Second,there are those antigens that identify early differentiation of the corresponding series,recognizing the series of primitive and naive cell populations and subtypes,such as CD45,CD10,CD34 and nuclear TdT(nTdT)of B-lineage,CD3,CD34,nTdT,CD99 of T-lineage,and CD34,CD117,HLA-DR,and CD38 of myeloid.Third,there are leukemia-related abnormal antigens can distinguish leukemia cells from the corresponding series of normal immature cells,referring mainly to the antigens involved in LAIPs.

TABLE I.Summary of demands for clinicalflow cytometry(FCy).

TABLE II.Summary ofkey performance details ofcommercially available clinical,spectral,and imaging flow cytometers(FCrs).
III.CLINICAL FLOWCYTOMETERS
A.FACSLyricTM
FACSLyricTMby BD Biosciences is a state-of-the-art clinical FCr that can quantify 12 colors based on three lasers of blue,red,and violet with a beam spot of 9μm×63μm in an ellipse.The flo cell is made of stainless steel with a low coefficien of thermal expansion and is aligned with the measurement quartz cuvette with an internal cross section of 430μm×180μm.This instrument runs at a throughput of 35 000 events per second with sensitivities of<85 MESF(molecules of equivalent soluble fluorochrome for fluo rescein isothiocyanat(FITC)and<20 MESF for phycoerythrin(PE)(see Table II).
B.DxFLEX
DxFLEX by Beckman Coulter is a state-of-the-art clinical FCr that can quantify 13 colors based on three lasers of blue,red,and violet with a beam spot of 5μm×80μmin an ellipse.The alignmentfree integrated-optics quartz flo cell has an internal cross section of 420μm×180μm,and this instrument runs at a throughput of 30 000 events per second with sensitivities of<30 MESF for FITC and<10 MESF for PE(see Table II).
C.Others
XF-1600 by Sysmex is a state-of-the-art clinical FCr that can quantify 10 colors based on three lasers;this instrument runs at a throughput of 50 000 events per second with sensitivities of<100 MESF for FITC,<50 MESF for PE,and<100 MESF for allophycocyanine(APC)(see Table II).NovoCyte by Agilent is a state-of-theart clinical FCr than can quantify 11 colors based on three lasers,and this instrument runs at a throughput of 35 000 events per second(see Table II).
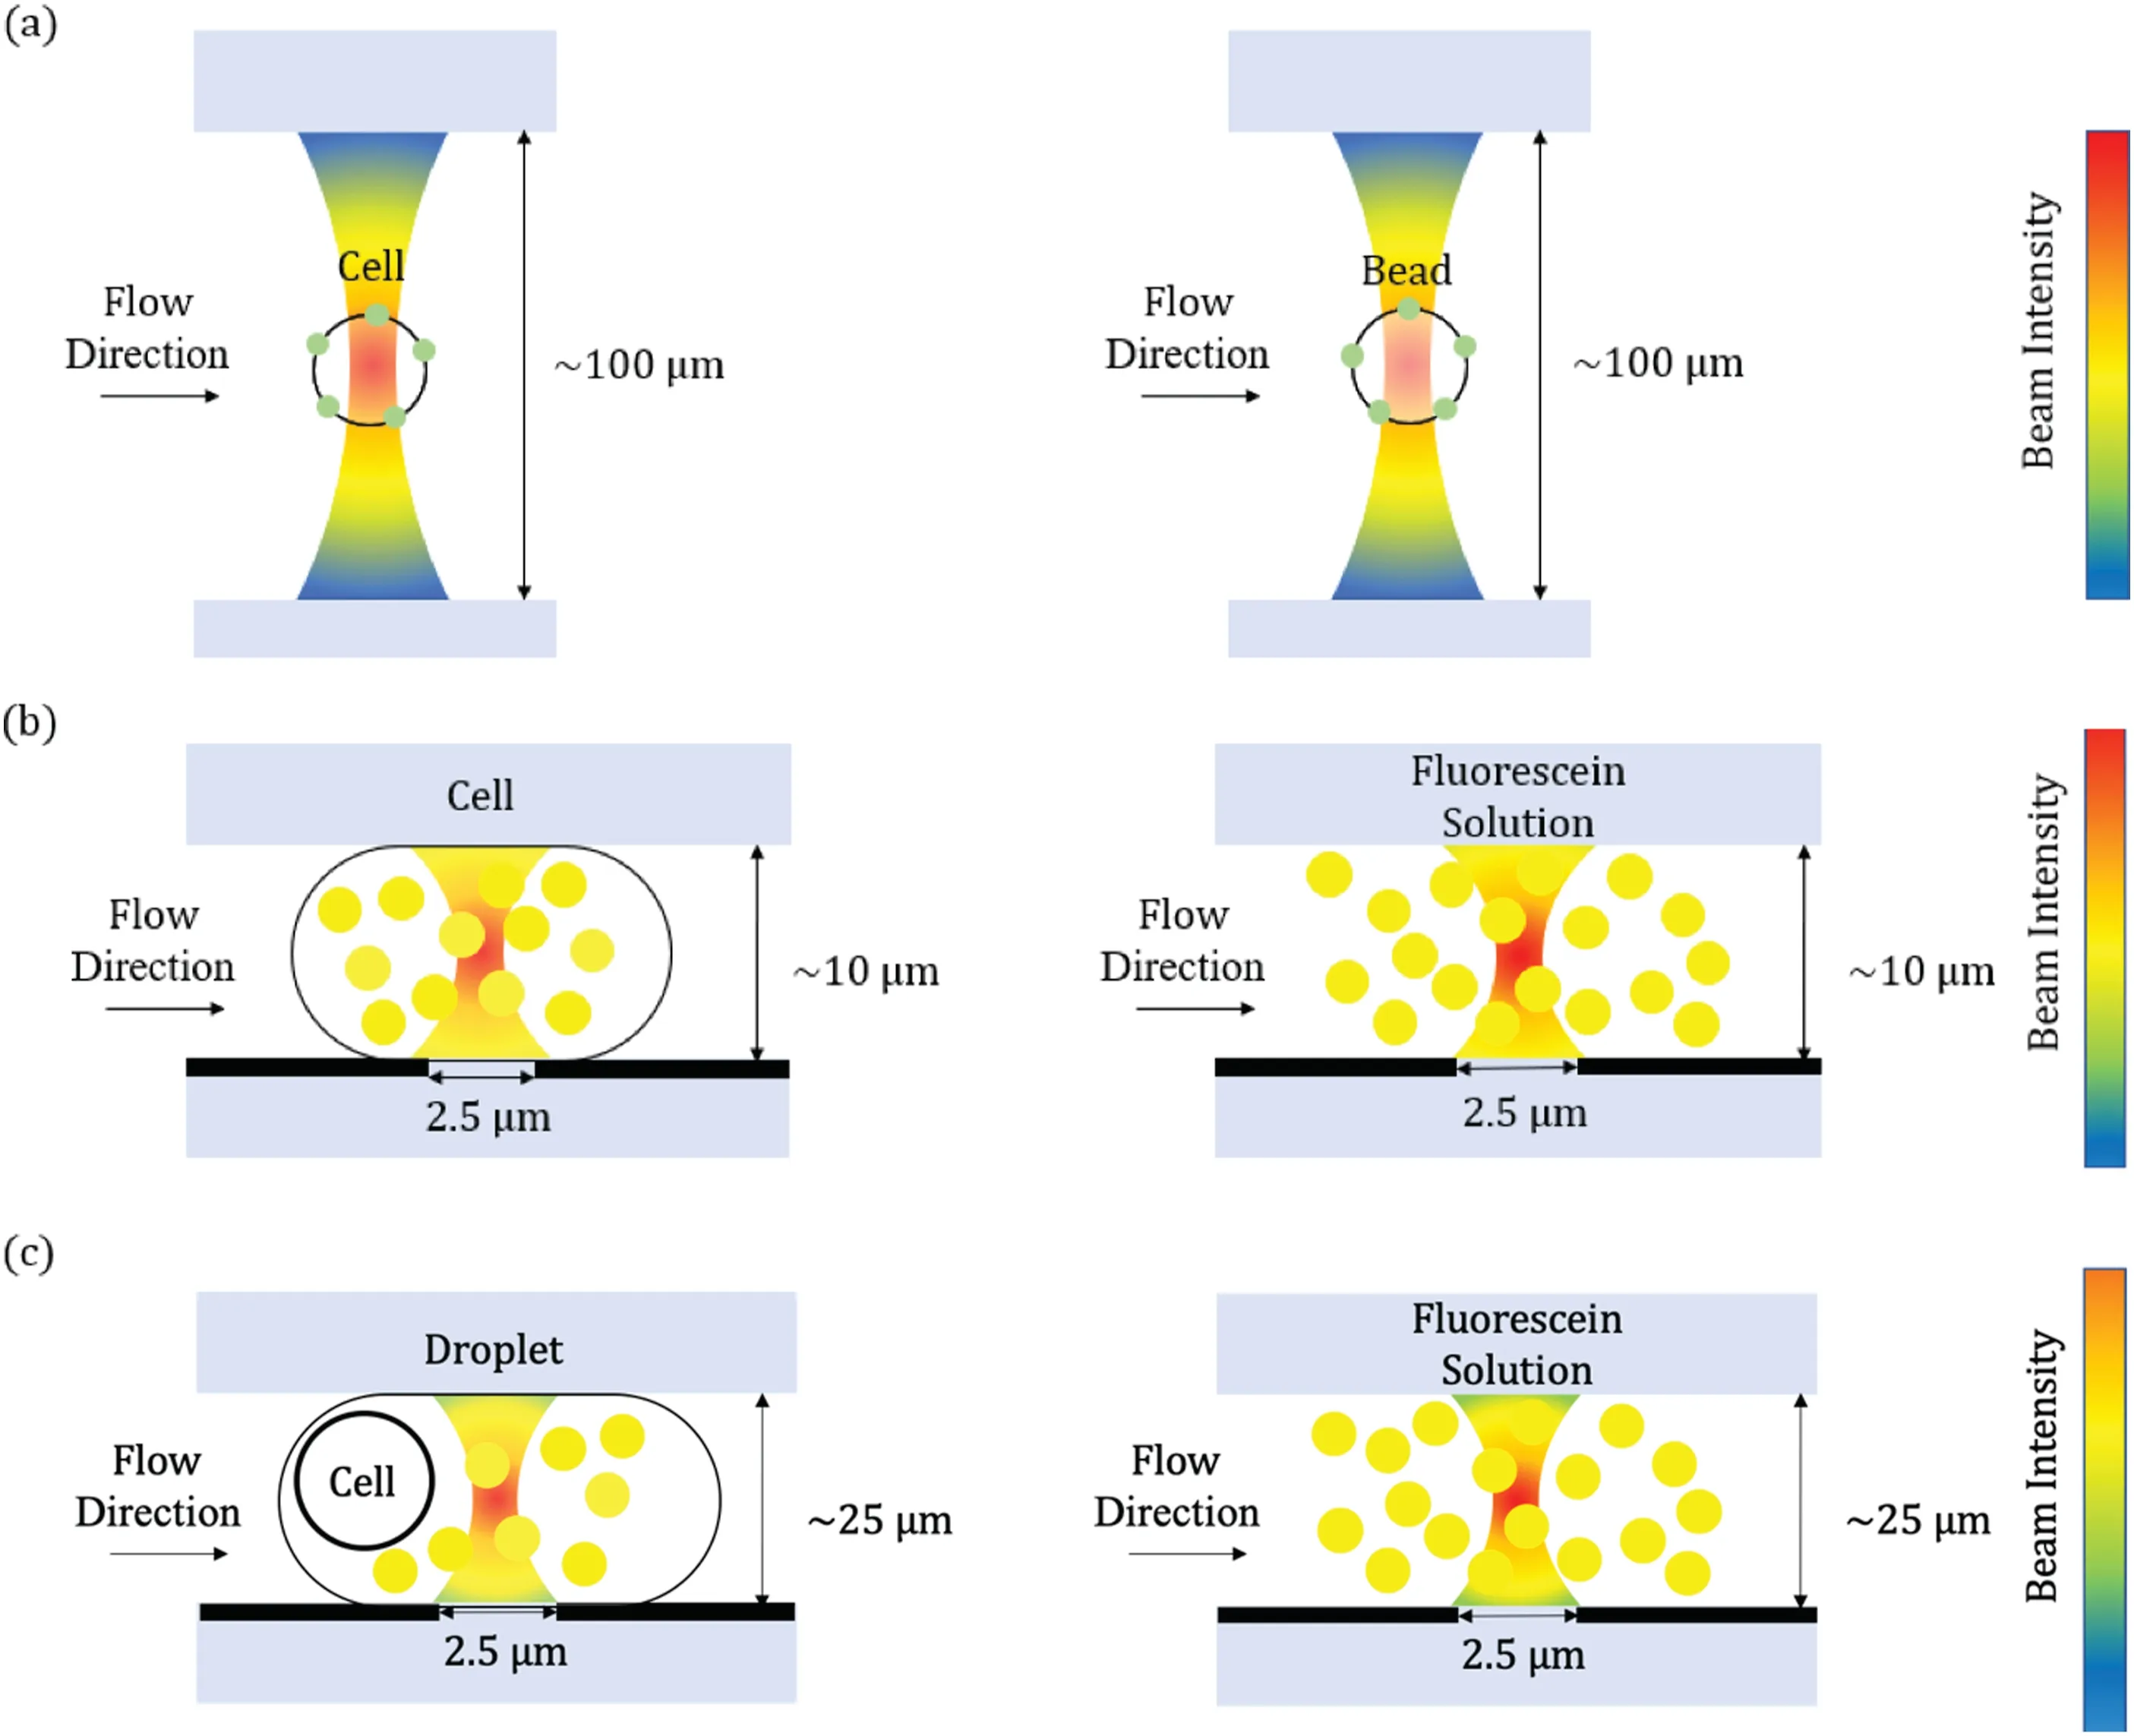
FIG.2.Key technical developments in quantitative FCy:(a)calibration microbeads for quantitative analysis of specific membrane proteins;(b)constriction microchannels for quantitative analysis of specific intracellular proteins;(c)droplet microfluidics for quantitative analysis ofboth membrane and intracellular proteins.
IV.CUTTING-EDGE DEVELOPMENTS
Although clinical FCy has been developed for decades,it still has several key technical limitations,i.e.,(i)its results are usually qualitative rather than quantitative,(ii)it suffers from spectral overlaps,and(iii)it cannot capture cell and nuclear morphological information simultaneously.To address these issues,cutting-edge developments in clinical FCy are focused on quantitative FCy,spectral FCy,and imaging FCy,which are described in detail as follows.
A.Quantitative flow cytometry
In conventional FCy,the results can only be characterized with features such as dim/intermediate/bright,negative/positive,or arbitrary units of fluorescenc intensities.However,in quantitative FCy,the fluorescen intensities of labeled cell samples can be translated into molecules of antibody binding per cell(ABC),for which calibration curves relating fluorescenc intensities to standardized ABC values are obtained by flushin calibration materials with well-define molecular numbers of fluorochrome into the FCr.4–8
As shown in Fig.2,the dimensions of the laser beam spots in the FCr are ca.10μm×50μm in an ellipse.Because the optical intensities in the detection region are not distributed evenly,in quantitative FCy,the fluorescen distributions of the calibration materials should be comparable with those of the labeled biological cells.As shown in Fig.2(a),calibration microbeads with surface modification are the gold-standard calibration material for quantifying the ABC of biological cells,allowing the expressions of specifi surface antigens to be measured quantitatively.9–14Leveraging this approach,white blood cells and especially lymphocytes are classifie into subgroups quantitatively rather than qualitatively,thereby providing key insights in diagnosing various types of leukemia.15–17
Because the fluorescen distributions of surface-coated calibration microbeads deviate significantl from those of biological cells with intracellular labeling,calibration microbeads are not commonly used to estimate ABCvalues quantitatively at the intracellular level.Instead,Fig.2(b)shows quantitative FCy based on constriction microchannels in which a detection region with dimensions of ca.2.5μm×10μm×10μm is constructed by microfabrication.When single cells with intracellular staining are forced to deform through this optical field stained fluorescen molecules occupy the detection region evenly,with the corresponding fluorescen intensities captured.Fluorescent solutions flushe through this detection region can function directly as the calibration material because of the detection volume being equivalent to the deformed cells,thus translating fluorescen intensities of intracellularly stained single cells into ABC values.
Quantitative FCy based on constriction microchannels was used firs to quantify the levels of single-cell intracellular proteins of β-actins in tumor cell lines of Hep G2,A549,MCF 10A,and HeLa.18Also,it has been used to quantify multiple-type intracellular proteins of single cells includingβ-actin,α-tubulin,andβ-tubulin(SACC-83,CAL 27,A549,Hep G2,PC3),β-actin,biotin,and RhoA(HGE,CAL 27,WSU-HN6,MCF 7,MCF 10A),and Ras,c-Myc,and p53(CAL 27,WSU-HN6,patient samples).19
For secreted cytokines,in droplet FCy,single cells are coencapsulated with microbeads to capture secreted proteins for quantitative fluorescen detection.Based on this approach,various secreted proteins at the single-cell level have been measured quantitatively.20–22However,within the droplet,there is an uneven distribution of fluorescen intensities(e.g.,bright microbeads),leading to compromised accuracies of quantitative measurements.
To estimate quantitatively the expressions of single-cell proteins distributed arbitrarily within biological cells,quantitative FCy based on droplet microfluidic was developed recently[see Fig.2(c)].In this approach,single cells tagged by antibodies labeled with fluorescen probes are firstl encapsulated within droplets;the antibodies are stripped from the biological cells,and thus fluorescen probes distributed evenly in the droplets.The individual droplets then travel through and fully occupy the detection region of the FCr,where the optical dimensions are confine by microfabricated windows.Fluorescent solutions flushe through this detection region can function as the calibration material because of the detection volume being equivalent to the droplets,thus translating fluorescen intensities of droplets into ABC values of single cells.
Quantitative FCy based on droplet microfluidic was used firs to quantify the expressions of one-type proteins,such as ConA of A549,β-actin of A549,and HeLa.23Furthermore,the same platform was used to quantitatively estimate multiple-type proteins of single cells,such asβ-actin,α-tubulin,andβ-tubulin of Hep G2 and CAL 27.24
B.Spectral flow cytometry
Unlike conventional clinical FCy,in which a single detector is used to detect fluorescenc emission in a narrow range for a single fluorophore in spectral FCy,the emission spectra of fluorescenc molecules bound with single cells are achieved with a set of detectors across predefine wavelength ranges,and thus the fluorescen spectra of different fluorescenc molecules can be measured with spectral signatures and used as references in multicolor FCy.
As pioneers of spectral FCy,in 2004,Robinson et al.reported spectral FCy in which a grating was used to disperse light and a photomultiplier tube(PMT)array was used for light detection[see Fig.3(a)].25,26In 2011,Sony licensed the spectral technology patent from the Robinson Group and pursued the commercial development of a spectral FCr in which an array of prisms was used to disperse light across the multi-anode PMT[see Fig.3(b)and Table II].27
Meanwhile,Nolan et al.reported a spectral FCr containing spectroscopy-grade CCD-type detectors rather than multi-anode PMTs;this provided higher quantum efficiencie and more detector elements in a high-density physical arrangement,which enabled higher spectral resolutions[see Fig.3(c)].28–31To address the limitation of relatively low readout speeds of CCDs in comparison to PMTs,a spectral FCr with a CCD operating in the manner of timedelayed integration for improved duty cycles and sensitivities was recently reported[see Fig.3(d)].32
Regarding the development of instruments for spectral FCy,the firs commercial one was released by Sony Biotechnology(SP6800)in 2012:the key optical components were three lasers(405 nm,488 nm,and 638 nm),10 consecutive prisms,and a 32-channel PMT;the corresponding key performance details were wavelengths of 420–800 nm,an acquisition rate of 20 000 events per second,and sensitivities of 120 MESF for FITC and 70 MESF for PE.The newest Sony ID7000 analyzer is configure with up to seven lasers and 186 detectors,enabling the characterization of 44 colors with wavelengths of 360–920 nm(see Table II).
Other cutting-edge instruments include Cytek Northern Lights,BD Symphony A5 SE,and Thermo Big Foot(see Table II).Specifically,Cytek Northern Lights features arrays of avalanche photodiodes based on coarse wavelength division multiplexing,and other key parameters include an optical configuratio of three lasers,measurement wavelengths of 420–829 nm,and an acquisition rate of 35 000 events per second.BD Symphony A5 SE has fiv lasers and 48 high-sensitivity GaAs PMTs,producing wavelengths of 365–880 nm,sensitivities of<80 MESF for FITC,20 MESF for PE,and<70 MESF for APC,and an acquisition rate of 40 000 events per second.Thermo Big Foot has up to nine lasers and 60 PMTs,producing a sensitivity of<100 MESF for FITC,PE,and APC and an acquisition rate of>100 000 events per second.
Regarding leveraging spectral FCy to address clinical demands,a variety of lymphocyte immunophenotyping has been reported.33–38Specifically in 2020,research groups affiliate with Cytek Biosciences reported deep immunophenotyping of major cell subsets for human peripheral blood based on 40-color spectral FCy.33,39In addition,the spectral FCy of Cytek was also used to develop(i)a 43-color panel for characterizing conventional and unconventional T cells,B cells,NK cells,monocytes,dendritic cells,and innate lymphoid cells,34(ii)a 21-marker 18-color panel for deep phenotyping of human peripheral monocytes,37and(iii)a 33-color panel for phenotyping of murine organ-specifi immune cells.38
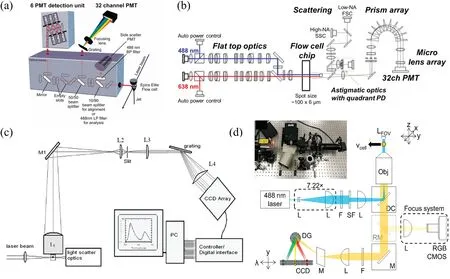
FIG.3.Key technicaldevelopments in spectralFCy:(a)grating and photomultiplier tube(PMT)array;26(b)prism array and PMT array;27(c)grating and CCD;28(d)CCD with a time-delayed integration.32 Figures reprinted with permissions from(a)John Wiley and Sons,Copyright 2011;(b)John Wiley and Sons,Copyright 2015;(c)John Wiley and Sons,Copyright2006;(d)American ChemicalSociety,Copyright2019.
C.Imaging flow cytometry
Unlike conventional FCy,whose results can only characterize the intensities of fluorescenc signals without morphological information,imaging FCy combining conventional FCy and imaging capabilities provides quantitative images of every single cell,thereby making the morphometric features of single cells available for further studies.40,41
As the firs commercially available imaging FCr,the ImageStream system(Amnis USA)can obtain at most 12 images per cell with spectral decomposition.A CCD camera combined with time delay and integration is used to obtain images of the fastmoving cells at low exposure times,thereby enabling a throughput of 300 cells per second[see Fig.4(a)and Table II].42–44
To improve the image capture rates,in 2020,Mikami et al.reported a virtual-freezing fluorescenc imaging FCr based on optomechanical imaging to overcome the compromise among throughput,sensitivity,and spatial resolution.A light-beam scanner matching the entire fiel of view and a polygon scanner with a special rotation angle synchronizing the timings of the image sensor’s exposure and the excitation beam’s illumination and localization were used to enable 1000 times longer exposure time,leading to a higher throughput of more than 10 000 cells per second[see Fig.4(b)].45
To address fundamentally the issue of long exposure times of cameras,an imaging method named time-stretch was reported,in which PMTs are used to obtain the images of moving events that are then used in imaging FCy.46Specifically in 2012,Goda et al.reported an imaging FCr based on the time-stretch technique,in which a PMT was used to image every event and then the spatial spots were mapped to the different specifi wavelengths of the broadband pulse laser;bright-fiel images of single cells were obtained at a high throughput of 100 000 cells per second[see Fig.4(c)].47
Although powerful,in time-stretch imaging,the mapping of spatial spots to different specifi wavelengths of the laser leads to the wavelength information being lost during the digital reconstruction of images,and thus only bright-fiel images can be obtained.Instead,the technique known as fluorescenc imaging using radiofrequency-tagged emissions was developed to achieve both brightfiel and fluorescenc imaging with PMTs at an extremely high speed.48Specifically in 2022,Schraivogel et al.developed an integrated multicolor fluorescenc imaging FCr in which the images were captured by separated PMTs in different fluorescenc channels:the laser was separated into laser spots modulated at unique radio frequencies to excite modulated fluorescen and scattered lights of travelling events,and then the signal amplitudes were used to reconstitute 2D images in different channels;one bright-fiel image and four fluorescenc images were captured at a throughput of 15 000 cells per second[see Fig.4(d)].49

FIG.4.Key technicaldevelopments in imaging FCy:(a)ImageStream with time delay and integration technique;44(b)virtual-freezing fluorescence imaging FCy;45(c)brightfield imaging FCy based on time-stretch technique;47(d)multicolor fluorescence imaging FCy using radio-frequency-tagged emission.49 Figures reprinted with permissions from(a)Luminex Corporation;(b)Springer Nature,Copyright2020;(c)Proceedings ofthe NationalAcademy of Sciences,Copyright2012;(d)The American Association for the Advancementof Science,Copyright 2022.
V.FUTURE DIRECTIONS
Regarding future directions,technical developments in clinical FCy should be driven by clinical demands,which are divided here into leukemia diagnosis and detection of MRD.
In leukemia diagnosis,quantitative rather than qualitative gating is needed.Currently,with the help of calibration microbeads,quantitative FCy can estimate the expressions of membrane antigens,but quantitative numbers of cytoplasmic and nuclear expressions of cell markers are still not available.Therefore,quantitative FCy capable of measuring both membrane and intracellular biomarkers for single cells is demanded for leukemia classification
Regarding the detection of MRD,current clinical FCy suffers from a key limitation of false negatives due to varied expressions of antigens after treatments.With the contributions of spectral FCy,the measurement resolutions can be increased dramatically,but the detrimental issue of optical overlap remains.To a certain extent,imaging FCy can address the issue of false negatives by collecting cell images simultaneously,but current imaging FCy still cannot capture cell images with high magnificatio (e.g.,ca.100)for medical examination because of the issue of losing focus.Therefore,imaging FCy in which cell positions are fine-tune for proper imaging is also demanded.
ACKNOWLEDGMENTS
The authors acknowledge the financia support of the National Natural Science Foundation of China(Grant Nos.61922079,61825107,and 62121003),the Chinese Academy of Sciences(Grant Nos.GJJSTD20210004 and Y201927),and the National Key Research and Development Program of China(Grant No.2021YFC2500300).
AUTHOR DECLARATIONS
Conflict of Interest
The authors have no conflict to disclose.
Author Contributions
T.Z.and M.G.contributed equally to this work as joint firs authors.
DATA AVAILABILITY
Data sharing is not applicable to this article as no new data were created or analyzed in this study.
杂志排行

纳米技术与精密工程的其它文章
- Controllable blood–brain barrier(BBB)regulation based on gigahertz acoustic streaming
- A new approach for accurate determination of particle sizes in microfluidic impedance cytometry
- Conductive polymer hydrogel-coated nanopipette sensor with tunable size
- Multi-temperature modeling of femtosecond laser pulse on metallic nanoparticles accounting for the temperature dependences of the parameters