Processing Characteristics of Different Beef Cuts from Xia-Nan Cattle and Suitability for Beef Jerky Processing
2022-01-06ZHAOGaimingLIShanshanCUIWenmingZHUChaozhiLIJiaqiJIAOYangyangYINFengBAIXueyuanQIXinglei
ZHAO Gaiming, LI Shanshan, CUI Wenming, ZHU Chaozhi,*, LI Jiaqi, JIAO Yangyang,YIN Feng, BAI Xueyuan, QI Xinglei
(1. Henan Key Laboratory of Meat Processing and Quality Safety Control, College of Food Science and Technology, Henan Agricultural University, Zhengzhou 450002, China; 2. Promotion Research Center of Xia-Nan Cattle, Zhumadian 463000, China)
Abstract: Xia-Nan cattle is the first new breed of beef cattle independently cultivated by China. In order to promote the industrialization and scientific development of Xia-Nan cattle meat and its deeply processed products, the differences in the physicochemical parameters and processing quality of beef from different carcass locations were investigated, and the suitability for producing beef jerky was also evaluated. Twenty physicochemical indicators of raw beef and nine processing quality indicators of beef jerky were determined. Moreover, correlation analysis and principal component analysis (PCA)were used to screen for the key indicators and a model for quality evaluation was established. The results showed that 1) the physicochemical characteristics of raw beef varied notably among carcass locations; the tenderside had the highest moisture(75.47%) and protein (21.51%) contents and the lowest intramuscular fat content (2.39%) (P < 0.05), as well as better gel and emulsifying properties. The shoulder had the highest intramuscular fat content (8.69%), better textural properties,and smaller shear force. The shank had the lowest cooking loss rate (24.08%), thawing loss rate (1.81%) and shear force(4.99 kg). The cooking loss rete (34.22%) and thawing loss rate (6.36%) in the knuckle were the highest. 2) The comprehensive evaluation model for beef jerky processing suitability was established as Y = 0.197 9A + 0.026 0B + 0.312 8C +0.218 8D + 0.245 5E, where A, B, C, D and E represent a*, hardness, hydroxyproline content, cooking loss rate, and emulsifying stability, respectively. 3) The shoulder and bottom round but not knuckle and shank were suitable for beef jerky processing. 4) The regression equation between sensory evaluation (y) and comprehensive quality evaluation (x) was established as y = 3.646 5x + 4.556 2 (R2 = 0.824 2), and the comprehensive evaluation model could well predict beef jerky processing suitability. This work has provided additional parameters necessary to evaluate the processing characteristics of Xia-Nan cattle meat and has found more suitable carcass locations for processing beef jerky.
Keywords: beef; cut; jerky; processing characteristic; Xia-Nan cattle
Xia-Nan cattle is a new breed of beef cattle cultivated by the hybrid of French Charolais (♂) × Nanyang cattle(♀). It is also the first beef breed cultivated in China, with the characteristics of strong adaptability, fast growth and development, good meat quality and high meat production rate[1-2]. Xia-Nan cattle was breed in Biyang County, Henan Province in June 2007. With the increase in both number and distribution, it has been extended to 80% of provinces in China by 2018, which has broader application prospects.However, the industrial production and development of Xia-Nan cattle were greatly limited due to the lack of systematic studies on the chemical composition, processing characteristics and related deep-processed products.
The common beef products in China mainly include prepared meat products, cooked sauce meat products, dried products, canned products, ham products, and other products.Jerky is one of the oldest meat products which are preserved by salting and drying. It is relatively simple to process, has a typical flavor, and needs no refrigeration during commercial distribution. Also, jerky is nutritious, shelf-stable. It is a meat product well consumed in the world[3], and has been produced since antiquity with great importance in the economic development of many countries.
The quality of meat products is affected by the quality of raw meat[4]. Numerous studies provided the nutrient database and meat quality profiles of individual muscles and muscle groups (primal or subprimal cuts) within the beef carcass[5-6].These studies showed differences in meat quality of different cuts. The differences were dependent on muscle fiber composition as well as the proximate composition of meat cuts[4], and will directly affect the product quality. In addition,there were differences in the suitability of meat processing in different cuts[7-8].
The present study mainly evaluated the differences in physicochemical parameters and processing characteristics of different cuts, which will improve and update the basic parameters of Xia-Nan cattle, providing a reference for the further development and utilization of cattle resources in the future. Besides, a model for evaluating the suitability of beef jerky will be established; the data would be valuable for enterprise production and product standardization. All these will be conducive to promote the high-level development with rationalization and scientific of the Xia-Nan cattle.
1 Materials and Methods
1.1 Materials and reagent
Xia-Nan cattle (n= 6, random sampling; bull;approximately (450 ± 28) kg; 18 months old) were harvested at Henan Hengdu Food Co., Ltd. Zhumadian, Henan,China. Animal protection organizations had agreed on the slaughter of livestock. Before slaughter, food, water and suitable temperature were provided to keep the cattle in a relaxed and comfortable environment, in addtion to minimizing the pain during slaughter. The carcasses were aging for three days (4 ℃, upside down) and then the cuts,including Brisket, knuckle, tenderside, shoulder, shank and bottom round, were obtained.Semimembranosusandadductormuscles were removed and trimmed of all visible fat and connective tissue. All meat was frozen in a -40 ℃refrigerator for later use.
Salt China Salt Industry Group Co., Ltd.; Sugar Nanjing Ganjuyuan Sugar Co., Ltd.; Sodium erythorbate Fuzhou Longlixin Biological Products Co., Ltd.; KCl, NaCl,KH2PO4, et al. (all analytical pure) Sinopharm Chemical Reagent Co., Ltd..
1.2 Instrument and equipment
BPG-9156A dryer Shanghai Yiheng Co., Ltd.; HI 99163 pH meter Swiss Mettler Toledo Instruments Co.,Ltd.; CR-5 colorimeter Japan Konica Minolta Holdings,Inc.; 235 6X Warner Bratzler shear machine USA G-R Manufacturing Co., Ltd.; TA.XT Plus texture analyzer UK Stable Micro Systems Co., Ltd.; T10 ULTRA-TURRAX high-speed disperser Germany IKA Works GmbH & Co.,Ltd.; Aqualab 4TE water activity (aw) meter USA Meter Group, Inc.; PQ001 Pulsed NMR analyzer Shanghai Niumag Co., Ltd..
1.3 Methods
1.3.1 Preparation of beef jerky samples
The beef jerky samples were prepared as described by Yang[9]et al. The frozen beef was thawed at 4 ℃ overnight,sliced to 0.5 cm thick pieces with a meat bone saw and cut into cubes of 10.0 cm × 4.0 cm × 0.5 cm. Sliced jerky samples were cut parallel in direction to muscle fibers. The sliced samples were then cured at 4 ℃ for 24 h in a cure solution containing 10% water, 1.2% salt, 1.0% sugar, 0.015% sodium nitrite and 0.03% sodium erythorbate (based on raw meat mass). All cured muscle samples were dried using a dryer on a modified step-up schedule: 4 h at 60 ℃, 3 h at 70 ℃,15 min at 85 ℃ and turn the samples every hour during the baking process. After the jerky samples were dried, it was cooling to ambient (≈ 25 ℃) temperature. Theaw, product surface color, shear force, low-field nuclear magnetic resonance (LF-NMR) transverse relaxation time and sensory evaluation were measured.
1.3.2 Indexes of raw meat measurement
1.3.2.1 Moisture, protein, intramuscular fat and hydroxyproline content
Before testing, the meat was tempered at 4 ℃ for 24 h.The moisture content of the meat was measured using direct drying method, reference to the determination of moisture in GB/T 5009.3-2016National food safety standard determination of moisture in food[10]. The protein content of the meat was measured using Kjeldahl method, reference to the determination of proteins in GB/T 5009.5-2016National food safety standard determination of protein in food[11]. The intramuscular fat content of the meat was measured using the soxhlet extractor method, reference to the determination of fat in GB/T 5009.6-2016National food safety standard determination of fat in food[12]. And the determination of hydroxyproline content was a reference by GB/T 9695.23-2008Determination of the content of hydroxyproline in meat and meat products[13](meat and meat products-determination of hydroxyproline content). Each sample was measured in parallel three times.
1.3.2.2 pH
The meat pH was measured in triplicate using a digital pH meter and reference to the determination of pH in GB/T 5009.237-2016National food safety standard determination of food pH[14].
1.3.2.3 Color evaluation
The color of meat was measured using a colorimeter and expressed asL* (lightness),a* (redness) andb* (yellowness).An average value was determined by taking observations from four different cut surfaces of the same sample.
1.3.2.4 Thawing loss rate
Meat samples were splitted into 30 mm × 30 mm ×30 mm blocks by using a saw bone machine in a frozen state and immediately weighed on the electronic balance; then,the samples were thawed at 0-4 ℃ until completely thawed,blotted dry with absorbent paper and weighed. The thawing loss rate was expressed as the mass loss rate after thawing as a percentage of the initial mass.
1.3.2.5 Cooking loss rate
Meat samples were placed in a retort pouch and cooked in a water bath at 80 ℃ until the center temperature was 75 ℃,then equilibrated to ambient temperature (25 ℃). Cooking loss rate was calculated as the difference between the initial raw stuffed mass and mass after cooking and expressed as a percentage of the original raw stuffed mass.
1.3.2.6 Warner-bratzler shear force and textural properties
The meat samples were treated in the same way as section 1.3.2.5.Warner-Bratzler shear force was carried out using the method described by Boles et al[15]. Ten 13 mm × 13 mm ×26 mm strips were cut from the cooked meat so that the fiber direction was parallel to the long axis. Each sample was sheared once, perpendicular to the long axis of the sample,with a Warner Bratzler shear machine. The shear force/kg was calculated as the average of ten cubes from each cut.
The textural characteristics of meat were analyzed according to texture profile analysis using a TA.XT Plus texture analyzer with 50 kg load cell. Meat samples were cut(10 mm × 10 mm × 10 mm) and compressed twice to 50%of their original height at a constant cross-head speed of 60 mm/min. The test settings were 2 mm/s test speed, 20 g trigger force and 30 mm distance. The texture profile analysis parameters, namely hardness, cohesiveness, springiness and chewiness were analyzed.
1.3.2.7 Gel property
Preparation of meat gels: Meat was minced into meat pastes and accurately weighed 100 g, 300 mL of 0.6 mol/L NaCl solution was added. Filtered with four layers of gauze after homogeneous 100 s, the filtrate was centrifuged (4 ℃,5 000 r/min, 5 min), the supernatant was discarded. The lower sediment was the meat homogenization and it was stuffed into the 50 mL centrifuge tube. The centrifugal tube were closed and heated in a water bath with 80 ℃ to a final internal temperature of 70 ℃, maintained for 20 min. Thereafter cooled down in ice water until a temperature of 20 ℃ was reached in the core and then stored at 4 ℃ until use.
Water holding capacity of gel (WHCgel): The gel sample in centrifugal tube was centrifuged at 5 000 r/min for 10 min at 4 ℃, the separated water was dried with filter paper. WHCgelwas expressed as the ratio of gel mass after centrifugation to the initial gel sample mass.
Hardness and springness of gel (hardnessgel,springnessgel): The hardnessgeland springnessgelwere analyzed according to texture profile analysis using a TA.XT texture analyzer with 50 kg load cell. The gel samples were cut(28 mm in diameter, 15 mm height) and compressed twice to 50% of their original height at a constant cross-head speed of 60 mm/min.
1.3.2.8 Emulsifying properties
Homogenate preparation: About 0.4 mol/L NaCl and 0.051 mol/L K2HPO4solution were prepared. The meat was ground with a meat grinder. 800 mL of NaCl and K2HPO4solution (0-4 ℃) and 50 g ground meat mixture were homogenized by high-speed disperser for 2 min at 18 000 r/min. Place 24-48 h in 4 ℃ and filter with gauze.
Emulsifying capacity (EC): EC was expressed as the maximum amount of emulsified oil held per unit of protein.15 mL of the above homogenate was added to 20 centrifuge tubes, respectively, and the number of milliliters of soybean oil added in the sequence was 1, 2, ..., 20 mL. Homogenised at 10 000 r/min for 10 s. The conductivity of the emulsion layer was measured in sequence. At the breaking point, the conductivity rapidly dropped; the amount of oil added was recorded as EC.
Emulsifying stability (ES): Selected the centrifuge tube with the largest EC, and draw the emulsion into the centrifuge tube(m/g) and massed (m1/g), and immediately heated at 80 ℃ in a water bath for 30 min. The tubes were centrifuged at 4 000 r/min for 5 min, then were massed (m2/g). ES was calculated as formula (1).

1.3.3 Index of beef jerky sample measurement
1.3.3.1 Cook yield, shear force and instrument color
Cook yield was expressed as a percentage of cooked mass and raw mass. Jerky samples as close as practicable to 0.5 cm × 2.0 cm × 4.0 cm were cut from each jerky samples for shear force measured. The shear force and instrument color were measured in the same way as raw meat.
1.3.3.2aw
Beef jerky samples from each cut were cut into small pieces using sharp scissors and were homogenized before measurement ofaw. The pieces were put intoawcups, and the water activities determined withawmeter, calibrated at ambient temperature (20 ℃) with distilled water (aw= 0.999).
1.3.3.3 LF-NMR transverse relaxation time
LF-NMR transverse relaxation time measurements were carried out using a method described by McDonnell et al.[16]and using a Pulsed NMR analyzer resonating at a frequency of 23.2 MHz. Transverse relaxation times (T2) were measured using Carr-Purcell-Meiboom-Gill pulse sequence with the resultant relaxation decays analyzed by a multi-exponential model using the MultiExp Inv Analysis program.
1.3.3.4 Sensory evaluation
Sensory evaluation was determined as described by Han Ge et al.[17]and was modified appropriately. The sensory evaluation of beef jerky was conducted by a 20-member taste panel (10 males and 10 females) previously trained in muscle food sensory evaluation. Each panelist was supplied with purified water to clear his or her palate in between samples.The beef jerky was cut into strips sized approximately 2.0 cm × 0.5 cm before serving. Six kinds of samples were served to the panelists randomly and were evaluated blindly. The sensory characteristics were evaluated: flavor, color, tenderness,taste, and overall acceptability. For tenderness, 1 = tough,9 = tender; for color, 1 = dark brown and dull, 9 = red and bright;for flavour, 1 = woody texture and less aftertaste, 9 = fine meat and good aftertaste; for taste, 1 = weak, 9 = strong; for overall acceptability, 1 = low and 9 = high.
1.4 Statistical analysis
The results were expressed as mean values with standard deviation from the replications. The statistical evaluation of the results was performed using the SPSS 16.0.0 software.Duncan multiple comparison tests was used to compare means values and differences among mean values were considered significant whenP< 0.05. The histogram was drawn using OriginPro 9.1 software and the correlation heat map was drawn using GraphPad Prism 5 software. Six samples of each index were each analyzed in triplicate for each sample.
2 Results and Analysis
2.1 Results of determination of raw meat
2.1.1 Physicochemical properties
The difference of moisture, protein, intramuscular fat,hydroxyproline contents and pH values in different cuts were described in Table 1. The moisture content and protein content were greatest in tenderside, while the intramuscular fat in tenderside was the lowest (2.39%). The intramuscular fat and hydroxyproline content of the shoulder were significantly greater than other cuts (P< 0.05). This was consistent with previous reports[18], which showed significant differences in the chemical composition of meat among different cuts. This study was also consistent with other researchers which reported that as intramuscular fat increased, protein content decreased[4-5]and as fat content increased while moisture content subsequently decreased[19]. The differences in the chemical composition of the meat from different cuts may lead to various food quality such as color, tenderness and flavor. The pH of different cuts of the beef fluctuated within the range of 5.46-5.82, the shoulder was the lowest and the brisket was the greatest. The content of glycogen in different cuts and the rate of glycolysis after slaughter were different, which resulted in the difference of pH decline rate and degree, and it was related to various factors such as the proportion of rapid leaven muscle fibers and the composition of slow oxidized muscle fibers in different cuts of muscle and the diverse potential of muscle glycolysis[20].
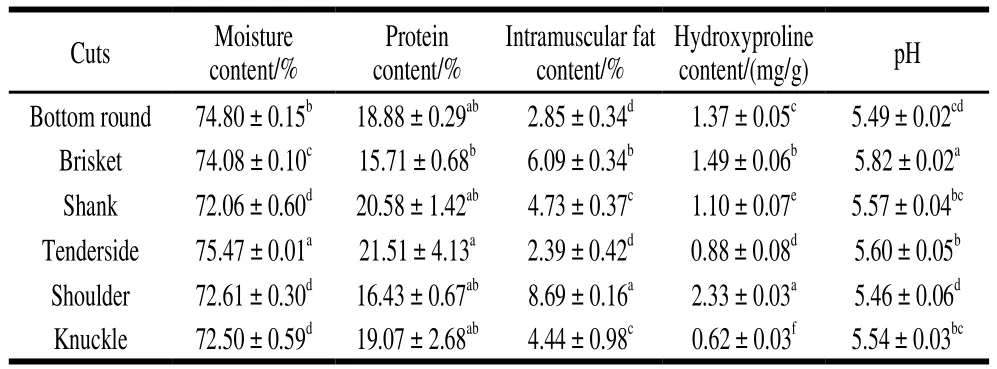
Table 1 Comparison of physicochemical properties of raw beef from different carcass locations (n = 6)
2.1.2 Color
The difference of meat color in different cuts was presented in Fig. 1. The result showed that there were obvious differences in theL* (brightness),a* (redness),andb* (yellowness) value of different cuts. Meat color was primarily due to the presence of myoglobin, which was a vital characteristic in the consumer acceptance of meat products. TheL* value of the bottom round was the lowest and the tenderside was the greatest. Differences in light scattering properties of muscle fiber structures at different cuts of the muscle surface may result in differences inL*values of different cuts. Thea* value of the brisket was the lowest and the shank was the greatest. The difference ina*value of different cuts was related to the difference of muscle oxygenated myoglobin content in different cuts. In addition,low fat levels and high water content usually result in greatera* values and lowerL* values[21]. In this sense, the greatera*and lowerL* of the sample of bottom round could be related to the lower fat content (Fig. 1). Theb* value of the brisket was the lowest and the shank was the greatest. As discussed in the literature, yellowness was a numerical depiction of how yellowness of material was in comparison with a clear water-white standard and indicated the degree of departure of an object color from colorless or from a preferred white. The decrease in the yellowness values attests to greater clarity in terms of cleanness or clearness[22]. And this may be related to the difference in muscle myoglobin content in different cuts.
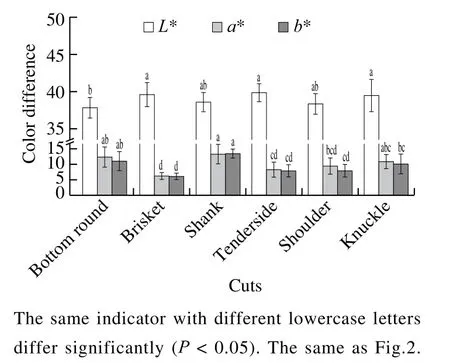
Fig. 1 Comparison of the color of beef from different carcass locations(n = 6)
2.1.3 Water holding capacity
Thawing loss rate and cooking loss rate are vital indicators for water holding capacity. There were significant differences in the thawing loss rate and cooking loss rate of different cuts (Fig.2). The thawing loss rate of the knuckle was the greatest (6.36%) and the shank was the lowest(1.81%). For economic reasons, high thawing loss rate, such as knuckle, is suitable for sale as fresh meat. The cooking loss rate of shank was the lowest (24.08%) and the knuckle (34.22%) was the greatest. This agrees with data reported by Boles et al[23], who reported a significant effect of meat cuts on the cooking loss. Control of cooking loss was important because changes in the cooking yields resulted in compositional changes in the finished products that may affect the palatability characteristics. Besides, cooking loss affects the cost of the manufacture of processed meats[24].
2.1.4 Textural properties and shear force
The difference of textural properties and shear force in different cuts were presented in Table 2. The main palatability attribute influencing consumer acceptance was tenderness in meat[25]. Texture properties and shear forces were the leading indicators for characterizing tenderness. The brisket had the lowest hardness, cohesiveness and chewiness,but the springness (0.57) was the greatest (P< 0.05). The shear force value (4.99 kg) was lowest in the shank. The hardness and chewiness value in knuckle were the greatest.Early studies showed that muscles with smaller amounts of connective tissue had lower shear force values, but there was not a notable relationship between intramuscular fat content and shear force values.
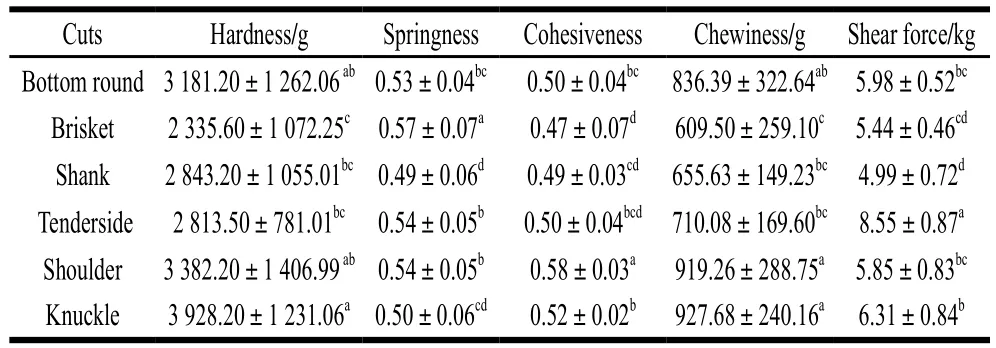
Table 2 Comparison of textural properties and shear force of beef from different carcass locations (n= 6)
2.1.5 Gel and emulsifying characteristic
The difference between gel and emulsifying characteristics of beef samples in different cuts was presented in Fig. 3. Gel and emulsifying properties were functional properties of proteins and played important roles in the processing of meat products. The hardnessgeland springnessgelvalues were both greatest in the brisket and lowest in the shank (P <0.05). When the pH near the isoelectric point,most of the protein aggregation was difficult to dissolve, thus affecting a series of functional properties such as muscle protein gel properties and water holding capacity[26]. Meat cut had a small effect on the WHCgel. Protein emulsification properties means that protein can make oil and water form a stable emulsion and act as an emulsifier, mainly including EC and ES[27]. The EC and ES values in the tenderside were both the greatest. The protein in the meat played a decisive role in the ES. The greater the protein concentration, the more saltsoluble protein will wrap the fat particles and prevent the fat from accumulating when heated, the more stable the whole system will be.
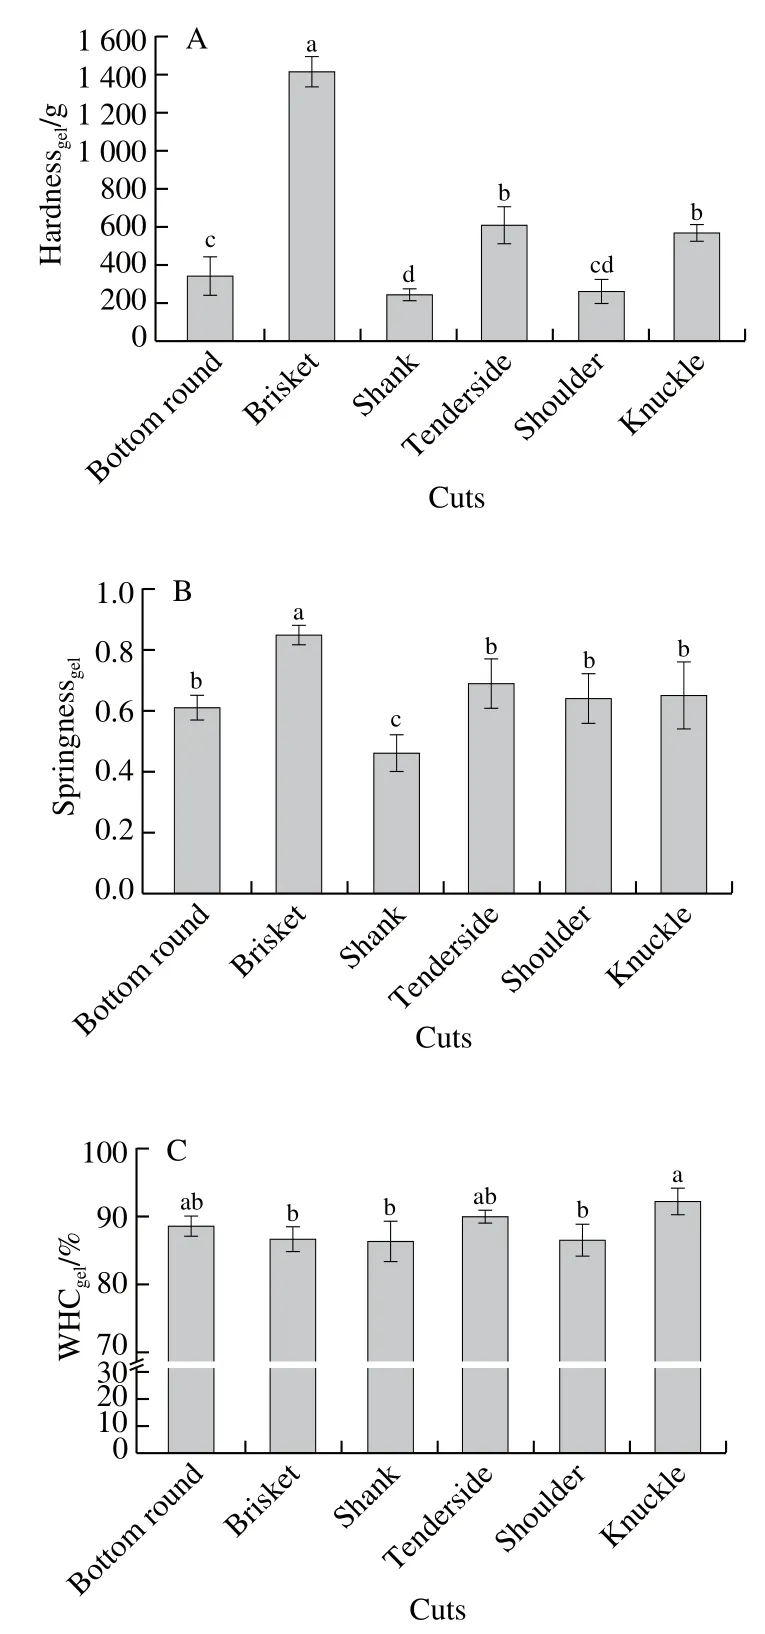
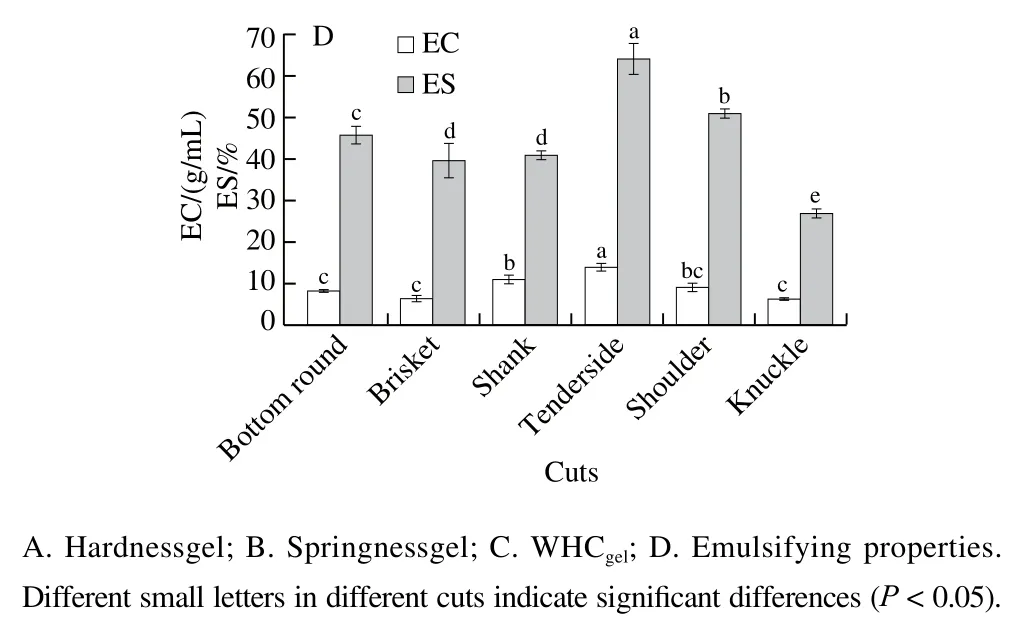
Fig. 3 Comparison of gel characteristics and emulsifying properties of beef from different carcass locations (n = 6)
2.2 Beef jerky indicators
The characteristics of beef jerky were affected by the meat cut (Table 3). The economic benefit is closely related to the yield. The cuts used to manufacture the beef jerky significantly affected the cook yield of the finished product.This was consistent with data reported by Boles et al.[18]who reported a significant effect of meat cut on the cook yields.Cook yield was greatest when bottom round and shank were used to manufacture the jerky. Jerky made from the knuckle had the lowest yield. Shear force was an important and widely used index to evaluate meat tenderness[28-29]. The product shear force value ranged from 10.68 to 15.14 kg, depending upon the meat cut. The beef jerky made from shoulder reached a minimum value with 10.68 kg, which was more tender than beef jerky made from the other meat cuts.awwas useful to describe the thermodynamic equilibrium state of jerky, and jerky must have a stableawto avoid changes in quality during storage. Jerky made from the knuckle had notablely lowerawthan jerky made from any other cuts.
The color of meat products was an extremely extraordinary sensory characteristic for consumer acceptance and mainly dependent on the chemical state of the pigment myoglobin and protein of the heme group. Myoglobin was the only pigment in sufficient quantity to confer red color to meat[30]. Meat cut had a small effect on color (L*,a* andb*)values of beef jerky. Jerky made from brisket and shank had greaterL* values, the bottom round and brisket had greatera* values.
A representative LF-NMRT2was also shown in Table 3. Distributed exponential analysis of curve obtained for various samples revealed the presence of three distinct peaks obtained at relaxation time ranges of 0-10 ms(T2b), 10-100 ms (T21) and > 100 ms (T22) respectively.These peaks can be attributed to various fractions of water present in beef jerky samples. The first peak obtained at the shortest relaxation time (T2b) represents bound water which is closely associated with macromolecules (mainly proteins).The second peak atT21represents water present within the dense myofibrillar protein matrix, whereas, the third peak atT22can be attributed to free-water present outside the myofibrillar protein matrix. The presence of three water fractions at relaxation times and their association with muscle proteins has been previously reported[31-32]. The distribution and mobility of water in muscle (myowater) and meat have a profound influence on essential meat quality attributes like juiciness, tenderness, firmness and appearance. Jerky samples made from the knuckle had significantly (P< 0.05)longer relaxation times, the shoulder samples had the shortest relaxation times, explain that the moisture and protein in the beef jerky made from shoulder bind more closely.
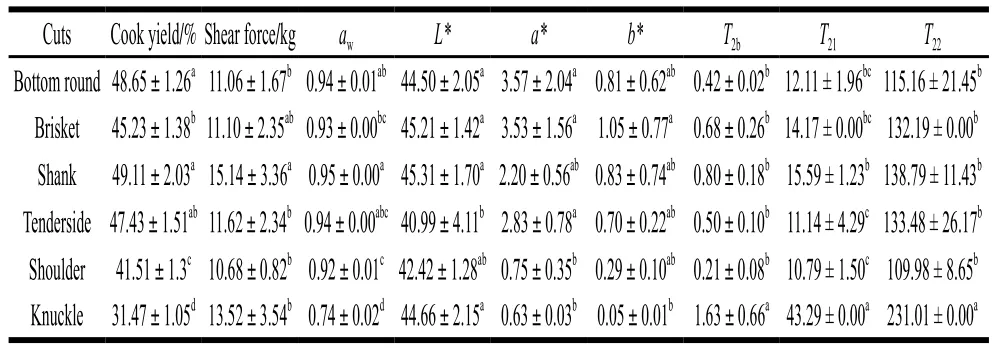
Table 3 Quality characteristics of beef jerky from different carcass locations (n = 6)
As shown in Fig. 4, jerky samples made from the bottom round and brisket had the greatest color scores, the shoulder had the greatest tenderness scores, which was agreed with research reported by Hunt et al.[5]and this was consistent with the instrumental measurements (Table 3). Beef jerky from bottom round and shoulder had the greatest scores in taste, flavor and overall acceptability. According to the above results, beef jerky from bottom round and shoulder tended to be more popular.
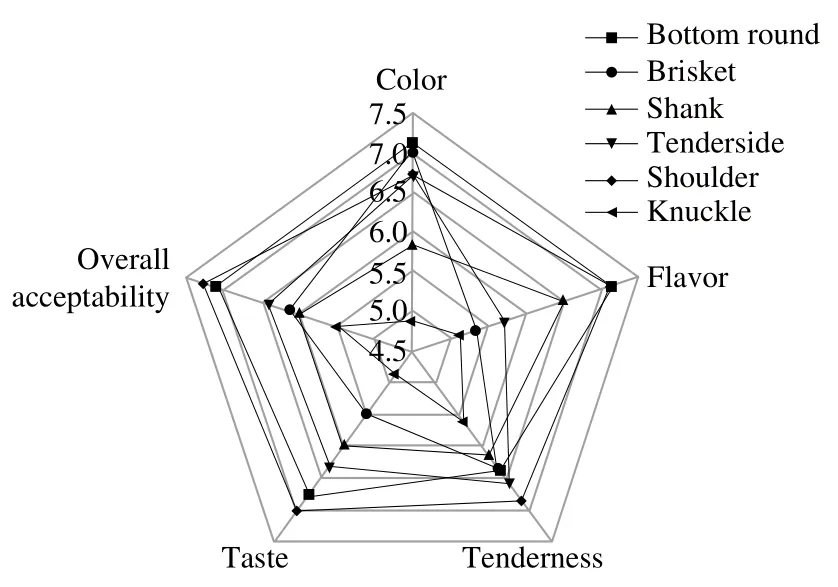
Fig. 4 Radar chart of sensory evaluation of beef jerky from different carcass locations (n = 6)
2.3 Suitability of beef jerky processing in different cuts
2.3.1 Coefficients of variation in quality indicators of raw meat
In order to screen out the key indicators of the suitability of beef jerky processing, the indicators need to be calculated and analyzed to eliminate the different problems of the scale,the coefficient of variation results of each index were shown in Table 4, the variation coefficient of moisture content, pH,L* and WHCgelwere less than 7%, which indicated that the cut factors have less impact on it.

Table 4 Variation coefficients of quality indicators of beef jerky
2.3.2 Principal component analysis and correlation analysis
Principal component analysis (PCA) has been performed,as the analysis of 20 parameters would be very tedious job.Besides this, as several parameters were correlated hence this will cause a bias in the final index values. PCA performs the task of parameter reduction by using a statistical approach[33].Data was projected in independent axes known as principal components (PCs). Out of these the PCs, the first 5 were selected to move ahead with. The rotated factor loadings of these 5 PCs can be seen in Table 5. Table 5 also shows the eigenvalues, individual variance and cumulative variance and hence selections of first 5 PCs as they account for 93.359% of the total variance and have individual eigenvalues > 1. PC1 explained 32.364% variation and the parameters contributing maximum werea*, springnessgel,b*, springness, hardnessgel,pH andL*. The coefficient of variation of pH andL* were both less than 7%, so delete these two indicators. Thea* had a significant (P< 0.05) correlation (r= 0.589) with jerky shear force, moreover, the springnessgel,b*, springness,hardnessgel, pH andL*, were all correlated (Fig. 5) witha*.So thea* was chosen as a representative indicator of factor 1.PC2 explained 23.902% variation and was marked by high loadings for contents of hydroxyproline, moisture,intramuscular fat, protein, and cohesiveness. Hydroxyproline content was correlated with the jerky shear force,T21andT22, correlation analysis also showed a significant(P< 0.05) correlation between hydroxyproline and intramuscular fat, protein contents. So the hydroxyproline was chosen as a representative indicator of factor 2.The same method was used, hardness, cooking loss rate,and ES were chosen as the representative indicators of the PC3, PC4, PC5, respectively. In summary, PCA screened five key quality indicators, namelya*, hardness,hydroxyproline, cooking loss, and ES.
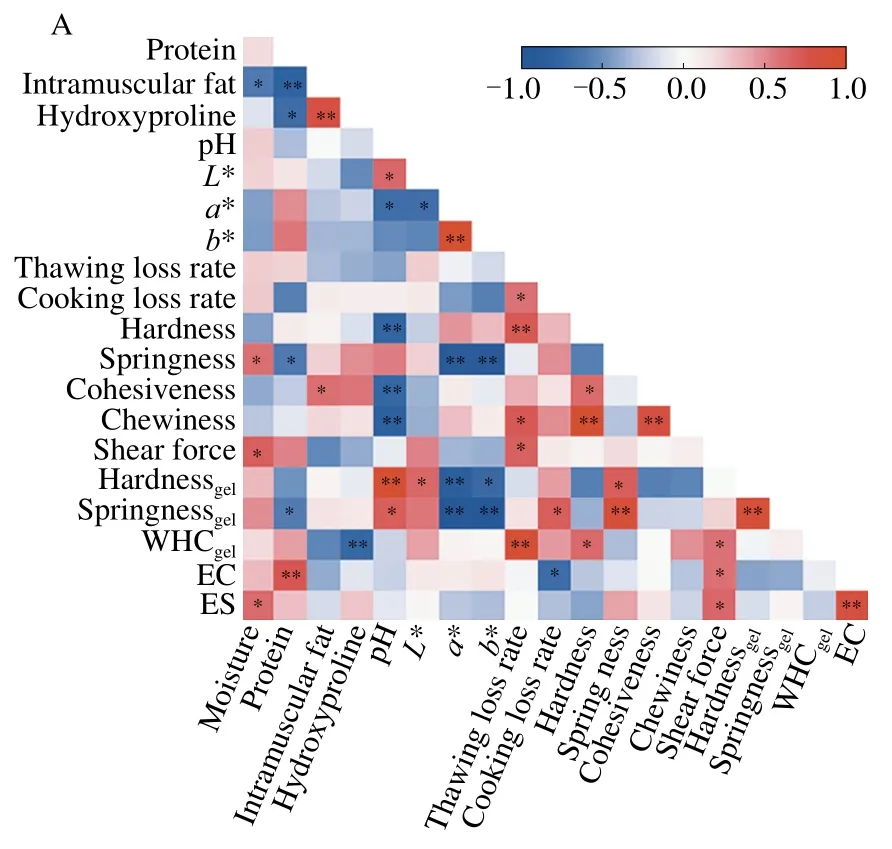
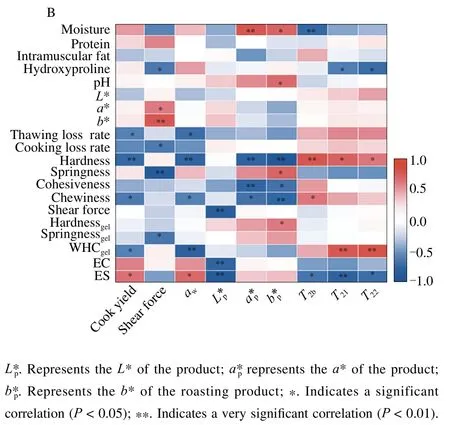
Fig. 5 Correlation between quality parameters of raw beef (A) and correlation between quality parameters of raw beef and products (B)

Table 5 Eigenvalues and varimax rotated factor loadings of quality characteristics of beef from different carcass locations
2.3.3 Establishment of quality evaluation model

Calculate the weight of each indicator according to the formula (2), then the masses of these five key quality indicators were normalized, and the normalized masses were 0.197 9, 0.026 0, 0.312 8, 0.218 8, 0.244 5, respectively. So the evaluation model was written asY= 0.197 9A+ 0.026 0B+0.312 8C+ 0.218 8D+ 0.245 5E(A,B,C,D,Erepresentsa*,hardness, hydroxyproline content, cooking loss rate, and ES,respectively). Key raw meat indicators were standardized,and the comprehensive evaluation score of beef jerky in different parts was calculated according to the comprehensive evaluation equation. The results showed that shoulder and bottom round were suitable for beef jerky processing while knuckle and shank were not and the combined score of beef jerky in different parts was shoulder > bottom round >tenderside > brisket > knuckle > shank.
2.3.4 Model verification
The overall acceptability results of beef jerky sensory evaluation in different parts were standardized. The sensory evaluation was used as the dependent variable,and the comprehensive quality evaluation was used as the independent variable. A regression equation was established asy= 3.646 5x+ 4.556 2 (R2= 0.824 2). It was shown that the comprehensive evaluation model can accurately predict the overall acceptability of the senses and better reflect the suitability of beef jerky processing.
3 Conclusions
The results in this study comprehensively provided the chemical composition and processing characteristics information of Xia-Nan beef. The suitability of processed beef jerky in different cuts was evaluated, and a comprehensive evaluation model of beef jerky quality was established. The comprehensive score of the evaluation model and the overall acceptability in sensory assessment had resulted in a large fit degree, which can effectively evaluate the processing suitability of different parts. Shoulder and bottom round were suitable for beef jerky, while knuckle and shank was not.Palatability assessment of individual beef cut was necessary for the development of value-added cuts. Similar methods can be further applied to other breeds of cattle or different types of raw materials, to find the most suitable processing method for each part to maximize the benefits of meat cuts.
