How polar hydroxyl groups affect surface hydrophobicity on model talc surfaces
2021-11-13ZhuangzhuangChenChonghaiQiXuepengTengBoZhouandChunleiWang
Zhuangzhuang Chen,Chonghai Qi,Xuepeng Teng,Bo Zhou and Chunlei Wang
1 Division of Interfacial Water and Key Laboratory of Interfacial Physics and Technology,Shanghai Institute of Applied Physics,Chinese Academy of Sciences,Shanghai 201800,China
2 University of Chinese Academy of Sciences,Beijing 100049,China
3 School of Physics,Shandong University,Jinan 250100,China
4 Shandong Cancer Hospital and Institute,Shandong First Medical University and Shandong Academy of Medical Sciences,Jinan 250117,China
5 School of Electronic Engineering,Chengdu Technological University,Chengdu 611730,China
6 Shanghai Advanced Research Institute,Chinese Academy of Sciences,Shanghai 201210,China
Abstract Based on molecular dynamics simulations,we have studied the wetting behaviors of water on the talc-like surface with different surface polarity by modifying the charge distribution of surface hydroxyl(–OH)groups.With the change of the charge of the hydrogen atom(denoted as δq)in–OH group,the contact angle decreases from 91°to 50°and then remains constant.On the surfaces with the larger charge of hydrogen atoms(δq ≥0.2 e),a water droplet is formed above a water monolayer,which is exactly contacted on the surface.Each water molecule in the monolayer forms one hydrogen bond (H bond) with surface –OH groups,without participating in any H bond with the water molecules within the monolayer or with the water molecules above the monolayer.The polarity of the –OH group also has a great influence on the dynamic behaviors of the interface water,such as residence time,hydrogen bond lifetime and selfdiffusion coefficient.The diffusion of water molecules in the water monolayer near the highly polar surface is greatly suppressed,and the residence time of water molecules in the water monolayer even exceeds 12 ns.
Keywords: talc,wetting properties,trapping effect,molecular dynamics simulation
1.lntroduction
The wetting properties of surfaces [1–11] profoundly affect the various physical,chemical and biological processes involved in the surface,such as the adsorption and desorption of molecules on the surface[12–17],protein folding[18–20],self-assembly of amphiphilic molecules [21–23],surface friction [24–28],etc.Therefore,it is important to understand the factors that affect the surface wetting behavior.Surface wetting behavior is affected by many factors,such as the surface morphology [29–31],the polarity [32–34],the temperature[35–37]and so on.The contact angle of droplets on a solid surface is an important parameter to evaluate the hydrophilic and hydrophobic properties of the surface.Usually,the contact angle of droplets on various solid surfaces ranges from 0 to 180°,and a larger contact angle means that the surface is more hydrophobic.
In general,polar surfaces are hydrophilic while nonpolar surfaces are mostly hydrophobic [38,39].Recently,it is found that the relationship between surface wetting behavior and surface polarity becomes very complicated.Giovambattista et al [40] adjusted the silica surface dipole moment by adjusting the surface charge,and found that there is a monotonic relationship between the surface wetting behavior of the surface and the surface charge q.However,the relationship between the polarity of the solid surface and the wettability of the surface are rather complex.We observed a hydrophobic-like water monolayer on a solid model surface with specific hexagonal charge patterns,namely ‘ordered water monolayer that does not completely wet water’at room temperature [41].Similar phenomena have been observed in experiments and simulations on many other surfaces.For example,Phan et al [42] shown the molecular structure and dynamics in the water monolayer at hydroxylated oxide surfaces including SiO2and Al2O3.Lützenkirchen et al [43]experimentally found the coexistence of ordered water and the water droplet on the surface of sapphire.We have found a nonmonotonic relationship between the contact angle of water droplets and the surface polarity on the hexagonal charge patterns solid model surface at room temperature,and there was once up to six times difference in the solid–water interactions in spite of the same contact angle values [44].The existence of the hydrophobic-like water monolayer leads to the novel nonmonotonic relationship.
The wetting properties of minerals have an important influence on the transportation and extraction process of water,oil and gas.There are many kinds of minerals in nature,which enable us to study the influence of surface properties such as surface microstructure and surface polarity on the wetting properties.Talc is a common silicate mineral and the softest mineral known.Talc has a wide range of applications,such as refractory materials,papermaking,rubber fillers,pesticide absorbents,leather coatings,cosmetic materials and carving materials [45].Many works [46–50] pay much attentions to talc because of its peculiar behavior with respect to water: the high water adsorption at low humidity indicates that there are strong water binding sites on talc[46,47],while the high contact angle indicates that the talc surface is hydrophobic [46–49].Rotenberg et al [47] shown the phenomenon of the water droplets coexisting with the water monolayer on the talc surface.Ou et al [51] proposed the hydrophobic mechanism of some polar minerals,which is attributed to that the surface cavities can effectively trap water molecules,and this trapping effect can significantly reduce the hydrogen bond interactions among interface water and cause considerable hydrophobicity.However,there is still lack of a systematic study to understand how the surface charge in the talc affect the dynamics and wetting behaviors of water molecules contacting on the talc surface.
In this work,molecular dynamics simulation was used to explore the wetting characteristics of high adsorption talc-like surface.The surface of talc was modified by changing the charge of hydrogen atom and oxygen atom in –OH group(keeping the surface neutral) while keeping the remaining surface atoms unchanged.With the increase of the charge of hydrogen atom of the surface–OH group,the droplet contact angle decreased monotonously from the initial value of 91°,and finally stabilized at about 50°.The charge of the surface hydroxyl groups greatly affects the density distribution and dipole orientation of the interfacial water.The equilibrium state simulation result shows that there is a dense water monolayer between the surface with larger charge of hydrogen atom and the liquid water droplet,and each water molecule in the water monolayer is trapped in the cavities of the modified surface.The water molecules in the water monolayer show an extremely uniform dipole arrangement,i.e.along the surface normal direction.Only a few hydrogen bonds can be formed between the water monolayer and the water molecules above,which leads to the hydrophobicity of the water monolayer.As a comparison,we also simulated the wetting behavior of the model surface that reduced the polarity of the surface –OH groups.As expected,the contact angle of the droplet decreased due to the reduction of solid–water adhesion strength.
2.Methods
Talc is a layered polar nanoporous mineral (see figure 1(a)).Each clay sheet contains two hexagonal network layers composed of Si–O tetrahedron,and the –OH groups are located in the center of Si–O tetrahedron grid.There is an octahedral magnesium layer between the two silicon oxide layers.On the talc(001)surface,there are hexagonal cavities with a depth of 2.3 Å,the distance between the centers of adjacent cavities is 5.3 Å.Hydroxyl groups are perpendicular to the sheet and can participate in hydrogen bonding with water.We modified the surface polarity by changing the charge distribution of–OH group,i.e.the charge of hydrogen increased from initial value qH= 0.425 e by δqand the charge of oxygen decreased from qO= -0.95 e by δq,where δqvaries from-0.3 e to 0.9 e.Overall,the modified surfaces were neutral.A talc sheet with a thickness of 0.664 nm was used in subsequent simulations.
Two series of simulations were performed.The simulation systems containing 1138 water molecules were used to calculate contact angles.The simulation systems containing a 3 nm thick water film with 6654 water molecules were used to analyze the water–water interaction and the water density distribution and kinetic information such as mean square displacement (MSD) of water molecules.The solid surface was set parallel to the x–y plane.The size of simulation box was 9.956 × 9.990 × 20.000 nm3.All simulations were performed in a constant volume and constant temperature(NVT)ensemble through the GROMACS-5.0.7 package[52],with a time step of 1 fs.The temperature was maintained at 300 K.Each system was conducted for 30 ns and the last 20 ns data were used for calculation.Periodic boundary conditions were used in all directions.We used the CLAYFF force field[53]to describe the interactions of the atoms on the surface and the SPC/E water model water.The particle-mesh Ewald method with a real space cutoff of 10 Å was used to treat long-range electrostatic interactions and 10 Å cutoff was applied to the van der Waals interactions.Geometric criteria[54] was used to determine H bonds,where two water molecules (or –OH group with a water molecule) were hydrogen bonded if the O-O distance was less than 3.5 Å and simultaneously the angle H-O···O was less than 30°.Figure 1(e) shows the illustration of contact angle θ.We determine the contour of the droplet by calculating the water density map in the plane of the droplet centroid.The curve with a density equal to half of the bulk water density was then used to fit a circle.Finally,the contact angle was measured by making a tangent at the intersection of the circle and the surface.We choose the direction perpendicular to the surface(z direction) to calculate the MSD of interface water.
3.Results and discussion
3.1.Structural information of interfacial water
The simulation results show that as the increase of the charge of hydrogen atom of the surface hydroxyl groups,the contact angle of the droplets decreases significantly.Figures 1(a)–(d)show the corresponding equilibrium simulation system with δq= -0.3 e,δq= 0 e,δq= 0.3 e and δq= 0.6 e,respectively.The formation of water droplets is observed throughout the entire series of simulations.For the surfaces with δq= 0 e and δq= -0.3 e,all the water molecules condense into a droplet with a large contact angle over 90°.When δqfurther increases to 0.3 e,there are also water droplets on the solid surfaces.However,the water molecules located between the liquid water droplets and the surfaces,which are shown in blue in figure 1(c).This wetting phenomenon is similar to our previous novel wetting ‘ordered water monolayer that does not completely wet water’ at room temperature [41].These results are different from the conventional view that the solid surfaces are hydrophilic,because the hydroxyl groups may form hydrogen bonds with water molecules and interact strongly with water.When δqis larger than 0.4 e,the contact angles almost keep constant at around 50°.
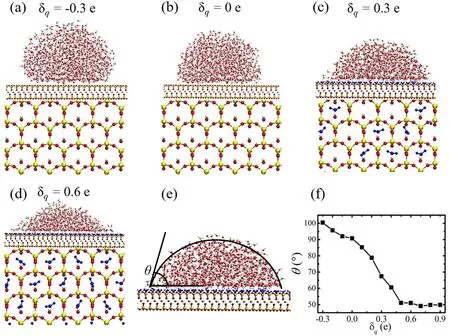
Figure 1.Side and top view snapshots of droplets on the modified model surfaces with(a)δq= -0.3 e,(b)δq= 0 e,(c)δq= 0.3 e and(d)δq= 0.6 e.Spheres in red,white,yellow and pink represent oxygen,hydrogen,silicon and magnesium,respectively.Water molecules trapped by the surfaces are highlighted in blue color.(e) The illustration of contact angle θ.(f) Relation of the contact angle of the water droplet with δq.
This new wetting behavior with particular water monolayer when δq≥0.2 e is different from that on the weak polar or nonpolar solid surfaces,such as graphite [55,56].The top view snapshots shown in figures 1(c),(d) show that some water molecules are distributed between the model surfaces and the droplet.With the increase of δq,more and more water molecules are adsorbed by the surface due to the strong adhesion and a water layer finally formed as δq= 0.2 e.It is worth noting that each water molecule in the water monolayer corresponds to the–OH group of the talc surface.This shows that these water molecules in the monolayer are trapped by surface–OH groups,which are locating at the center of Si–O tetrahedron grid.Generally,the pores on the mineral surface are considered to be water-free under ambient conditions,and water will intrusion into the pores only under high water pressure.The simulation results show that,the existence of the strong binding sites of the cavities can adsorb the water molecules under low pressure conditions.
Figure 2 shows the atomic density ρ distribution of water oxygen near the surfaces corresponding to δq= 0 e,δq= 0.2 e,0.4 e and δq= 0.6 e as a function of the distance from the surface.The change of the charge of hydrogen and oxygen in–OH group has little effect on the density distribution of water molecules which are more than 7 Å away from the surface.
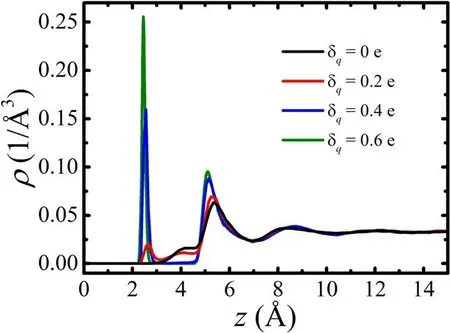
Figure 2.The density distribution of oxygen atoms in the water near the surfaces.The position of the plane where the hydroxyl oxygen atoms on the surface are located is defined as the reference(z = 0 Å).The black,red,blue and olive curves correspond to δq= 0 e,δq = 0.2 e,δq = 0.4 e and δq = 0.6 e,respectively.
For the modified model surfaces with δq< 0.2 e,the density distribution of water molecules is almost the same as that of the original talc surface(δq= 0 e).For these surfaces,the first peak of the density appears at 5.3 Å from the surface,which corresponds to the water molecules interacting with the hexagonal Si–O rings of the surfaces with a height of 4 Å.Thus,the thickness of the first layer of water is 4 Å(3 Å ≤ z < 7 Å).The width of the second peak is 3.5 Å,and we consider that the thickness of the second water layer is 3.5 Å (7 Å ≤ z < 10.5 Å).The density of water molecules is close to that of bulk water when z >10.5 Å.For convenience,we can assume that the thickness of the third(10.5 Å ≤ z < 14 Å) and fourth layer (14 Å ≤ z < 17.5 Å)to be the same,i.e.3.5 Å.
For the modified model surface with δq= 0.2 e,there is a peak of ρ at the distance of 2.5 Å from the surface,corresponding to the trapped water.As δqfurther increases,the peak becomes more prominent.In fact,only a few water molecules are trapped by the surface with δq= 0.2 e.For convenience,we define that the first peak shown in figure 3 with δq≥ 0.2 e corresponds to the water monolayer.After the appearance of the water monolayer,the density distribution of water molecules in the droplet changes little.Similarly,we choose the water layer according to the distance of water molecules to the solid surfaces: 0 Å ≤ z < 3 Å as the first layer,3 Å ≤ z < 7 Å as the second layer,7 Å ≤ z < 10.5 Å as the third layer and 10.5 Å ≤ z < 14 Å as the fourth layer.The position of the original nth layer of water corresponds to the current (n + 1)th water layer.
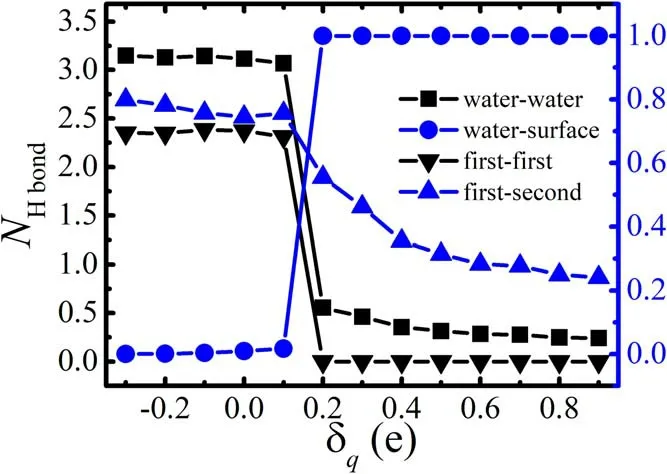
Figure 3.Average number of H bonds formed by a water molecule in the first layer with other water molecules in the same layer(▼)and by a water molecule in the first layer with the water molecules above the layer with respect to δq,together with their sum (■).The blue circlesrepresent the average number of H bonds formed by a water molecule in the frist layer with the surface–OH groups.The black and blue dots correspond to the left and right vertical axes respectively.
In order to understand the physical mechanism that causes the novel hydrophobicity of this highly polar surface,we calculate the number of hydrogen bonds(NHbond)formed by water molecules in the first layer in each system with different δq.We mainly calculate the H bonds of water molecules in the first layer with other water molecules in the same layer (first–first H bond),between the first and second layer (first–second H bond),and between the first layer and the surface –OH groups (water–surface H bond).We also calculate the water–water H bonds,which is the sum of first–first H bond and first–second H bond.
For the systems with δq< 0.2 e,almost no water molecules are distributed within 3.5 Å from the surface (see figure 3,δq= 0 e),so there is almost no H bond between water and surface.The surface–water adhesion is very weak;thus the surface is hydrophobic.When δqexceeds the critical values of 0.2 e,the water monolayer appears,and each water molecule in the monolayer forms one H bond with the surface–OH group.The sharp increase of the number of water–surface hydrogen bonds indicates that the interaction between surface and interfacial water is greatly enhanced.
The polarity of the–OH groups on the surface also has a great influence on the interaction between the water molecules near the surface.As shown in figure 3,the number of water–water H bonds with δq< 0.2 e fluctuates little with δq.When δq= 0.2 e,the number of water–water H bonds is greatly reduced.For interface water,there seems to be a competition for H bond formation between water–surface H bond and water–water H bond.The increase of the former leads to the decrease of the latter.The competition between these two types of H bonds represents the competition between the surface–water adhesion and the water–water cohesion.Since the distance between adjacent cavities is as long as 5.3 Å,the interaction between water molecules trapped in them is very weak and cannot form H bonds.With the increase of δq,the number of first–second H bonds decreases,showing that the interaction between the water molecules in the first layer and those in the second layer decreases.Overall,trapping effect significantly weakens the water–water interaction of the first–second water layer.Thus,the water molecules assemble a water droplet above the monolayer.As the increase of the charge of hydrogen atom of the surface hydroxyl groups,the number of trapped water molecules increases,indicating the stronger surface–water adsorption energy.Particularly,the number of trapped water molecules reaches the saturation for the surfaces with δq≥ 0.5 e.The total number of H bonds formed between the water monolayer and the droplets changes little with the increase of the polarity of the surface–OH groups.Therefore,the contact angle of the droplet remains stable.
In addition,we study the dipole orientation of water in the first layer,φ,i.e.the angle between the water dipole and the surface normal direction.The results are shown in figure 4.For the original talc surface,although no water molecule near the surface is trapped by the surface –OH groups,the dipole orientation of water molecules in the first layer tends to be biased toward the z direction.The dipole distribution of water molecules in the first layer with δq< 0.2 e is similar to this.In the two systems with δq= 0.2 e and δq= 0.9 e,the dipole directions of the water molecules in the first water layer (water monolayer) are highly uniform and perpendicular to the surface.It should be noted that the surface adhesion varies greatly with different δq.
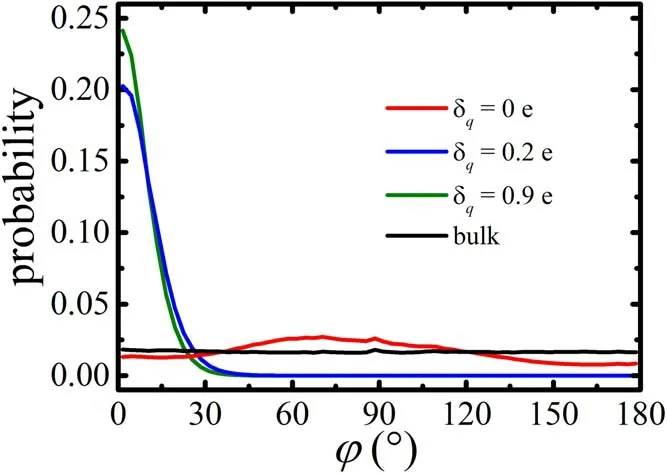
Figure 4.Distribution of the angle φ between the dipole orientation of the water molecules in the first layer and the surface normal direction (z direction).The red,blue and olive curves correspond to δq = 0 e,δq = 0.2 e and δq = 0.9 e,respectively.The dipole distribution of the bulk water molecules is shown in black.
For the system with δq= 0.2 e,although the surface–water interaction is relatively weak,this interaction is sufficient to greatly affect the dipole direction of the trapped water molecules.Almost all trapped water molecules have an angle φ between the water dipole direction and the surface normal direction in the range of 0–30°,no matter how many water molecules are trapped.Due to this constrain of the arrangement of the specific dipole direction,the water molecules in the water monolayer cannot adjust their position to form more hydrogen bonds with the water molecules above the water monolayer.Therefore,only a few H bonds can be formed between the water monolayer and the water molecules above.The water molecules above then aggregate into one droplet.
3.2.Dynamic behaviors of interfacial water
In addition,we investigate the dynamic behaviors of interfacial water.Although water–surface H bonds number is maintained at 1 for different systems with δq≥ 0.2 e,their corresponding H bonds strength is quite different.The length of the H bond lifetime is a manifestation of the strength of the H bond.The longer the H bond lifetime is,the more difficult the H bond is to be broken and the higher the H bond strength is.We first calculate the water–surface H bond lifetime for systems with δq≥ 0.2 e,as shown in figure 5(a).For the systems with δq< 0.2 e,no H bond is formed between the water molecules and solid surface.
The relaxation time of the water–surface H bonds is characterized by the H bond autocorrelation function

where h(t) = 1 if the tagged water–OH pair is continuously hydrogen bonded from time 0 to time t,and h(t) = 0 if the tagged hydrogen bond has been broken at time t.Thus,C(t)Hbonddescribes the probability with which a water–OH pair becomes hydrogen bonded at time t = 0 and continuously hydrogen bonded at time t.We obtain the water–surface H bond lifetime,τ,by fitting C(t)Hbond,with the single exponential function C(t)Hbond= Ae-t/τ.For the system with δq= 0.2 e,the water–surface H bond lifetime is 22.91 ps,which is even smaller than the water–water H bond lifetime near some surfaces [57].The water–surface H bond is easily destroyed by the thermal disturbance of water molecules,and the surface–water interaction is weak.As δqincreases,the water–surface H bond lifetime increases rapidly.The H bond lifetimes corresponding to δq= 0.3 e and δq= 0.4 e are 96.41 ps and 529.09 ps,respectively.For the system with δq= 0.5 e,the value exceeds 8 ns.When δq> 0.4 e,the extremely long water–surface H bond lifetime indicates that the water–surface interaction is extremely strong,and the trapping effect is saturated.
We also calculate the residence time of water molecules in the first water layer(see figure 5(b)).The relaxation time of residence is characterized by the residence autocorrelation function

where g(t) = 1 if the tagged water is resident in the first water layer from time 0 to time t,and g(t) = 0 if the tagged water has diffused to other water layers.Therefore,C(t)Residencedescribes the probability with which a water molecule is distributed in the first water layer at time t = 0 and continuously resident in the same water layer at time t.The residence time,τ,is then obtained by fitting the autocorrelation function,C(t)Residence,with the single exponential function C(t)Residence= Ae-t/τ.For the system with δq= 0.2 e,the residence time of water molecules in the first layer is only 2.56 ps.This is consistent with the above results,indicating that the trapping effect is relatively weak.Only a few water molecules are trapped by the surface,and these water molecules are easy to separate from the water monolayer and diffuse to the second water layer due to the cohesion.With the increase of δq,the residence time of water molecules in the first layer becomes longer and longer.The residence time exceeds 12 ns when δq= 0.5 e.The strong interaction between water molecules and the surface leads to an extended residence time around the surface.

Figure 5.(a)Plots of time-dependent water–surface H bond autocorrelation function C(t)Hbond for δq= 0.2 e,δq= 0.3 e,δq= 0.4 e and δq= 0.5 e.(b)Plots of time-dependent residence autocorrelation function C(t)Residence for δq= 0.2 e,δq= 0.3 e,δq= 0.4 e and δq= 0.5 e of molecules in first water layer.
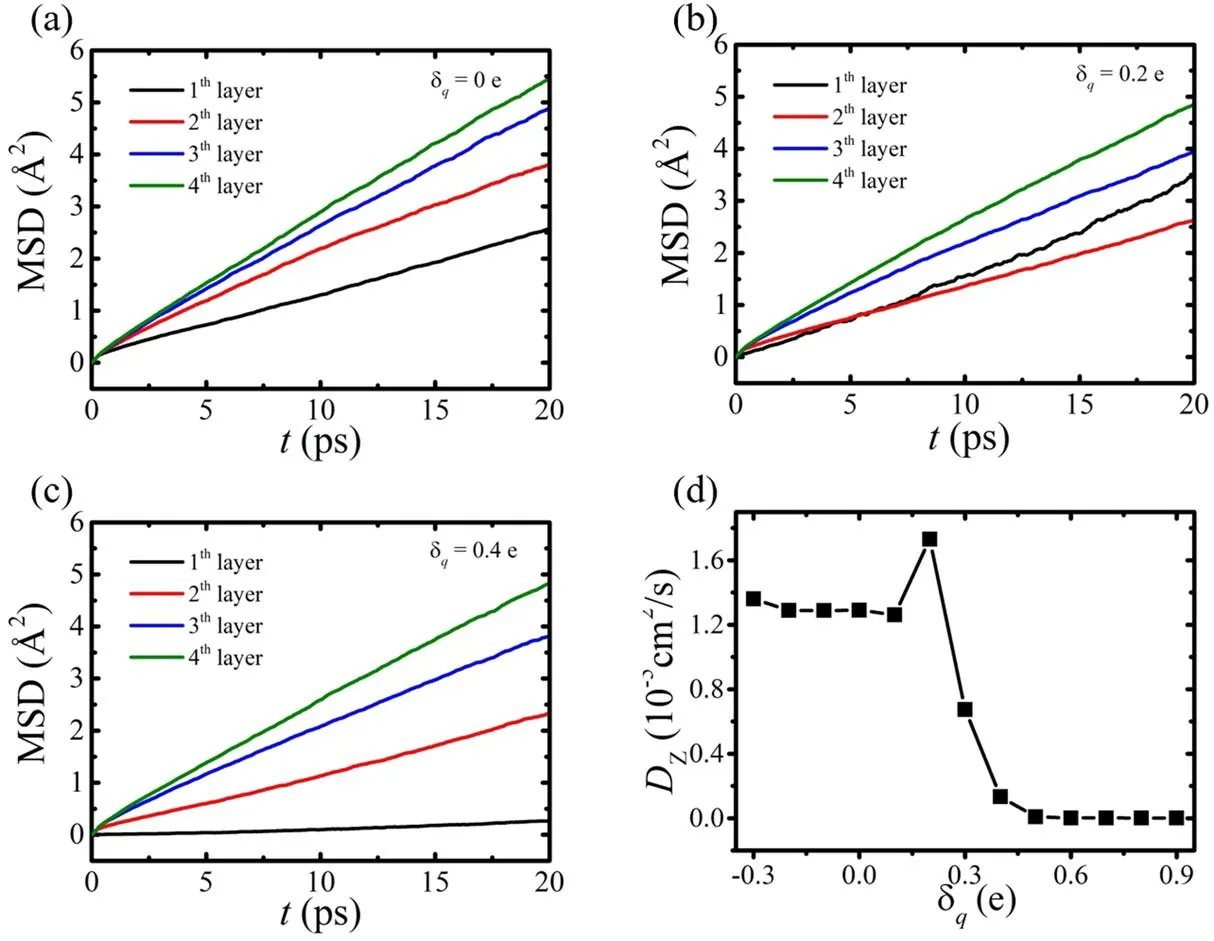
Figure 6.(a)–(c) Mean square displacement in z direction of the water molecules in various layers for δq = 0 e,δq = 0.2 e and δq = 0.4 e,respectively,versus time t.(d) Relation of the self-diffusion coefficient Dz of water molecules in the first layer with δq.
The diffusion of interfacial water molecules is also studied.We analyze the diffusion in z direction of the water molecules in first four layers near the surface of different systems.Three typical systems with δq= 0 e,δq= 0.2 e and δq= 0.4 e are chosen and the results are shown in figures 6(a)–(c).It can be seen that there is a clear linear relationship between the MSD of water in different layers of all systems and time t.Except for the first water layer of the system with δq= 0.2 e,the water molecules in all systems exhibit the characteristic that the closer to the surface,the smaller the MSD.The interfacial water molecules diffuse much more slowly due to the interaction with the surface.For the systems with δq= 0.2 e and δq= 0.4 e,the MSD of water molecules in the same water layer is very close except for the first layer,which indicates that the polarity of –OH group on the surface has little effect on the diffusion of water molecules in the droplet.The diffusion of water molecules in the first layer near the surface of δq= 0.2 e is faster than that in the second layer.The fierce competition between adhesion and cohesion makes the water molecules in the water monolayer in an unstable state.The water molecules in the water monolayer are easily separated from the surface adsorption sites and frequently exchange with the water molecules above.This also leads to shorter residence time and water–surface H bond lifetime.When δqincreases to 0.4 e,the MSD of water molecules in the water monolayer is almost 0,indicating the water molecules are strongly trapped with immobile state.
According to the slope of the MSD curve,the self-diffusion coefficient of the interface water can be calculated.Figure 6(d) shows the self-diffusion coefficient Dzof water molecules in the first layer near different surfaces.For the systems with δq< 0.2 e,the self-diffusion coefficient of water molecules in the first water layer near the surface is very close.When δqincreases to 0.2 e,the water molecules in the water monolayer have a greater self-diffusion coefficient.As δqfurther increases,the self-diffusion coefficient decreases rapidly.For the surfaces with δq> 0.4 e,the self-diffusion coefficient is close to zero,indicating that the trapped water molecules hardly diffuse.The trapped water molecules seem to become part of the surface,forming a water–surface combination.As a result,it does not completely wet the surface.
4.Conclusion
Our simulation results show that the polarity of the surface has a great influence on the wettability of talc.The modified talc-like surface with a large number of strong polar hydroxyl groups is not completely wetted by water.This hydrophobic behavior is different from the direct adsorption of water on the weak adhesion surface.With the increase of the charge of hydrogen atom of the –OH groups on the surface of talc,the adhesion is enhanced.The contact angle of the droplets near the surface decreased from 91° to 50°,reflecting the significant increase of surface hydrophilicity.However,as the further increase of the charge of hydrogen atom of the –OH groups,the contact angle will not change.The increase of the charge of hydrogen atom of the –OH groups leads to the trapping effect of surface cavity on water molecules.More and more water molecules are trapped in surface cavities until a water monolayer is formed.Each trapped water molecule in the water monolayer hardly participates in the hydrogen bond interaction with other water molecules except for forming one H bond with the surface –OH group.The trapping effect significantly weakens the water–water interaction,which make the first water layer more hydrophobic.This wetting behavior is similar to our previous work,namely ‘ordered water monolayer that does not completely wet water’ [41],where the formation of dense water monolayer near the solid surface makes the strong polar surface show abnormal hydrophobicity.However,there is no H bond network formed in-between the water monolayer in the talc surface in this work,different from the two-dimensional hydrogen bond network formed in-between the water molecules in the previous works.
This interface water interaction mechanism may have implications to other clay minerals with similar microstructure,such as mica,pyrophyllite,kaolinite,montmorillonite,etc.The results have certain guiding significance for the wettability of polar nanoporous minerals,and can also provide theoretical support for the design of new hydrophilic or hydrophobic materials.We hope that our results also provide theoretical references for water treatment,catalysis,drug transportation,oil and gas exploitation and other processes involving minerals.
Acknowledgments
This work was supported by the National Natural Science Foundation of China (Grant No.12022508,12074394,11674345),the Key Research Program of Chinese Academy of Sciences (Grant No.QYZDJ-SSW-SLH019),and the Sichuan Science and Technology Program (Grant No.2017YJ0174).The MD simulations were performed with the Deepcomp7000 and ScGrid of the Supercomputing Center,the Computer Network Information Center of the Chinese Academy of Sciences,and the Shanghai Supercomputer Center of China.
杂志排行
Communications in Theoretical Physics的其它文章
- Wormhole solutions and energy conditions in f(R,G) gravity
- The interference between a giant atom and an internal resonator
- Optical soliton in a one-dimensional array of a metal nanoparticle-microcavity complex
- Impurity effects of the Λ hyperon in the hypernuclear systems Mg and Si
- Constraint on nuclear symmetry energy imposed by f-mode oscillation of neutron stars
- Valley-resolved transport in zigzag graphene nanoribbon junctions
