Direct observation of the scaling relation between density of states and pairing gap in a dirty superconductor∗
2021-10-28ChangJiangZhu朱长江LiminLiu刘立民PengBoSong宋鹏博HanBinDeng邓翰宾ChangJiangYi伊长江YingKaiSun孙英开Wu武睿JiaXinYin殷嘉鑫YouguoShi石友国ZiqiangWang汪自强andShuhengPan潘庶亨
Chang-Jiang Zhu(朱长江) Limin Liu(刘立民) Peng-Bo Song(宋鹏博) Han-Bin Deng(邓翰宾)Chang-Jiang Yi(伊长江) Ying-Kai Sun(孙英开) R Wu(武睿) Jia-Xin Yin(殷嘉鑫)Youguo Shi(石友国) Ziqiang Wang(汪自强) and Shuheng H.Pan(潘庶亨)
1Beijing National Laboratory for Condensed Matter Physics,Institute of Physics,Chinese Academy of Sciences,Beijing 100190,China
2School of Physical Sciences,University of Chinese Academy of Sciences,Beijing 100049,China
3CAS Center for Excellence in Topological Quantum Computation,University of Chinese Academy of Sciences,Beijing 100190,China
4Laboratory for Topological Quantum Matter and Advanced Spectroscopy(B7),Department of Physics,Princeton University,Princeton,NJ,USA
5Songshan Lake Materials Laboratory,Dongguan 523808,China
6Department of Physics,Boston College,Chestnut Hill,MA,USA
Keywords: NbC,dirty superconductor,de Gennes theory,scanning tunneling microscope
1. Introduction
In many important applications of superconductors,such as to lossless electric power transmission and to superconducting magnets for magnetic resonance imaging and particle accelerators, the superconducting materials are not ideal single crystals. Instead,they often contain impurities,including chemical impurities and physical impurities (defects and inhomogeneities) or can even exist in an amorphous state or as alloys. Chemical impurities or defects have also been purposely introduced into superconductors to control the pinning effects of vortices and achieve better performance in magnetic fields. Therefore,the study of these so-called dirty superconductors is important for both fundamentals and applications.In his celebrated work“Theory of Dirty Superconductors”in 1959, P. W. Anderson studied the striking experimental fact that Bardeen–Cooper–Schrieffer (BCS) superconductivity is often insensitive to enormous amounts of nonmagnetic physical and chemical impurity. He showed that the BCS pairing interaction plays a much more unique role in superconductors with scattered states than it does in pure ones.[1]Dirty type-II superconductors in high magnetic fields present much significant challenges in terms of theoretical calculations and experimental investigations. One of the complications is that the density of states,pairing potential,and magnetic field distribution are nonuniform because of the formation of magnetic vortices.In 1964,P.G.de Gennes studied the“Behaviors of Dirty Superconductivity in High Magnetic Fields”[2]in the diffusive regime,where the normal state mean field path is much smaller than the superconducting coherence length(l ≪ξ). The hallmark of this theoretical work is a remarkable prediction:When a dirty type-II superconductor is placed in high magnetic fields of its mixed state,the local electron density of states depends only on the pair potential at the same position, regardless of the local magnetic field. Practically,this theoretical prediction can be expressed in a very concise and explicit scaling form as follows:

whereris the distance from the center of the vortex,N(r) is the local density of states at zero-energy at positionr,Nis the normal-state density of states,Δ(r) is the superconducting energy gap, andΔ0is the energy gap in zero-field.[2,3]It is important to note that de Gennes’ derivation of this scaling expression(Eq.(1))was performed in the critical regime,where the magnetic field strength is close toHc2. Therefore,Δ(r)/Δ0can be treated as an expansion parameter,and highorder corrections to the scaling form are expected. This explicit scaling expression is of conceptual significance to the understanding of dirty superconductors in the mixed state and should be amenable to local probes of the density of states and pairing energy gap. However, to the best of our knowledge,such a remarkable prediction of scaling behavior has not been directly observed experimentally.[4]
The direct experimental demonstration of this prediction requires spectroscopic measurements with high spatial resolution. Scanning tunneling microspectroscopy (STM/S) is a spectroscopic technique with high spatial and energy resolution. It has been successfully employed in investigations of the electronic structures of superconductors,particularly in the exploration of the effects of impurities,magnetic vortices,and microscopic inhomogeneities in unconventional superconductors, where all these effects are highly local.[5–13]In this article, we present a direct experimental study of this theoretical prediction by performing STM/S experiments on the transition metal carbide superconductor NbC, which has a number of excellent properties for various applications, including high hardness, high melting point, and corrosion resistance,among others.[14–16]The superconductivity of NbC was first reported in 1952, and its critical temperature was found to be approximately 11 K, which is higher than that of elemental Nb.[17–19]Early planar junction tunneling experiments on NbC films prepared by laser ablation demonstrated that NbC is a clean superconductor with intermediate electron–phonon coupling.[20]Submillimeter electrodynamic measurements of such thin films have also demonstrated that the electrodynamic parameters of NbC are in agreement with those derived from BCS theory.[21]Recently, several theoretical and experimental works on this material found evidence for a topological band structure and possible unconventional superconductivity. Overall,these findings generated renewed interest in NbC within quantum materials research.[22,23]
Our measurements on NbC single crystals demonstrate that the STM/S spectrum in the superconducting state is spatially homogeneous across the surface, irrespective of the“dirtiness”, such as various disorders and normal-state electronic inhomogeneity visible in the topography. This indicates that the NbC studied here is a diffusive superconductor consistent with the class of homogeneous, dirty superconductors envisioned by de Gennes.Further,we found that the Caroli–de Gennes–Matricon (CdGM) vortex-core bound states, usually seen in clean superconductors,were absent inside the isotropic and well-ordered Abrikosov vortices in a perpendicular magnetic field. Scanning outward from the vortex core center,we found that the zero-bias local density of statesN(r)decreased continuously along with the increase of the local pairing gapΔ(r),indicating a gradual recovery of superconductivity. We also found that such spatial evolution agrees remarkably well with the scaling form predicted by de Gennes(Eq.(1)).On the basis of these observations, we derive a simple experimental scheme for estimating the superconducting coherence lengthξfor dirty superconductors in the mixed state.
2. Experiment
The single crystals of NbC used in this work were grown from Co flux. The starting materials, which had a molar ratio of Nb:C:Co=1:1:9, were put into an alumina crucible and heated to 1500°C in an argon-filled furnace for 20 h. Then, the furnace was slowly cooled down to 1300°C at a rate of 1°C/h and finally allowed to cool down naturally to room temperature. The single crystals were separated by washing off the excrescent Co flux with hydrochloric acid.[23]All STM/S measurements were conducted using a home-built ultra-high-vacuum low-temperature scanning tunneling microscope (STM) with a base temperature of 1.25 K and a 9-T superconducting magnet. The tungsten STM tips were fabricated using the electrochemical corrosion method and cleaned by a field emission process against a gold target.The single-crystal samples were precooled in the cryostat and then cleaved at~10 K before insertion into the microscope for measurements. We used the standard lock-in technique to acquire the differential conductance spectrum with a modulation voltageVmodof 30–100µVrmsand a frequency of 781.1 Hz.
3. Result and discussion
NbC has a face-centered cubic(FCC)crystal structure in the space groupFm¯3m, as shown in Fig. 1(a) (inset). The results of x-ray diffraction (XRD), resistivity, and magnetic susceptibility measurements of the NbC crystals shown in Figs.1(a)–1(c),respectively,demonstrated the high quality of the single crystals. The average crystal size chosen for our experiments was a couple of millimeters across. Because of their FCC ionic structure, cleaving these single-crystal samples to achieve flat exposures was rather difficult. By using thein situcold cleaving technique, we were able to obtain a number of macroscopically flat and smooth areas of sufficiently high quality for STM/S measurements. Figure 1(d)shows an optical image of such a cold-cleaved sample,revealing the small,mirror-like,macroscopically flat areas. Most of the time, these flat areas were microscopically disordered, as shown in Fig.1(e). Occasionally,we observed areas with terraces. Figure 1(f)shows an STM image of an area with atomically flat terraces and an atomic-resolution image zoomed in on one of the flat terraces (inset). The diagonal distance of the square lattice in the image is approximately 4.5 °A,which agrees well with the FCC unit-cell lattice constant of 4.506 °A determined by XRD.[24]On the basis of the conclusion of the early REED experiments,it is likely that the atomic-resolution STM image made the carbon lattice visible.[25]

Fig. 1. Structure of single-crystal NbC and the exposed surface after cold cleaving. (a) Results of the x-ray diffraction measurements with a face-centered cubic structural model of NbC (inset). (b) Resistivity measurement results. (c)Magnetic susceptibility measurement results.(d)Optical image of the cleaved NbC single-crystal sample with dimensions 2.5×4 mm,showing a number of small mirror-like macroscopically flat areas.(e)STM image of a disordered(001)surface(T=1.3 K,Vs=−100 mV,It=10 pA). (f)STM image of a(001)surface with flat terraces (T =1.3 K, Vs =100 mV, It =1 nA). The inset shows an atomically resolved high-resolution image zoomed in on a flat terrace.

Fig. 2. STM images of two types of surface exposure and the dI/dV spectra showing the almost identical homogeneous superconducting states on the two different NbC surfaces. (a) Topographic image of a disordered area (T =1.3 K,Vs =100 mV, It =10 pA). (b) Atomically resolved topographic image. The green and orange arrows label the two types of atomic defects(T =1.3 K,Vs=10 mV,It=1 nA).(c)dI/dV spectra taken along the red dotted line marked in(a)(T =1.3 K,Vs =10 mV,It =1 nA,Vmod =100 mVrms). (d) dI/dV spectra taken along the red dotted line marked in(b)(same measurement conditions as for(e)). The spectra are offset vertically for clarity.
As illustrated above, we were able to expose two types of flat area,both suitable for STM experiments. One of these was characterized by a high degree of roughness and was impossible to image with atomic-resolution(Fig.2(a)),whereas the other was atomically flat and suitable for atomic-resolution imaging. Figure 2(b) shows a high-resolution image of the latter type of area. It can be seen that, in addition to the resolved atomic lattice, point defects are also visible. The defect labeled by the green arrow appears to be an adatom residing at the interstitial site, whereas the one labeled by the orange arrow appears to be an atomic vacancy of the lattice.It should also be pointed out that the regions without defects still do not appear to be uniform, indicating that the normal density of states was electronically inhomogeneous. Judging by the quality of the crystal,these disorders were most likely caused by debris, defects, and surface reconstructions resulting from cleaving the ionic crystal. We conducted scanning tunneling spectroscopic(STS)measurements on both types of surface area. Figures 2(c) and 2(d) plot the dI/dVspectra acquired at a temperature of 1.3 K and along the red dotted lines marked in Figs.2(a)and 2(b),respectively. All the spectra exhibited a U-shaped superconducting energy gap feature with well-defined coherence peaks. Remarkably, the spectra on these two different types of surface were extremely uniform and almost identical, demonstrating that the superconducting state of NbC is homogeneous and robust against impurity, disorder, and electronic inhomogeneity. These behaviors stand in striking contrast to those observed in unconventional superconductors.[5–7,11–13]On the one hand,the fact that all the spectra were uniform and identical, even those taken on top of the point defects (impurities), could indicate that the crystal sample was free of residual Co atoms (if it had any, it could only be a minuscule amount). Otherwise, the signatures of Yu–Shiba–Rusinov states would have been observed in the superconducting tunneling spectra taken on the Co impurities, a phenomenon ubiquitous in the case of magnetic impurities in superconductors.[26–29]On the other hand,the uniformity and robustness of the tunneling spectra could also be regarded as indications of highly dirty superconductors with nonmagnetic disorders[1]and a superconducting coherence length much larger than the mean free path.
Because the spectra at different locations were almost identical, it was reasonable to fit the normalized average dI/dVspectrum with a single BCS s-wave gap function using the Dynes equation[30]

Here,Ns(E)is the density of states at energyE,Δis the magnitude of the superconducting energy gap, andΓis the decoherence term, which is inversely proportional to the quasiparticle lifetime and damps the coherence peaks in the tunneling spectrum. In Fig. 3(a), the dark open circles represent the normalized average data of the superconducting spectrum measured at 1.3 K, and the red curve is the fitting result. The almost perfect fit of the experimental data gives an isotropic superconducting energy gap with a magnitude ofΔ=1.85 meV at 1.3 K and a decoherence term ofΓ=0.08 meV,slightly larger than the gap value of 1.81 meV obtained from a planner junction measurement.[20]Figure 3(b)plots the temperature-dependent dI/dVspectra, which were also fitted with the Dynes equation (solid lines). It can be seen that all the spectra could be fitted to an isotropic BCS gap function extremely well. It can also be observed that, as the sample temperature was raised,the energy gap decreased,and the coherence peaks in the spectra were broadened. Figure 3(c)depicts the temperature dependence of the superconducting energy gap,where the black open circles mark the superconducting gap values and the green open squares mark the decoherence values, all extracted from the fit. When the temperature increased,the superconducting gapΔ(T)first decreased slowly and then dropped rapidly, whereas the decoherence termΓ(T)increased monotonically. As also depicted in Fig. 3(c), the temperature dependence of the energy gap very closely followed the relationship proposed by BCS theory(solid red line). Simultaneously,there was a valid concern about the error in the fitting process.One can use a normalizedχ2as a measure of the quality of the fit,[31]wherenis the number of data points in the curve,pis a fitting parameter,xis the measured data value,andfis the fit value.
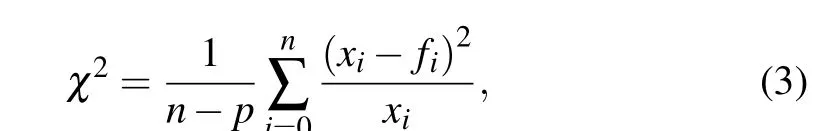
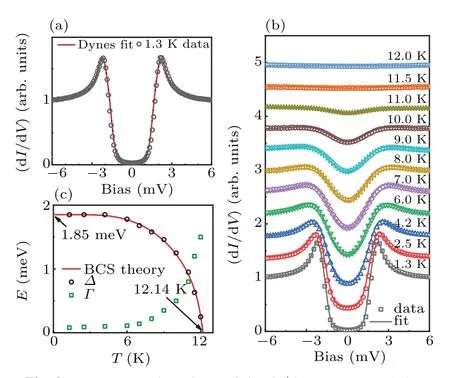
Fig. 3. Temperature dependence of the dI/dV spectrum. (a) Averaged dI/dV spectrum fitted with the Dynes equation (T =1.3 K,Vs=10 mV,It=1 nA,Vmod=100 mVrms). The circular marks represent the experimental data taken at 1.3 K.The red solid curve represents the theoretical fitting with the Dynes equation. (b) dI/dV spectra as a function of temperature. The solid curves are the results of fitting with the Dynes equation. (c)Temperature dependence of the superconducting gap energy Δ and the decoherence term Γ. The black solid curve is fit to the BCS theoretical prediction.
Using this error analysis as the guide for the fit, we obtained the best fits for all the spectra and found that theχ2values for all our fits were smaller than 0.2%, indicating a very small fitting error. We can thus confidently extrapolate the transition temperatureTcto be 12.14±0.02 K,which was higher than the bulkTcof 11.5 K determined by the magnetic susceptibility measurement. Considering that STM/S is a surface technique specifically sensitive to the electronic properties of the surface,the higherTcobtained in our STS measurement can be reasonably ascribed to the surface enhancement of superconductivity.This reasoning makes sense,because our resistivity measurement gave an onsetTcof 12.3 K,higher than the bulkTcof 11.3 K from the susceptibility measurement,as shown in Figs. 1(b) and 1(c). This is explained by the fact that if the surface superconducts at a higher temperature than the bulk transition temperature,it will shunt the bulk resistance and lead the resistivity measurement to give the transition temperature as the surfaceTc. In contrast, in the planer junction experiment,[20]the surface exposure was covered by an insulating barrier,and the measurement thus resulted in the bulkTcof 11.3 K.Toward the low-temperature end of the fit,the spectrum of the density of states had much more pronounced quasiparticle features,including a very deep gap with a flat bottom and very sharp coherence peaks. Hence, there will be much less margin for error in the fit,and we can be more confident in extrapolating the zero-temperature gap valueΔ0=1.85 meV.With these values,we can calculate the ratio of the superconducting energy gapΔ0andTc,an indicator of the Cooper-pair coupling strength,to be 2Δ0/kBTc=3.54,which is very close to the BCS weak coupling value of 3.53.
The microscopic and spectroscopic measurements described above all demonstrated highly conventional BCS-like behaviors,with indications of NbC being a dirty superconductor. In other words,no signatures of unconventional superconductivity were detected. Magnetic fields break time-reversal symmetry and so have often been used to detect the signatures of unconventional superconductivity, particularly with impurities or magnetic vortices.[32,33]First,we applied a magnetic field of 0.6 T(half of the critical field valueHc2=1.21 T.[23])perpendicular to the measured sample surface. No indications of impurity were found. Instead, a well-ordered hexagonal Abrikosov vortex lattice could be clearly observed in the zerobias dI/dVmap, as displayed in Fig. 4(a), confirming that NbC is a type-II superconductor. All of the observed vortices had a round isotropic shape consistent with the s-wave pairing symmetry. As we reduced the magnetic field to 0.1 T,the density of the vortices decreased (as expected), and the distance between the neighboring vortices increased to approximately 136 nm. Then, we zoomed in on a single vortex to study its electronic structure in greater detail.Figure 4(b)shows a highresolution image of this single vortex. Actually,this image is a 135×135 nm zero-bias conductance(ZBC)map with a single vortex in the center. Therefore, it readily gives the highresolution ZBC line profile through the vortex (Fig. 4(c)). In Fig.4(d),we show the spatial evolution of the dI/dVspectra along the red dotted line marked in Fig. 4(b). It can be seen that the tunneling spectrum taken at the center of the vortex exhibits a featureless normal-state spectrum. Moving away from the vortex center,the superconductivity gradually recovered, indicated by the gradual development of the superconducting energy gap and the coherence peak features. Surprisingly,we did not observe the Gaussian-shaped peak pile-up of the CdGM vortex core states, which is usually present in the vortices of conventional BCS type-II superconductors.[34–36]An absence of the CdGM-states peak is usually ascribed to the enormous amount of electron scattering by impurities or defects, particularly when the superconductor is in the “dirty limit”, judged by comparing the electron mean free pathlin the material with the coherence lengthξof the superconducting state.[37]Characterization of our NbC single crystals showed the electron mean free path to be approximately 3.3 nm,which was much smaller than the coherence length of 16.5 nm.[23]Therefore,our superconducting NbC samples can be considered to be within the dirty limit, and the absence of the CdGM-states peak may have been due to impurity scattering in the normal region of the vortex core. As discussed in relation to the experimental results without magnetic fields,the superconducting state was homogeneous and robust against disorders. The spectroscopic results of our experiments revealed that the low-temperature decoherence termΓ, which partially accounts for the scattering effects, was rather small,being only approximately 4%of the superconducting gap energy. This low decoherence indicates that the scattering of the quasi-particles was diffusive, although the precise nature of the diffusive scattering is at present unclear. The decoherence term became comparable with the gap energy only as the temperature approached the superconducting transition temperature (shown in Fig. 3(c)), whereas our measurements (with and without the magnetic fields) were performed at 1.3 K, a temperature far below the critical one.

Fig. 4. Magnetic vortex imaged on the surface of NbC. The brightness in the images is proportional to the differential tunneling conductance. (a)Image of the Abrikosov vortex lattice when the sample is in a 0.6-T magnetic field perpendicular to the surface (T =1.3 K,Vs =10 mV, It =1 nA,Vmod=100 mVrms).The solid light-blue curve is the fit with the scale expression. (b) Zero-bias dI/dV map in a 0.1-T magnetic field showing a single vortex at the center. (c) Line profile of the zero-bias conductance through the center of the vortex. (d)Spatial evolution of the dI/dV spectrum along the red dotted line marked in(b). The black dashed curve is a guideline for the viewer showing the evolutions of the energy gap and coherence peak. (e)Spatial dependence of the normalized superconducting energy gap and the normalized zero-energy density of states as a function of the distance from the center of the vortex. (f) Scaling relation between the normalized zeroenergy density of states and the normalized superconducting energy gap.
On the basis of the experiments and results detailed above, we believe that our NbC crystals are homogeneous,dirty superconductors with diffusive electrons of the type considered in de Gennes’ theoretical work. The absence of the CdGM-states peak in our spectroscopic results further encourages a direct comparison with de Gennes’theory,which does not account for the CdGM states. From the spectra displayed in Fig. 4(d), we can directly obtain the values of the zeroenergy local density of statesN(r) and extract those of the local superconducting gap energy using the fitting procedure based on Dynes’ formula described earlier. The normalized results are shown in Fig. 4(e). We then re-plotted these normalized results in Fig.4(f)with the coordinates matching the expression of a linear scaling form.Obviously,the experimental results agreed well with the theoretical prediction given in Eq.(1). The agreement was in fact rather remarkable,because the applied field strength in our experiments was only 0.1 T,far lower than the upper critical field ofHc2=1.21 T for NbC.[23]In contrast,the theoretical scaling expression was derived under the condition of subcritical fields (Hc2−H)/Hc2≪1 as well as the truncation of all higher-order terms inΔ(r)/Δ0.One might argue that the surprisingly small deviation was caused by corrections in response to the low magnetic field applied in the experiments compared with those used for the theoretical results obtained nearHc2,along with the higher-order terms in the perturbative expansion. Alternatively,it may have also been due to the overlap of neighboring vortices, even at such a small field, which increased the local density of states and decreased the local energy gap. Further experiments with even lower fields(above the very smallHc1of NbC)would be useful to study the change in this deviation systematically.
Using the scaling property of the density of states to the superconducting energy gap, we derived a simple experimental scheme to estimate the coherence lengthξin a magnetic field. Usually,to estimateξ,the normalized line profile of the density of statesN(r) is fitted empirically to the exponential function (1/r)×exp(−r/ξ)[38]or to the function 1−tanh(r/ξ),[39]which includes the Ginzburg–Landau expression of the pairing order parameter.[40]However, neither procedure fits our experimental data well, not even near the center of the vortex,where the field is close to the upper critical fieldHc2. We show now that the demonstrated de Gennes’scaling expression (Eq. (1)) can be used for a more reliable estimate ofξ. Using the Ginzburg–Landau expression for the normalized order parameter (energy gap)Δ(r)~tanh(r/ξ),we obtain the formula


4. Conclusions
To summarize, we here performed a high-resolution STM/S investigation of the superconducting state on the surface of single NbC crystals. We found that,despite the strong disorder indicating a disordered normal state, NbC is a spatially homogeneous type-II s-wave superconductor at low temperatures and fits into the class of dirty (diffusive) superconductors. We went on to demonstrate that high-resolution STS allows for a direct study of the concurrent spatial evolution of the local density of states and the paring energy gap as a function of the distance to the center of the vortex core. We found that the two quantities were closely related to each other based on the scaling form proposed by de Gennes for dirty type-II superconductors with diffusive electrons,representing the first direct experimental demonstration of this theoretical prediction. Surprisingly,our experimental findings indicate that the validity of the investigated scaling form extends far beyond the regime of perturbative expansion in the critical region nearHc2treated in de Gennes’ theory, calling for a new theoretical understanding of the fundamental scaling behavior of dirty superconductors.
杂志排行
Chinese Physics B的其它文章
- Physical properties of relativistic electron beam during long-range propagation in space plasma environment∗
- High winding number of topological phase in non-unitary periodic quantum walk∗
- Widely tunable single-photon source with high spectral-purity from telecom wavelength to mid-infrared wavelength based on MgO:PPLN∗
- Control of firing activities in thermosensitive neuron by activating excitatory autapse∗
- Adaptive synchronization of chaotic systems with less measurement and actuation∗
- Dynamics analysis of a 5-dimensional hyperchaotic system with conservative flows under perturbation∗