Crystal growth,spectral properties and Judd–Ofelt analysis of Pr: CaF2-YF3∗
2021-10-28JieTian田杰XiaoCao曹笑WudiWang王无敌JianLiu刘坚JianshuDong董建树DonghuaHu胡冬华QingguoWang王庆国YanyanXue薛艳艳XiaodongXu徐晓东andJunXu徐军
Jie Tian(田杰) Xiao Cao(曹笑) Wudi Wang(王无敌) Jian Liu(刘坚)Jianshu Dong(董建树) Donghua Hu(胡冬华) Qingguo Wang(王庆国)Yanyan Xue(薛艳艳) Xiaodong Xu(徐晓东) and Jun Xu(徐军)
1School of Physics Science and Engineering,Institute for Advanced Study,Tongji University,Shanghai 200092,China
2Jiangsu Key Laboratory of Advanced Laser Materials and Devices,School of Physics and Electronic Engineering,Jiangsu Normal University,Xuzhou 221116,China
Keywords: CaF2-YF3,crystal growth,spectral property,Judd–Ofelt theory
1. Introduction
Inorganic glass has aroused permanent research interest due to its special physical properties. The emission band width of rare-earth ions doped in glass is usually much larger than that of crystals.[1–3]Along with glass, mixed fluoride crystals also have great structural disorder and broad spectral characteristics.[4–6]In highly disordered mixed fluoride crystals, the uneven spectral broadening is very large. Since the emission spectrum is greatly widened,the pump efficiency of the broadband pump source can be improved and the peak stimulated radiation cross section can be reduced.[7]Therefore, highly disordered mixed crystals can be used as a link between glass and ordinary crystals,and have attracted attention due to their unique combination of optical and thermomechanical properties.
In the trivalent rare earth ion doped CaF2crystal system,when a trivalent ion replaces a divalent Ca2+, an interstitial F−is required to be introduced into the lattice as a charge compensation. However,even in the case of low doping concentration, the CaF2single crystal of this structure is easy to form clusters, which are usually used as emission quenching centers.Therefore,a mixed crystal of CaF2-ReF3(Re=Y,La,Gd,Lu)is proposed to replace the usual CaF2single crystal.[8]Whenxis greater than 0.1, the (CaF2)1−x-(YF3)xsystem exhibits the broad emission spectrum characteristics of glass.[9]The degree of disorder of the structure is mainly controlled by the variation of the Y3+concentration.[10]
Pr3+has a large number of emission transitions in the visible light band and efficient laser emissions in the blue,green, orange, red and deep red spectral regions have been obtained in Pr3+-doped laser materials.[11–18]By incorporating the modifier ion Gd3+, a 642 nm red laser is obtained in the Pr: CaF2crystal with an output power of 22.2 mW.[19]However,crystal growth and spectral properties of Pr3+-doped CaF2-YF3crystal have not been investigated. In this paper,the Pr: CaF2-YF3single crystal has been successfully grown by the temperature gradient technique (TGT). The structure,spectral properties and Judd–Ofelt(J-O)analysis of Pr: CaF2-YF3crystal were studied.
2. Crystal growth
The high-quality 0.6 at.% Pr3+-doped CaF2-YF3crystal was grown by the TGT as shown in Fig. 1. The starting materials were Pr6O11[4N], CaF2[4N] and YF3[4N] weighed out according to the molecular formula Pr0.006Y0.285Ca0.709F2,and 1 at.% PbF2was used as an oxygen scavenger mixed in CaF2powder. The powder was mixed in an agate pot and loaded into a graphite crucible. The graphite crucible was sealed in a high-purity argon environment to prevent oxidation. The temperature rise rate was 300–400°C/h to 1430°C,and the temperature was kept constant for 3–4 h until the raw material was completely melted in the first stage. The temperature drop rate was 0.5–1.5°C/h at the equal diameter stage for 120 h, and after the growth the crystals were cooled to the room temperature at the relatively fast rate. The grown Pr: CaF2-YF3crystal was transparent with the size of Φ15×45 mm3,which is shown in Fig.1(a).The Φ15×2 mm3crystal sample was cut from the middle part of the Pr: CaF2-YF3crystal,and two surfaces were polished to Φ15×1.5 mm3for spectra measurement,which is shown in Fig.1(b).
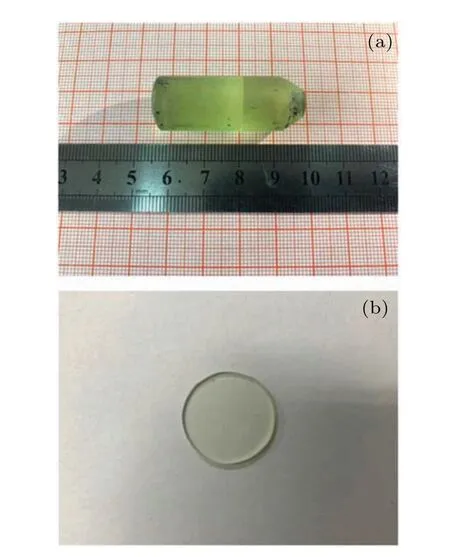
Fig.1. (a)The photo of the grown Pr: CaF2-YF3 crystal. (b)The polished sample of the Pr: CaF2-YF3 crystal.
The sample was cut from the crystal in the middle position and ground into powder for x-ray powder diffraction(XRD)and inductively coupled plasma atomic emission spectroscopy(ICP-AES)measurement. The structure of the sample was analyzed by an automated Ultima IV diffractometer(Rigaku,Japan). The XRD pattern of the Pr: CaF2-YF3crystal is shown in Fig.2(a), which is consistent with the JCPDS card(PDF#31-0923),and there is no extra impurity peak,indicating that Pr: CaF2-YF3still belongs to the cubic crystal system. The calculated Pr: CaF2-YF3crystal unit cell parameter is 5.4901 °A. At the same time, the XRD of 0.6 at.%Pr: CaF2is shown in Fig. 2(b), which is consistent with the JCPDS card(PDF#35-0816). The calculated Pr: CaF2crystal unit cell parameter is 5.4631 °A.With the doping of Y3+ions,the crystal unit cell parameters become larger. This is due to the fact that Y3+ions enter substitutional for Ca2+ions into the melt,resulting in interstitial F−ions for charge compensation,and the interstitial F−ion radius is 1.33 °A,which makes the crystal lattice expansion. The concentrations of Pr3+ions and Y3+ions in the middle of the Pr: CaF2-YF3crystal were 0.63 at.% and 25.49 at.%, respectively, which was measured by inductively coupled plasma atomic emission spectrometry(ICP-AES).
The absorption spectra from 400–2500 nm were measured by a UV-VIS-NIR spectrophotometer (Lambda900,Perkin-Elmer) at room temperature. The room temperature fluorescence spectra in the wavelength range of 450–800 nm and the fluorescence lifetime at 481 nm were recorded by Edinburgh Instruments FLS980 spectrophotometer under 443 nm excitation.
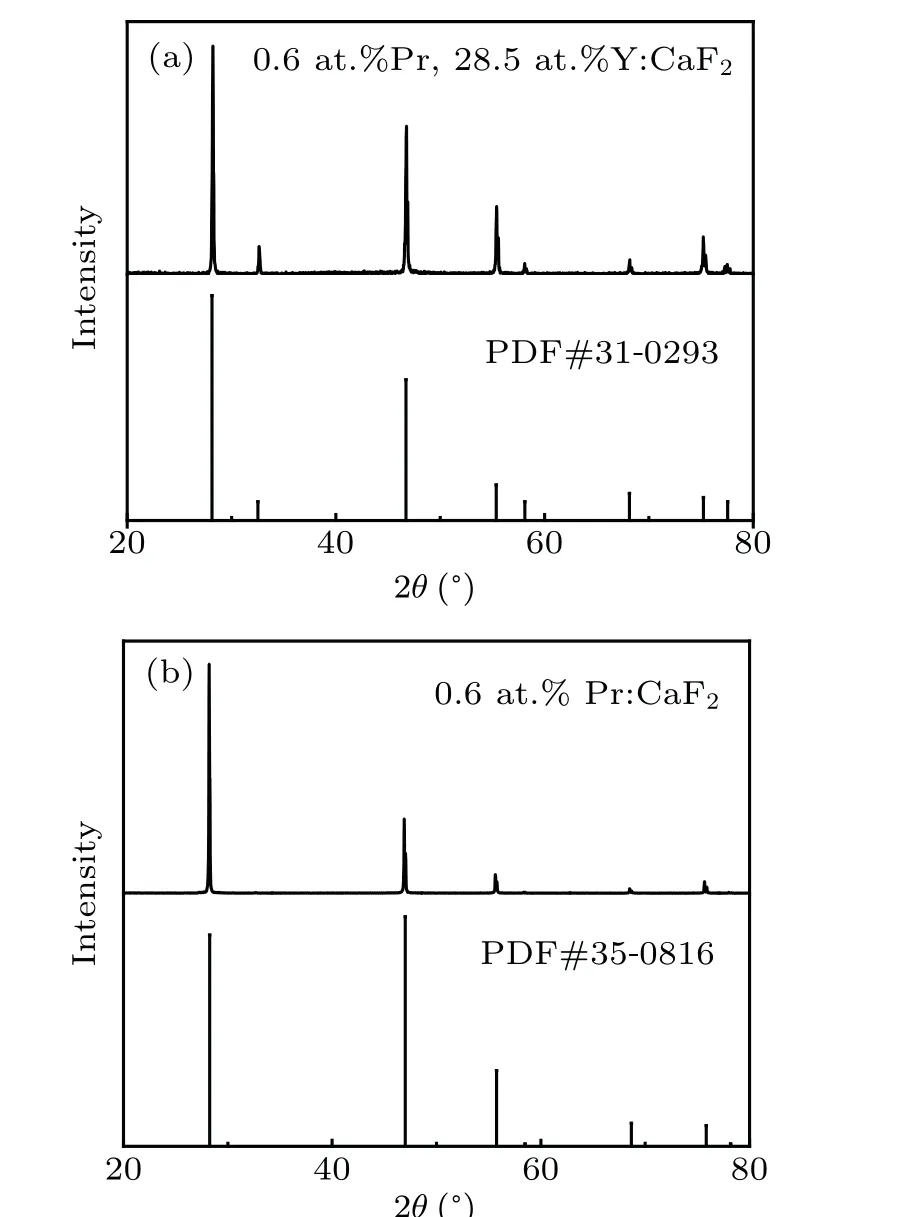
Fig. 2. (a) XRD pattern of Pr: CaF2-YF3 crystal and standard pattern of CaF2-YF3,(b)XRD pattern of Pr: CaF2 crystal and standard pattern of CaF2.
3. Results and discussion
Figure 3 shows the absorption spectra of the Pr: CaF2-YF3crystal from 400 nm to 2500 nm at room temperature.The absorption spectra are mainly composed of eight absorption bands, corresponding to the3H4→3P2,3P1+1I6,3P0,1D2,1G4,3F3+3F4,3F2, and3H6transitions, respectively.The absorption peak wavelength at 443 nm corresponds to the3H4→3P2, the absorption coefficient is 1.44 cm−1, and the FWHM is 17.8 nm. The absorption cross section at 443 nm is calculated to be 0.77×10⁻²⁰cm2, which shows that the Pr: CaF2-YF3crystal is easy to perform laser operation under GaN/InGaN LD pumping.
In 1962, Judd and Ofelt proposed the Judd–Ofelt (J-O)theory,and used it to reasonably explain the energy level transition of rare earth ions,which became a common method for analyzing the spectral properties of rare earth ions in glass and crystal materials.[20,21]Generally speaking,the absorption band is mainly caused by the electric-dipole transition,so this formula does not consider the magnetic dipole transition.[22,23]The experimental line strengthSexp(J →J′) of the electricdipole transition can be defined by the following formula:

wherehis the Planck constant,cis the speed of light in vacuum,eis the electron charge,Nis the concentration of Pr3+ion doping,nrepresents the refractive index of the CaF2-YF3crystal,λis the average wavelength of the absorption band corresponding to theJ →J′transition,Lis the thickness of the Pr:CaF2-YF3sample,and OD(λ)represents the measured optical density. According to the J-O theory, the strength of the lineScal(J,J′)can be calculated by the following formula:

whereJandJ′are the angular momentum quantum numbers of the initial and final energy levels,〈||U(t)||〉represents the squared matrix elements,Ωt(t= 2, 4, 6) is the J-O intensity parameter. According to the absorption spectra, the calculated average wavelength, experimental absorption line intensitySexp(J,J′) and theoretical line intensityScal(J,J′) are shown in Table 1.

Fig. 3. Absorption spectra of Pr3+-doped CaF2-YF3 crystal at room temperature.
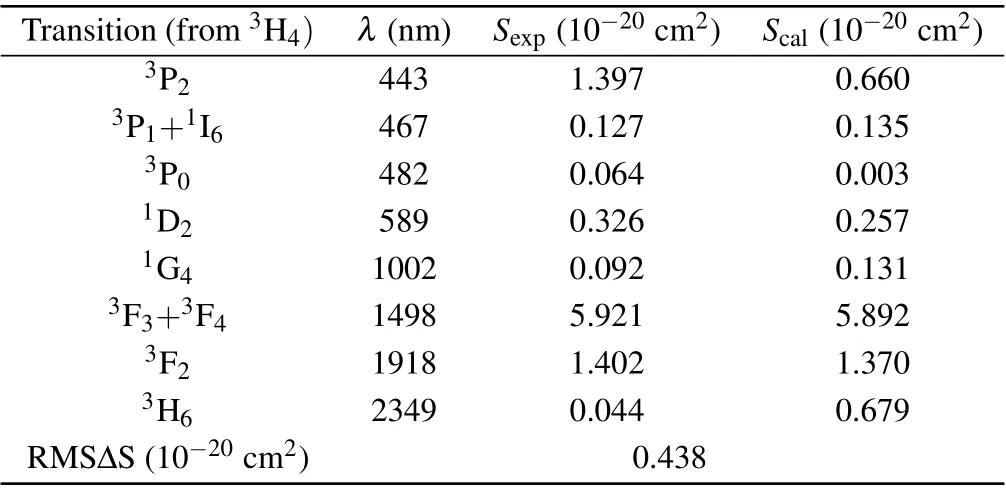
Table 1. The calculated average wavelength λ,refractive index n,absorption line strength Sexp(J,J′)and calculated line strength Scal (J,J′)of the Pr: CaF2-YF3 crystal.
The root-mean-square deviation between the experiment and calculation line strengths can be obtained by the following equation:

whereNis the number of absorption bands used in the calculation. The RMS∆S is 0.438×10⁻²⁰cm2, which shows that the measured spectral intensity is in good agreement with the calculated spectral intensity. Through the least square fitting ofSexp(J,J′) andScal(J,J′), the J-O intensity parameters can be obtained. According to this formula, theΩ2,Ω4, andΩ6of the CaF2-YF3crystal were calculated as 1.55×10⁻²⁰cm2,0.02×10−20cm2,and 4.86×10⁻²⁰cm2,respectively. The JO intensity parameters of Pr3+in CaF2-YF3and other crystals are listed in Table 2.
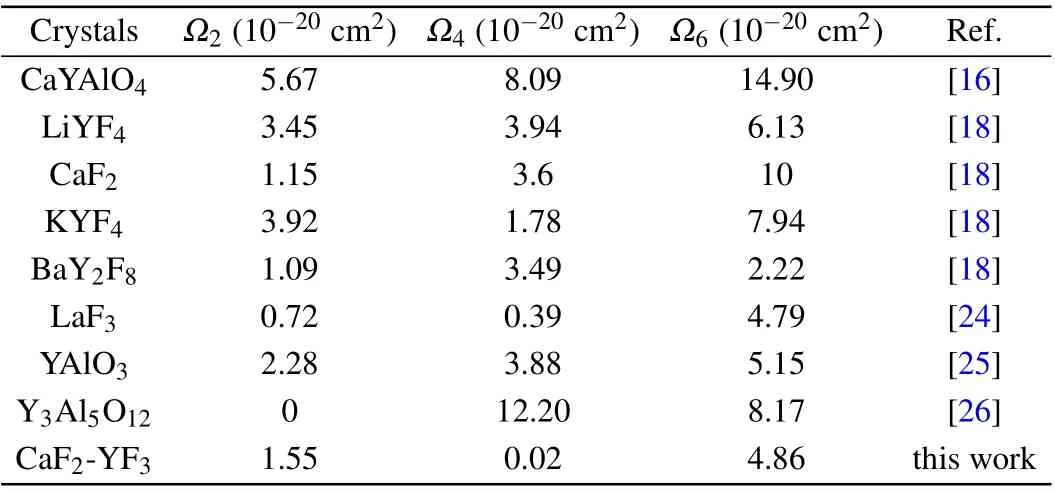
Table 2. The J-O intensity parameters of Pr3+ in CaF2-YF3 and other crystals.
The value ofΩ2represents the covalency of the doped ions and the anion in the ligand,which reflects the symmetry of the crystal field. The value ofΩ2of Pr: CaF2-YF3is higher than that of Pr3+-doped LaF2,CaF2,BaY2F8,which indicates that the covalency of Pr3+ions in CaF2-YF3is higher than that in LaF2,CaF2and BaY2F8. TheΩ4andΩ6are related to the crystal structure and usually important parameters to describe the spectral quality. The value ofΩ4/Ω6of Pr: CaF2-YF3is 0.004,which is smaller than that of Pr3+-doped LaF2,LiYF4,CaF2, and BaY2F8. The results show that the rigidity of Pr:CaF2-YF3is smaller than that of Pr3+-doped LaF2, LiYF4,CaF2,and BaY2F8.
The radiative transition ratesA(J →J′)from the excited state3P0to other lower state are calculated by the following equation:

whereAedis the probability of electric dipole radiation transition,Amdis the probability of magnetic dipole radiation transition,Aedis the electric dipole radiation transition probability,Amdis the magnetic dipole radiation transition probability,Sedis the electric dipole radiation intensity, andSmdis the magnetic dipole radiation intensity.Among them,Smdis a constant that is not related to the material,andSedis determined by the following formula:

The spontaneous transition rate, branch ratio and radiation lifetime of the3P0energy level in Pr: CaF2-YF3crystal are listed in Table 3. The radiation lifetime was calculated to be 158.4 µs, which is longer than that of Pr: CYA(9.7 µs),[15]Pr: LaF2(88.36 µs),[24]Pr: YAP (19.99 µs),[25]Pr: KLu(WO4)2(10.18 µs)[27]and Pr: SrWO4(9.5 µs)[28]crystals. The results show that the Pr: CaF2-YF3crystal has high energy storage capacity and easy for laser operation.

Table 3.Radiative transition rates A(J,J′),branching ratios β(J,J′)and radiative lifetime τrad of Pr: CaF2-YF3 crystal.
The fluorescence spectra of the Pr: CaF2-YF3crystal in the range of 450–800 nm under excitation of 443 nm is shown in Fig. 4. The simplified energy level diagram for the Pr:CaF2-YF3crystal is shown in Fig. 5. There are seven emission bands,which correspond to3P0→3H4(around 481 nm),3P0,1→3H5(around 525 nm),3P0→3H6(around 606 nm),3P0→3F2(around 642 nm),3P0→3F3(around 699 nm) and3P0→3F4(around 725 nm).
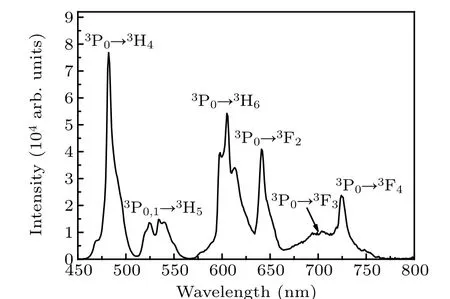
Fig.4. Room temperature fluorescence spectra of Pr: CaF2-YF3 crystal in visible region under excitation at 443 nm.

Fig.5. Simplified energy level diagram level in Pr: CaF2-YF3 crystal.
The stimulated radiation cross section is one of the important parameters for the performance of laser,which is calculated by the F-L formula[29]

whereA(J,J′) is the radiative transition rates,I(λ) is the experimental fluorescent intensity at the wavelengthλ,nis the refractive index,andcstands for the light velocity.The parameters of emission cross sectionσem, FWHM and peak wavelengthλare calculated and listed in Table 4.

Table 4. The emission cross section σem,FWHM and peak wavelength λ.
Among them, the red-light emission cross section is the largest at 641 nm, reaching 4.61×10⁻²⁰cm2and FWHM is 6.8 nm,which corresponds to the3P0→3F2transition.In addition,the emission cross section at 605 nm is 1.78×10⁻²⁰cm2and FWHM is 20.1 nm, which corresponds to the3P0→3H6transition. The emission cross section is smaller than that of Pr: LiYF4,[30]Pr: LiLuF4,[30]Pr: LiGdF4[30]and Pr:BaY2F8,[31]but the FWHMs of the two emission lines are much larger than those of Pr: LiYF4,Pr: LiLuF4,Pr: LiGdF4and Pr: BaY2F8, showing the broad-spectrum characteristics similar to glass. Obviously,the probable radiation transitions are mainly the transitions of3P0→3H6and3P0→3F2,which have probabilities of 47.46% and 51.49%, respectively. The results show that in the Pr: CaF2-YF3crystal,it is expected to achieve 605 nm orange light and 642 nm red light laser operation.
The room-temperature fluorescence decay curve of the Pr: CaF2-YF3crystal at 481 nm under 443 nm exciting is shown in Fig. 6. The measured decay curve shows a single exponential decay, and the fitted fluorescence lifetime is 45.46µs,which is longer than that of Pr: LiYF4(35.7µs),[30]Pr: LiLuF4(37.9 µs),[30]Pr: LiGdF4(43.6 µs)[30]and Pr:BaY2F8(43µs).[31]The longer fluorescence lifetime indicates that the Pr: CaF2-YF3crystal has a large number of upperlevel particles, which is easy for laser operation. The laser quality factor is characterized byσemτ,and the larger value ofσemτis better for laser operation.The wavelengthλ,emission cross-sectionσemandσemτfor the3P0→3H6and3P0→3F2transitions of the Pr3+-doped CaF2-YF3and other crystals are listed in Table 5.
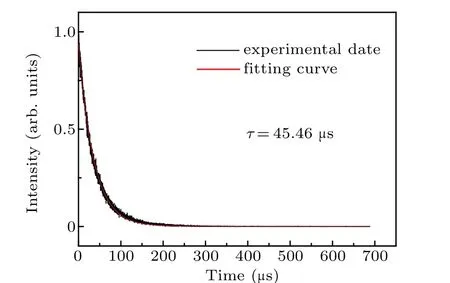
Fig. 6. Room temperature fluorescence decay curve of Pr: CaF2-YF3 crystal at 481 nm under excitation at 443 nm.

Table 5. The wavelength λ,emission cross-section σem and σemτ for the 3P0 →3H6 and 3P0 →3F2 transitions of Pr3+-doped CaF2-YF3 and other crystals that have achieved laser operation.
Theσemτof3P0→3H6and3P0→3F2transitions are found to be 80.92×10⁻²⁰cm2·µs and 388.7×10⁻²⁰cm2·µs,respectively, which are smaller than those of Pr: LiYF4, Pr:LiLuF4, Pr: LiGdF4and Pr: BaY2F8crystals. However, the FWHM of Pr3+-doped CaF2-YF3is much larger than that of Pr3+-doped other crystals. Ultrafast laser requires not only a large value ofσemτ, but also a large stimulated emission bandwidth. Theσemτmultiplied by FWHM of the Pr3+-doped CaF2-YF3is higher than that of Pr3+-doped other crystals. The above results demonstrate that the3P0→3H6and3P0→3F2transitions of the Pr: CaF2-YF3crystal are promising for orange and red ultrafast laser operation.
4. Conclusion
The 0.6 at.%Pr3+-doped CaF2-YF3crystal was successfully grown by the TGT. The absorption spectrum, emission spectrum, J-O analysis and fluorescence decay curve at room temperature were discussed. The absorption cross-sections at 443 nm were calculated to be 0.77×10⁻²⁰cm2and the values ofΩ2,Ω4, andΩ6were calculated to be 1.55×10⁻²⁰cm2,0.02×10−20cm2and 4.86×10⁻²⁰cm2,respectively.In addition,the emission cross sections were calculated to be 1.78×10⁻²⁰cm2at 605 nm and 4.61×10⁻²⁰cm2at 642 nm with FWHMs of 20.1 nm and 6.8 nm, respectively, which correspond to the3P0→3H6and3P0→3F2transitions.The fluorescence lifetime of the Pr: CaF2-YF3crystal was 45.46 µs and theσemτof3P0→3H6and3P0→3F2transitions were calculated to be 80.92×10⁻²⁰cm2·µs and 388.7×10⁻²⁰cm2·µs,respectively, which show that the Pr: CaF2-YF3crystal is promising for orange and red ultrafast laser operation.
猜你喜欢
杂志排行
Chinese Physics B的其它文章
- Physical properties of relativistic electron beam during long-range propagation in space plasma environment∗
- High winding number of topological phase in non-unitary periodic quantum walk∗
- Widely tunable single-photon source with high spectral-purity from telecom wavelength to mid-infrared wavelength based on MgO:PPLN∗
- Control of firing activities in thermosensitive neuron by activating excitatory autapse∗
- Adaptive synchronization of chaotic systems with less measurement and actuation∗
- Dynamics analysis of a 5-dimensional hyperchaotic system with conservative flows under perturbation∗
