Implications for rock instability precursors and principal stress direction from rock acoustic experiments
2021-10-26LongjunDongYongchaoChenDaoyuanSunYihanZhang
Longjun Dong,Yongchao Chen,Daoyuan Sun,Yihan Zhang
School of Resources and Safety Engineering,Central South University,Changsha 410083,China
Keywords:Precursor characteristics Wave velocity Acoustic emission Anisotropic Principal stress direction
ABSTRACT The characteristics of rock instability precursors and the principal stress direction are very crucial for the prevention of geological disasters.This study investigated the qualitative relationship between rock instability precursors and principal stress direction through wave velocity in rock acoustic emission(AE) experiments.Results show that the wave velocity variation exhibits obvious anisotropic characteristics in 0%–20%and 60%–90%of peak strength due to the differences of stress-induced microcrack types.The amplitude of wave velocity variation is related to the azimuth and position of wave propagation path,which indicates that the principal stress direction can be identified by the anisotropic characteristics of wave velocity variations.Furthermore,the experiments also demonstrate that the AE event rate and wave velocity show quiet and stable variations in the elastic stage of rock samples,while they present a trend of active and unstable variations in the plastic stage.It implies that both the AE event rate and wave velocity are effective monitoring parameters for rock instability.The anisotropic characteristics of the wave velocity variation and AE event rate are beneficial complements for identifying the rock instability precursors and determining the principal stress direction,which provides a new analysis method for stability monitoring in practical rock engineering.
1.Introduction
The geological environment of underground engineering is very complicated due to the different geo-stress conditions in distinct regions [1–3].The geo-stress will redistribute and concentrate after the excavation of underground engineering,resulting in serious rockburst [4–6],collapse [7,8],and other geological disasters[9].Rockmass is assumed to be isotropic elastomers in traditional rock mechanics.However,different types of rockmass show varying degrees of anisotropy due to the complexity of rock genesis and the existence of joints and fissures [10,11].In recent years,many scholars have conducted meaningful works on the anisotropy of rocks.The studies for anisotropic rocks in failure strength criterion[12,13],permeability characteristics[14,15],and mechanical properties [16,17] are widely reported.These studies show that the anisotropy is significant to the physical and mechanical properties of rocks.It is necessary to consider the anisotropy when studying the properties of rockmass.
When the rockmass is subjected to external tension,compression,shear,and other stresses,the strain energy stored in the rock is rapidly released in the form of elastic waves,which is called acoustic emission (AE) [18].Acoustic emission is highly sensitive to the dislocation friction of crystal and the formation and propagation of microcracks in rock,which can describe the microcracks formation process accurately and effectively[19].The AE monitoring technology is widely used in source localization [20–22],source type discrimination [23–25],source mechanism inversion[26,27],and disaster early warning[28].Acoustic emission parameters mainly include AE signal arrival time,AE hits,ringing count,amplitude,rise time,duration time,energy,dominant frequency,central frequency,AE event,etc.,which shows the key information of elastic wave from multiple aspects.The variation trends of AE parameters are the main research object of acoustic precursor characteristics of rock instability [29].Su et al.[30] indicated that the time-dependent fractal dimensions of AE hits,the main frequency of AE signals,and the frequency spectrum distributions can be used as the beneficial information for rockburst prediction.Chen et al.[31]revealed the damage evolution mechanism of brittle rock from the perspective of AE energy.Zhu et al.[32]revealed the evolution of cracks inside the rocks under cyclic triaxial loading through AE counts,cumulative AE counts,andbvalue.Zhao et al.[33] discussed the relationship between the loading stress corresponding to the minimum average frequency centroid of the AE signals and the peak stress during deformation and failure of the red sandstone specimens and further revealed critical failure precursor characteristics.
The elastic wave is a comprehensive index reflecting the physical and mechanical state of the medium,and the wave velocity is one of the most intuitive and effective parameters.Many scholars have carried out extensive works on the seismic shear wave[34,35],seismic body wave[36,37],and wave velocity tomography[38,39]considering the anisotropic characteristics of elastic waves in rockmass.These studies can be divided into two categories.One is the research on the obvious anisotropy of rockmass.For example,Johnston and Christensen [40] indicated the elastic wave velocity of sedimentary rocks in different directions could reflect the anisotropy of the rock.Kim et al.[41]studied the elastic modulus,compressional wave velocity,and thermal conductivity of three anisotropic rocks.The results showed that the compressional wave velocity of the three types of rocks had obvious anisotropic characteristics.Stanchits et al.[42] pointed out that the wave velocity anisotropy of basalt under triaxial loading is significantly greater than that of granite.The other is the research of rocks with weak anisotropy.Sayers[43]and Wu et al.[44]found the redistribution in the stress-induced crack direction of sandstone has a significant influence on the velocity of both primary and shear waves propagating in the direction parallel to the axial stress.Dillen et al.[45]considered that the compression wave and shear wave caused by the effective stress change of sandstone under triaxial stress have obvious anisotropic velocity changes.Shokouhi et al.[46]demonstrated the stress dependence of surface wave velocity under uniaxial loading of concrete is related to direction.These instructive works indicate that the wave velocity is closely related to the internal structure of the medium.It is reasonable and feasible to explore disaster incubation mechanisms and precursors of rock instability from the perspective of wave velocity.
Existing works on AE parameters mostly focused on a single sensor,such as AE hits,amplitude,energy,frequency,while the researches considering data of multiple AE sensors are rarely reported.Compared with single AE sensor monitoring data,multiple AE sensor monitoring data has two main advantages:one is to avoid the local contingency of rock sample,and the multi-AE sensors monitoring data can better reflect the real AE condition inside the rock;the other is that some noise signals can be eliminated through algorithms,which could further improve the reliability of monitoring data.Therefore,the acoustic precursor characteristics and the relationship between wave velocity and stress status of rocks with weak anisotropy still need to be analyzed and studied by integrating the data of multiple AE sensors.As we all know,the instability precursors of the rock samples are mainly concentrated in the plastic stage.In this study,we combined the monitoring data of 18 AE sensors to explore the variation characteristics of wave velocity in the elastic and plastic stage under the uniaxial compression test (UCT) of granite samples.Moreover,the precursory characteristics of rock instability and the principal stress direction are further discussed from the perspective of wave velocity.
2.Methodology
2.1.Sample preparation and loading conditions
Three cuboid granite specimens with the dimension of 100 mm× 100 mm× 200 mm,labeled as sample 1,sample 2,and sample 3,were used in the experiments.The surfaces of the rock samples are flat and smooth.The flatness tolerance and perpendicularity tolerance of the rock samples relative to the major axis are±0.01 mm and 0.001 rad,respectively.There are no macroscopic joints and cracks in the samples,which are in accordance with the test regulations.
The experiments were performed using the true triaxial electrohydraulic servo mutation experimental system (TRW-3000) at Central South University.The test system can realize independent or combined loading in vertical and horizontal directions.Hence,it can be used to carry out uniaxial compression test,biaxial compression test,and true triaxial compression test under static dynamic and dynamic loads.In this experiment,only vertical loading system was used for UCT.The loading rate of the experiments was set to 500 N/s until macroscopic failure occurred and a clear cracking sound was heard.The prestress of 1 kN was applied to the rock samples to ensure it was in full contact with the loader indenter,which could further eliminate the noise generated during the contact process of the indenter and the samples.During the experiments,the load,stress,displacement,and strain values were recorded,and load-displacement and stress-strain curves were drawn at the same time.To reduce the influence of stress concentration on the experimental results,a small steel plate slightly larger than the loading surface of the sample was added between the sample and the loading machine to obtain uniform stress (Fig.1).
2.2.Sensor arrangement and wave velocity measurement
The Vallen AMSY-6 multi-channel AE system from Germany is used in the experiments to collect the characteristic parameters and waveform data in real time.The sample rate of the acquisition system was set to 10 MHz.18 AE sensors,whose response frequency is 20–450 kHz,were fixed on the surface of the sample with a special fixture.Combined with the acquisition system,the sensors can transmit and receive pulse signals in the whole process of the experiment.The contact areas between the sensors and the samples were daubed with coupling agent to achieve a good coupling effect.Pulse signals were circularly transmitted during the experiment.The pulse width and pulse amplitude of the Auto-Sensor-Test (AST) were 5.2 s and 200 voltage-peak-peak (VPP),respectively.Each sensor could emit 4 pulse signals in one cycle with an interval of 10 ms.Since the loading time of the experiments is about 30 min and the pulse cycle time is about 11 s,Only the first pulse signal among the 4 pulse signals of a single channel is selected as the research object when analyzing the experimental data.To explore the influence of stress on the directionality of the wave velocity,the sensor network was divided into rhombic and rectangular grids on the side surfaces of the samples.The sensor transmitting the pulse signal can be regarded as the active source because the pulse signal is identifiable.The remaining 17 sensors can receive the pulse signal to realize the real-time measurement of the wave velocities.
2.3.Calculation of AE event rate and wave velocity
In the experiments,an AE event is defined as follows:assuming that the arrival time of thei-th sensor isti(i=0,1,2,3,4,...);the first received arrival time is the origin time of the seismic source.The time difference Δti,the time difference threshold Δtcr,and the threshold of sensors numberNcrcan be calculated through Eqs.(1),(2),and (3),respectively.Only when the number of[Δti≤Δtcr(i=0,1,2,3,4,...)] is greater than or equal toNcr,it is defined as an AE event.The number of AE events per second is the AE event rate.where α,s,v,andNare the correction factor between 1.5 and 2,the maximum distance between sensors,the average wave velocity in the monitoring area,and the number of sensors which not less than 8,respectively.
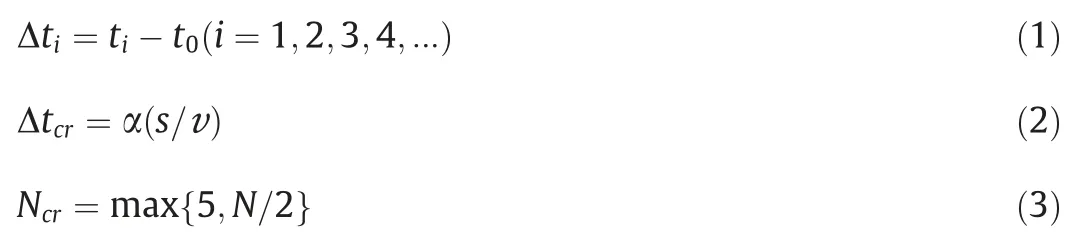

Fig.1.Experimental test system and sensor distribution.
Assuming that the propagation path of the wave is a straight line,the calculation formula of the wave velocity is shown in Eq.(4) [42].

where(xi,yi,zi),(xj,yj,zj),ti,andtjare the coordinates of sensori,the coordinates of sensorj,the time sensorithat sends out the pulse signal,and the time sensorjthat receives the pulse signal,respectively.
Seni-jrepresents the wave velocity variation in the path of sensorito sensorj.The following formula (Eq.(5)) gives the wave velocity variations values.

3.Results
3.1.AE event rate characteristics and wave velocity variations
Fig.2 reveals the variation regulation of AE event rate,stress,wave velocity variations in different paths with time during UCT of sample 1.Fig.2a and b show the wave velocity variations in the parallel and vertical directions of stress,respectively.The scattered points in Fig.2 are calculated values of wave velocity variations at different times and paths.The curves are the leastsquares polynomial fitting of the wave velocity variations values at different paths.It is noted in Fig.2b that the AE event rate of granite during UCT presents a typical‘U’shaped change.According to the AE event rate,the entire loading process can be divided into four stages:
Stage I (0–400 s):Approximately 0%–20% of the peak load.The AE event rate gradually decreases,and the rock sample tends to be compact.The rock sample is in the micro-fracture compaction stage.The wave velocity variations in the parallel direction of stress display large increment,with an average increment of about 700 m/s and a large growth rate,while the wave velocity variations in the vertical direction of stress are small,with a maximum increment of only about 250 m/s.It can be seen that the wave velocity variations in the parallel direction of stress during the early loading period are much larger than that in the vertical direction of stress.
Stage II(400–1200 s):Approximately 20%–60%of the peak load.The AE event rate is low and stable,and the rock is in the stage of elastic deformation.The wave velocity variations in the parallel direction of stress are still significant,but the wave velocity variation rates gradually decrease and tend to be stable.The wave velocities in the vertical direction of stress are still almost unchanged,with only a small increase.It can be seen that the wave velocity variations in the parallel direction of stress during the elastic deformation stage are still larger than that in the vertical direction of stress.

Fig.2.Variations of wave velocities and AE event rate of granite sample 1 under UCT.
Stage III (1200–1800 s):Approximately 60%–90% of the peak load.The AE event rate increases slightly,and the growth rate gradually increases with the increase of stress.Microcracks just initiate in the rock sample in this stage,and the rock sample is in the stage of microcracks development and stable expansion.In this stage,with the initial development of microcracks in the rock sample,wave velocities of some paths in the vertical direction of stress begin to decrease.The relationship curve of wave velocity variations with time presents a significantly downward concave shape and the decreasing rates gradually increase.At the same time,the wave velocities in the parallel direction of stress enter a quiet period and small increments are shown in this stage.The wave velocities in the vertical direction of stress are more sensitive than those in the parallel direction.Moreover,the rock is the densest,and the waves inside the rock sample are propagated at high speed in this stage.
Stage IV (1800–2052 s):Approximately 90%–100% of the peak load.The AE event rate increases sharply.There are a large number of microcracks and coalescence in the rock sample,which would gradually form macroscopic fracture surface and accompany clear fracture sound.At this time,the rock is in the stage of unstable expansion of microcracks.If we continue to increase the load,brittle failure will occur,and the rock sample would break into pieces of different sizes and shapes.In this stage,the wave velocity variations in the vertical direction of stress decrease significantly.All the wave velocities in the vertical direction of stress show a decrease and the decreasing rate increases sharply.In contrast,the wave velocity variations in the parallel direction of stress are small.During the unstable expansion stage of the microcracks,the wave velocity variations in the vertical direction of stress are much larger than that in the parallel direction of stress,which is in sharp contrast with the micro-fracture compaction stage.
Figs.3 and 4 show the parameter variations of sample 2 and sample 3 with time,respectively.It is clear that the AE event rate of sample 2 also presents a ‘U’ shaped change,but the duration time of stage I is shorter than that of sample 1.It may be related to the historical stress difference between the two rock samples.The AE event rate of sample 3 changes in a ‘W’ shape.This is because a small piece collapsed on the surface of sample 3 in the middle of loading.That was similar to the phenomenon of ‘slices’in the roadway,but the sample still had a strong bearing capacity.Without considering the accidental event caused by the difference of the sample,the AE event rate during the whole loading process is still a typical‘U’shape.The wave velocity variations of sample 2 and sample 3 are similar to that of sample 1.The main characteristic is that the moment when the AE event rate increases sharply that corresponds to the decrease of wave velocities in the vertical direction of stress,while the wave velocities in the parallel direction of stress decrease sharply until the rock appears macroscopic cracks and is about to lose its bearing capacity.
Combining the experimental results of the three samples,the AE event rate changes in the shape of‘U’shape during UCT of typical granite.The wave velocities show obvious variation characteristics,which is mainly manifested in the different response degrees of the wave velocities in the vertical direction of stress and that in the parallel direction of stress at different stress statuses.Combined with the fracture characteristics of the rock samples,it is concluded that the wave velocities in the parallel direction of stress are more sensitive to the closure of micro-fracture,while the wave velocities in the vertical direction of stress are more sensitive to the opening and expansion of microcracks.In addition,as shown in Figs.2b,3b and 4b,the trend of wave velocity variations in the vertical direction of stress in the middle and late loading period shows a symmetric relationship with the trend of AE event rate.It can be deduced that the wave velocity variations in the vertical direction of stress are closely related to the stress status of the rock samples.
3.2.Anisotropy of wave velocity variations
α represents the angle between the direction of wave velocity path and the direction of stress,i.e.,0° ≤α ≤90°.Considering the accidental event in the loading process of sample 3,we choose sample 1 and sample 2 as the research objects.Fig.5a and 5c unfold a clear comparison between the wave velocity variations and stress for α=0°,33°,54°,and 90° from sample 1 and sample 2.During the entire loading process,the wave velocities first increase and then decrease with an increase in the stress,and the increments of the wave velocities decrease with the increase of the angle α.In stage III,the wave velocities of each angle show different decrement and the decrements of the wave velocities increase with the increase of the angle α.Besides,in the experiment of sample 1,when α=0°,33°,54°,and 90°,the number of significantly decreasing paths of wave velocity is 16.7%,50%,75%,and 84.6%,respectively.This indicates the larger the angle,the greater the proportion of wave velocity descent paths.The maximum increment and maximum decrement of the fitted wave velocity curves under different angles are plotted in Fig.5b and 5d.It can be seen that the maximum increment of the wave velocity decreases with the increase of the angle,while the maximum decrement of the wave velocity increases with the increase of the angle.The maximum increment and decrement of wave velocity are obtained when α is 0° and 90°,respectively.That is,the wave velocity variations in the parallel direction of stress and vertical direction of stress are the most significant.The wave velocities in these two directions are more suitable for experimental research and field applications.

Fig.3.Variations of wave velocities and AE event rate of granite sample 2 under UCT.

Fig.4.Variations of wave velocities and AE event rate of granite sample 3 under UCT.

Fig.5.Relationships between wave velocity variations,stress,and angles in sample 1 and sample 2.
In the experiments,AE sensors are arranged in three layers(Fig.1).Fig.6a and c reveal the relationship between average wave velocity variations and stress at different heights of active sources(z=20,100,and 175 mm).It can be seen from Fig.6a and c that the average wave velocity variations first increase and then decrease with the increase of the stress.The average wave velocity variations of active sources at both ends of the sample (z=20 mm,z=175 mm) are similar.The average wave velocities increment of the active sources at both ends of the sample is greater than that in the middle of the sample(z=100 mm),while the average wave velocities decrement of the active sources at both ends of the sample is smaller than that in the middle of the sample.The maximum increment and maximum decrement of the fitting wave velocity curves are obtained by fitting the average wave velocity variations of each active source heights.The maximum increment and maximum decrement of the fitted average wave velocity curves under different active source heights are plotted in Fig.6b and d.It can be seen from Fig.6b and d that the largest maximum increment of the wave velocity is obtained when the active sources are near to the two ends of the sample,while the largest maximum decrement of the wave velocity is obtained when the active sources are in the middle of the sample.In Section 3.1,the wave velocities in the vertical direction of stress decrease as rock micro cracks appear,thus the wave velocity monitoring sensors should be arranged in the middle of the monitoring target in laboratory tests and field applications.

Fig.6.Relationships between wave velocity variations,stress,and source location.
As noted in Fig.5,the dotted box of Fig.5b is the wave velocity paths diagram of different angles.
Besides,by comparing Fig.5a with Fig.6a,the wave velocities increment and decrement at different angles would offset each other when the wave velocities of multiple angles are combined and averaged.The change characteristics of the wave velocities would be ‘neutralized’,which shows the characteristics of relatively weak variation.Therefore,it is necessary to consider the directionality of the wave velocity during experimental explorations.
As noted in Fig.6,the dotted box of Fig.6b is the source locations diagram at different heights.
4.Discussion
4.1.Explanation of the wave velocity variations anisotropy
As is known,waves travel along the path that takes the least time (Fermat’s principle) and waves travel much faster in solid than in air.Therefore,when there are microcracks in the rock samples,the wave propagation paths tend to bypass the microcracks instead of traveling through the microcracks.In the early stage of loading,the microcracks in the parallel direction of stress would close in large quantities under the action of external stress,and the number is much larger than that in the vertical direction of stress.When a wave is propagating in the parallel direction of stress,the propagate path of the wave changes from bypassing the microcracks before loading to a nearly straight line with the compaction of the microcracks.The wave propagation paths change greatly,which is manifested in the significant wave velocity variations in this direction at the macro level.By contrast,the wave propagation paths in the vertical direction of stress are almost unchanged,illustrating the wave velocities in this direction show small variations during the early loading stage.Similarly,other angular wave velocity variations are between that in the parallel direction of stress and the vertical direction of stress.Therefore,the wave velocities in the parallel direction of stress are more sensitive to the micro-fracture compact than those in the vertical direction of stress.
Fig.7a shows the macroscopic fracture morphology after the rock sample 1 loading failure,which is a typical conjugate‘X’type shear fracture.In recent years,some scholars have indicated that the average frequency AF(kHz)and RA(ms/V)values of AE signals can be used to qualitatively distinguish the type of cracks [47,48].RA is the ratio of rise time and amplitude of AE signal.Although there is no accurate conclusion on the boundary of this method,Zhang and Deng [49] proposed that the boundary of brittle rocks under UCT is about 1:100–1:500.In this study,choosing RA:AF=1:200 as the dividing line of rock tensile crack and shear crack is to qualitatively analyze the microscopic crack types in the microcracks development and stable expansion stage.The result is shown in Fig.7c,most cracks in stage III are caused by shear crack obviously,accounting for 95.26%,which is consistent with the macroscopic X type shear fracture.

Fig.7.Explanation of the wave velocity variations anisotropy.
Fig.7b is a simplified model that considers a single crack at explaining the wave velocity variations anisotropy.In the experiments,stress concentration on the surface of the sample under the influence of the end effect then results in the expansion and connection of microcracks inside the rock.It gradually produces cracks parallel to the stress direction.With the increase of compressive stress,these cracks expand inward and form potential shear failure surfaces [50].As shown in Fig.7b,affected by the microcracks,the wave propagation path of sensor A and sensor D in the parallel direction of stress changes from the orange virtual line to the orange real curve and the propagation path increases slightly,while the wave propagation path of sensor B and sensor C in the vertical direction of stress changes from the blue virtual line to the blue real curve and the propagation path increases greatly.The wave propagation path in other angular directions,such as sensor E and sensor C,changes from the green virtual line to the green real curve and the propagation path increases moderately.The combination of the simplified model is the real propagation of waves.Therefore,the variation of wave velocity at the macro level is actually the change of wave propagation path at the micro level.By comparison,it concluded that the wave velocities in the vertical direction of stress are more sensitive to the opening and expansion of microcracks than that in the parallel direction of stress,and the sensitivity of other angles is between the two.
In the UCT of rocks,two compression areas would be formed at both ends of the sample due to the end effect.The rock in the compression areas is under triaxial compression and the rock structure is more compact than the middle part.Since the tensile and shear strength of the rock are much smaller than the compressive strength,the wave propagation paths through the triaxial compression areas at both ends of the rock are more stable than that through the middle of the rock.In this experiment,the source’s pulse propagation path atz=20 mm andz=175 mm through compression areas accounts for about 76.5%,greater than 64.7%atz=100 mm.Therefore,the average wave velocities increment of the source at both ends of the rock are more significant than that of the source in the middle of the rock,while the average wave velocities decrement is just the opposite.
4.2.Identification of stress status
Rockmass in practical engineering,such as the ore pillar and bridge pier,are often affected by pre-compressive stress,so there is almost no microfracture compaction stage in the engineering rocks.The previous studies reveal that the AE/microseismic event rate and the wave velocity in the vertical direction of stress show obvious variation characteristics in stage III and stage IV.The stage III of rock stress status is the plastic stage of rocks,which is a crucial precursor stage of rock instability.There is a large contingency in rock samples,and the difference in stress history would lead to the difference in some experimental results.As is shown in Figs.5 and 6,the wave velocity increment of sample 2 is much smaller than that of sample 1 due to the shorter microfracture compaction stage.However,in the plastic stage,the wave velocities of the two samples both show a decreasing trend and the decrement does not show a great difference.It shows that the difference in stress history mainly has a great influence on the increase of wave velocity.Therefore,the variation of the AE/microseismic event rate and wave velocity in the vertical direction of stress provide a theoretical basis and a new monitoring approach for early warning of rock instability.
Specifically,if the AE/microseismic event rate and the wave velocities in the vertical direction of stress do not change,it is considered that the rock in the monitoring area is in elastic deformation stage and the rock is stable.If the AE/microseismic event rate in the monitoring area increases slightly and the growth rate increases gradually,or the wave velocities of some paths in the stress vertical direction decrease and the decrease rate increases slowly,it can be considered that the rock is in the stage of stable expansion of microcracks and the rock still has strong bearing capacity at this time.To ensure the safe operation of the practical engineering,early warning and some support measures should be taken.If the AE/microseismic event rate in the monitoring area increases greatly and the growth rate is great,or the wave velocities in the vertical direction of stress decrease greatly.It can be considered that the rock in the monitoring area is in the stage of unstable expansion of microcracks.At this time,the rock is about to lose its bearing capacity.Early warning should be issued so that people can evacuate from the dangerous area immediately.The logical relationship of the warning system is shown in Fig.8.

Fig.8.Logic relationship of rock instability early warning system from AE/microseismic event rate and wave velocity in the vertical direction of stress.
4.3.Identify the principal stress direction
The analysis of underground rockmass stress state is significant for the safety and efficiency of geotechnical engineering.If the maximum principal stress direction of the rock mass can be identified,effective protective measures and a corresponding emergency plan can be taken and formulated.In the engineering field,the principal stress direction in some cases is easily derived.For example,after the excavation of an underground roadway,the minimum stress in the vicinity of the roadway openings will be adjusted to be perpendicular to the roadway.The maximum stress will be the vertical stress.However,as for the far field rockmass being affected by multiple disturbances,the maximum principal stress direction of the rock mass is unknown and difficult to identify.From Figs.5 and 6,as the angle between the wave propagation path and the direction of the maximum principal stress changes from 0° to 90°,the increment and decrement of wave velocity gradually decrease and increase,respectively.This could provide a way to identify the maximum principal stress direction of rock.The specific implementation scheme is as follows:firstly,velocity sensors are arranged in the target area to measure the real-time wave velocities of different paths before engineering disturbance,which requires the placement of sensors that are not coplanar.Secondly,the wave velocity variations before and after the engineering disturbance of each path are calculated.Thirdly,the maximum principal stress is obtained preliminarily according to the calculated maximum wave velocity increment and maximum wave velocity decrement.Finally,as the angle between wave propagation path and the direction of the maximum principal stress changes from 0° to 90°,the decrement of wave velocity gradually increases and the number proportion of velocity decrease paths gradually increases,the maximum principal stress direction is adjusted and verified according to this regular.
5.Conclusions
In this work,18 AE sensors are used for UCT on granite samples with weak anisotropy.The precursors of rock instability are explored from the perspective of AE big data and multi-direction wave velocities.A method of identifying the principal stress direction of rockmass in complex environments is further discussed.The following conclusions are obtained:
(1) The wave velocity of granite is highly correlated with the stress status.The wave velocity variations show obvious anisotropy characteristics.
(2) The AE event rate changes in‘U’shape in the whole test and the wave velocity variations present a symmetric relation with the AE event rate,indicating that both of them can be used to identify the plastic stage of rocks and provide early warning for rock instability.
(3) The wave velocity variations are related to its azimuth and position.The wave velocity monitoring sensors should be arranged in the middle of the monitoring target and focusing on observing the wave velocity in the vertical direction of the maximum principal stress.
(4) The microcracks type of granite under UCT is mainly shear crack,accounting for up to 95%.The difference in microcrack types and morphology are the main reasons for the anisotropy of macroscopic wave velocity variations.
(5) The decrease of wave velocities in the vertical direction of the maximum principal stress is a precursor characteristic of rock instability.The direction of the maximum principal stress direction could be identified by the anisotropy of wave velocity variations.
It should be noted that the conclusions of this manuscript are based on the UCT of granite,which can explain some conditions of rock instability and precursor in engineering.The precursory of rock instability under triaxial forces needs to be further studied and confirmed,which is also our next study purpose.
Acknowledgements
The authors are grateful for the financial support from the Fundamental Research Funds for the Central Universities (No.2282020cxqd055),the National Science Foundation for Excellent Young Scholars of China(No.51822407),the Natural Science Foundation of China (Nos.51774327 and 51504288),and the Fundamental Research Funds for the Central Universities of Central South University (No.2021zzts0862).
杂志排行

矿业科学技术学报的其它文章
- Strategic sill pillar design for reduced hanging wall overbreak in longhole mining
- Effects of confining pressure on acoustic emission and failure characteristics of sandstone
- Understanding the influence of petrographic parameters on strength of differently sized shale specimens using XRD and SEM
- Experimental investigation of rigid confinement effects of radial strain on dynamic mechanical properties and failure modes of concrete
- Dynamic Mode Ⅱfracture behavior of rocks under hydrostatic pressure using the short core in compression (SCC) method
- Investigation of the influence of intermediate principal stress on the dynamic responses of rocks subjected to true triaxial stress state