Investigation of the influence of intermediate principal stress on the dynamic responses of rocks subjected to true triaxial stress state
2021-10-26WeiYouFengDaiYiLiuHongboDuRuochenJiang
Wei You,Feng Dai,Yi Liu,Hongbo Du,Ruochen Jiang
State Key Laboratory of Hydraulics and Mountain River Engineering,College of Water Resource and Hydropower,Sichuan University,Chengdu 610065,China
Keywords:Triaxial Hopkinson bar Intermediate principal stress Dynamic strength Failure modes Numerical simulation True triaxial stress
ABSTRACT Precisely understanding the dynamic mechanical properties and failure modes of rocks subjected to true triaxial stress state (σ1 >σ2 >σ3,where σ1,σ2,and σ3 are the major principal stress,intermediate principal stress,and minor principal stress,respectively) is essential to the safety of underground engineering.However,in the laboratory,it is difficult to maintain the constant true triaxial stress state of rocks during the dynamic testing process.Herein,a numerical servo triaxial Hopkinson bar(NSTHB)was developed to study the dynamic responses of rocks confronted with a true triaxial stress state,in which lateral stresses can maintain constant.The results indicate that the dynamic strength and elastic modulus of rocks increase with the rise of intermediate principal stress σ2,while the dynamic elastic modulus is independent of the dynamic strain rate.Simulated acoustic emission distributions indicate that the intermediate principal stress σ2 dramatically affects dynamic failure modes of triaxial confined rocks.As σ2 increases,the failure pattern switches from a single diagonal shear zone into two parallel shear zones with a small slant.Moreover,a recent triaxial Hopkinson bar experimental system using three bar pairs is also numerically established,and the measuring discrepancies are identified between the two numerical bar systems.The proposed NSTHB system provides a controllable tool for studying the dynamic triaxial behavior of rocks.
1.Introduction
The buried rock mass is commonly confronted with true triaxial stress conditions (i.e.σ1>σ2>σ3,where σ1,σ2,and σ3are the major principal stress,intermediate principal stress,and minor principal stress,respectively).In underground engineering (e.g.oil mining,hydropower station construction,hazardous waste storage,and energy reserves),true triaxial stress confined rocks are usually being exposed to natural or human-induced dynamic loadings from earthquakes,explosions,and impacts,etc [1–3].These dynamic disturbances on the true triaxial stress confined rocks always bring serious risks and challenges to the safety of underground engineering constructions.Precisely understanding the dynamic responses and failure models of rocks in threedimensional stress conditions is thus crucial for structure design and hazard prevention in underground engineering.
To research the strength and deformation characteristics of buried rocks under true triaxial stress environments,Mogi [4] proposed the first true triaxial apparatus (TTA) and carried out some seminal works.These works revealed that rock strength and failure behavior are greatly affected by the intermediate principal stress σ2.Since then,several types of TTAs have been devised to systematically deliberate the mechanical properties of rocks confronted with true triaxial confinement [5–11].These experimental results indicated that the compression strength initially grows and subsequently declines with the rise of σ2,and the rupture plane strikes the σ2direction.It should be noted that the strain rates of rock specimens in these true triaxial compressive experiments are at a low value (<10-1s-1).However,rocks under a true triaxial stress state in underground engineering construction are commonly confronted with a high strain rate loading range of 101–102s-1.Therefore,the dynamic responses of rocks under true triaxial confinement in a high strain rate range are worth further researching in detail for the construction safety in underground engineering.
For investigating the dynamic responses of rocks at a high strain rate range,the split Hopkinson pressure bar (SHPB) has been widely used in the laboratory [12–16].Dai et al.[17] and Cai et al.[18] illustrated that the dynamic strength of rocks grows observably with the rise of strain rate.As for the failure behavior,Li et al.[19]concluded that the increasing loading rate strengthens the breakage degree of specimens.The strain rate effect on the tangent modulus has yet reached a consensus.Perkins et al.[20]indicated that the tangent modulus gradually mounts with the rise of strain rate,while the phenomenon that the strain rate does not affect the tangent modulus is reported by Frew et al.[21].Suggesting by the International Society for Rock Mechanics (ISRM),this high strain rate testing method using SHPB has been a recommendation for accessing the uniaxial dynamic compression strength of rocks [22].
In the past few decades,the SHPB apparatus was also improved to deliberate the dynamic responses of confined rocks [23–27].Two main types of methods have been applied to enforce the initial confinements on specimens in the modified SHPB apparatus,through either a displacement or pressure boundary condition[28].For the displacement boundary condition,the sample was coated with a passive thick vessel or a shrinkable alloy tube to apply the radial confinement.By conducting dynamic compression tests with the strain rate up to 1860 s-1on Westerly granite specimens under confinement up to 132 MPa,Yuan et al.[29] stated that the dynamic strength of hard rock quickly grows with the rise of strain rate and confinement.However,the confining pressure on the specimen is variable during the whole dynamic testing process and the frictional stress between the specimen and the alloy tube is ambiguous.For pressure boundary conditions,confinement was provided by the pressurized hydraulic oil around the specimen.Christensen et al.[23] carried out dynamic experiments on confined nugget sandstone at the strain rate of 102–103s-1.They reported that the dynamic strength mounts linearly with rising confinements.Hokka et al.[30] performed compression experiments on Kuru granite suffering broad ranges of confinement at rather high strain rates.The conclusion was drawn that the dynamic strength of hydrostatically confined granite mounts steadily,while the strain rate sensitivity of the dynamic strength dwindles as the confining pressure grows.But it is important to realize that the triaxial pre-stresses provided by these two techniques are still axisymmetric stress states (i.e.σ1>σ2=σ3≠0),instead of a general confronted true triaxial stress state (i.e.σ2≠σ3) in the underground engineering.
To achieve an initial true triaxial stress state on the specimens before dynamic loading,many researchers have devoted a lot of effort.Cadoni and Albertini [31] proposed a three-dimensional modified Hopkinson bar (3D-MHB) which mainly consisted of a pre-stressed input bar and five output bars accompanied with a hydraulic cylinder connected on the outer end of each bar.Nevertheless,only the uniaxial compression function has been achieved in this 3D-MHB device[32].There is a lack of dynamic experimental data on triaxial confined rock failure at high strain rates.Recently,a triaxial Hopkinson bar device using three bar pairs(THB3B) has been successfully established in Monash University,which can study dynamic mechanical and failure properties of rocks subjected to true triaxial confinement[33].Using three pairs of hydraulic chambers and wedge counterforce devices set at the outer end of each bar,the triaxial pre-stresses can be applied on the cubic specimen,and the dynamic loading is produced by a cylindrical striker driven by the gas gun.A set of dynamic tests were conducted on sandstone under multiaxial confinements at the strain rate of 110 s-1.Their results suggested that both the dynamic strength and failure modes of sandstone are dramatically affected by three principal stresses in the various triaxial preconfined environment.However,the lateral pre-stresses σ2and σ3in the THB3B are rapidly increasing rather than keep constant during the dynamic loading.
In recent years,numerical simulation has become a useful method for researching the mechanical properties of rocks [34–37].In particular,the discrete element method (DEM) has been judged as a powerful tool for reconstructing the dynamic mechanical and fracture properties of brittle rocks [38–40].In this study,the numerical servo triaxial Hopkinson bar (NSTHB) system is designed to explore intermediate principal stress σ2effects on dynamic mechanical properties and fracture modes of rocks.This simulation test system overcomes the shortcomings that it is hard to provide an initial true triaxial stress state(i.e.σ1>σ2>σ3≠0)in conventional confining SHPB apparatus [26,27,30].The lateral stresses σ2and σ3are kept constant by a precise stress servo technique during the dynamic loading.Furthermore,a THB3B is simulated to demonstrate the measuring discrepancies between the two triaxial Hopkinson bar systems.
2.Experimental and numerical methods
2.1.Experimental apparatus and data processing means
As shown in Fig.1,the confining dynamic tests on rock specimen are conducted in the modified SHPB experimental apparatus with radial and axial confining chambers.The specimen is clamped between the incident and transmitted bars.Using the radial and axial confining systems,the specimen is hydrostatically confined before dynamic impact.During the dynamic compression process,the striking of the striker bar upon the front end of the incident bar generates an incident wave (εi) passing through the incident bar.Generally,a part of the incident wave is reflected as the reflected wave (εr) when the incident wave arrives at the incident interface of the specimen.Meanwhile,the rest part propagates along with the specimen and goes through the transmitted bar as the transmitted wave (εt).To capture the signals of these stress waves (εi,εr,and εt),ordinarily,two strain gauge pairs are diametrically glued on appropriate places of the incident bar and transmitted bar.All signals are collected and processed by the data acquisition system.
In the confining SHPB tests on hydrostatically pressurized rock,the precondition of data processing means,i.e.one-dimensional(1D) stress wave theory,is also applicable [41,42].The dynamic stress (σdyn),corresponding strain (εdyn),and strain rate (.ε) of the specimen are calculated by Eq.(1).
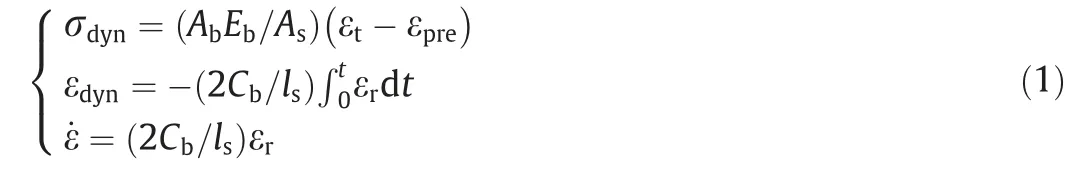
whereCb,Ab,andEbare the longitudinal wave velocity,crosssectional area,and elastic modulus of the steel bar,respectively;εprethe strain caused by the confined pre-stress;andlsandAsthe length and cross-sectional area of the tested specimen,respectively;andtthe duration time of each dynamic loading process.
2.2.Basic introduction of discrete element method and bond particle model
In the present study,the open-source DEM code ESyS-Particle[43] is applied to build up the whole numerical SHPB system as well as the rock specimens.The specimens and bars are simulated as assemblages of a number of rigid spheres.Using a bond particle model(BPM) proposed by Potyondy and Cundall [44],two adjoining spheres are bonded in the simulation.These forces and moments between bonded spheres can be expressed as


Fig.1.Photo and schematic diagram of the modified confining SHPB system.
whereFbn,Fbs,Mb,andMtare the normal bond force,shear bond force,bending moments,and twisting moments,respectively;kbn,kbs,kb,andktthe corresponding stiffness of bond;and Δdn,Δds,Δαb,and Δαtthe relative displacements of bond.The criterion of BPM breakage adopted in this simulation is expressed as Eq.(3).The subscript max of each force (i.e.Fbn,max,Fbs,max,Mb,max,andMt,max) represents the corresponding maximum value.

2.3.Numerical servo triaxial Hopkinson bar system
The numerical SHPB system,as shown in Fig.2,is composed of three bars (including a striker,an incident bar,and a transmitted bar),a pulse shaper,and a cubic specimen.The initial cubic specimen(35 mm×35 mm×35 mm)consists of approximately 78,900 spherical particles.With thermin=0.32 mm,the particles radii of the specimen follow the uniform distributionrmax/rmin=1.66,where thermaxandrminare the maximum and minimum radii of particles,respectively.The ratio of the specimen side length to the average particle diameter is 41.1,which is large enough to eliminate the particle size effects on the simulation results [45].To avoid the superposition of the stress wave in these bars,the length of the incident bar and transmitted bar are set as 2000 and 1400 mm,respectively.These three bars own a diameter of 50 mm.Meanwhile,five measuring spheres are set at pointsA–Eto monitor the wave propagating process.Four orthogonal rectangular walls form a lateral confining chamber,in addition,to apply lateral pre-stresses (i.e.σ2and σ3) on the cubic specimen in the NSTHB (Fig.3).The axial pre-stress σ1on the specimen is directly applied using the incident and transmitted bars.
2.4.Loading paths and numerical servo technique

Fig.2.Three-dimensional SHPB system established by DEM:enlarged view of part of the pulse shaper,a measurement sphere,and the cubic specimen.
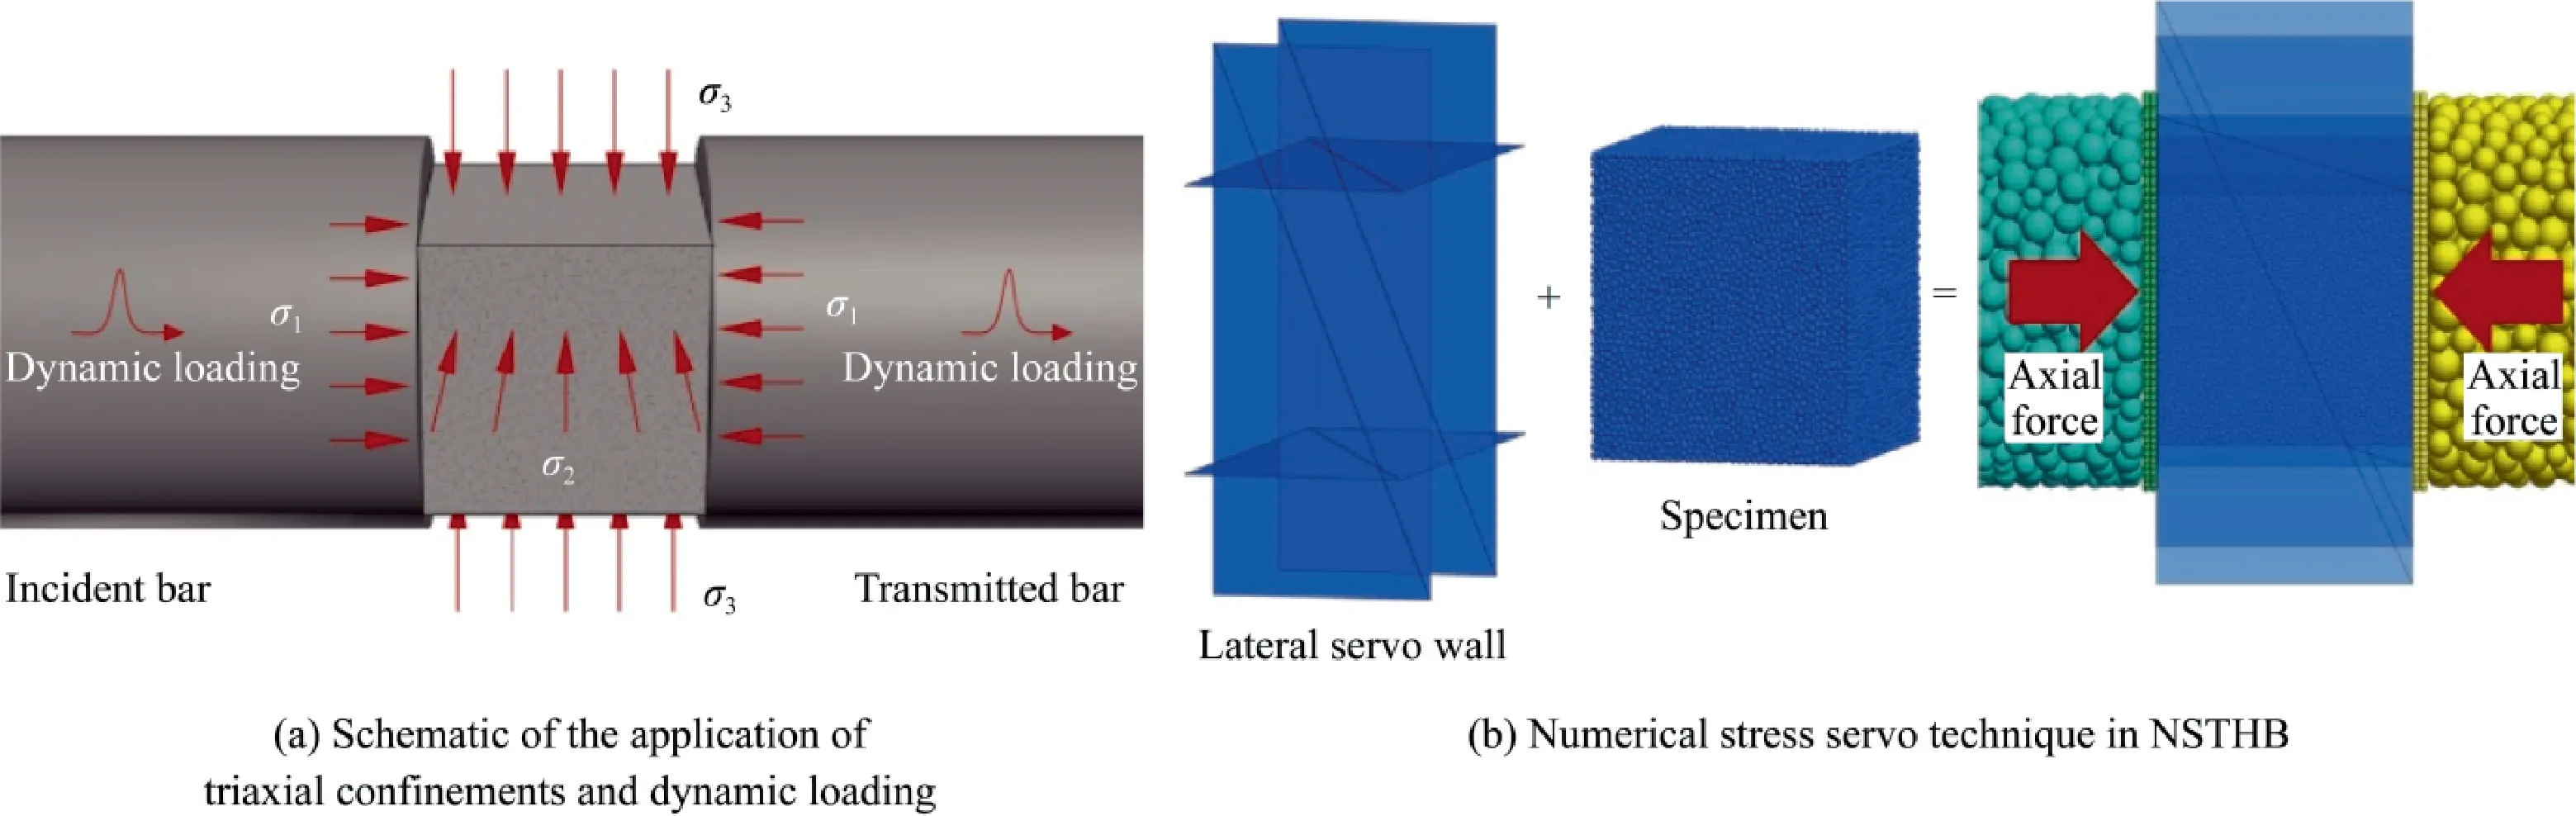
Fig.3.Schematic of the application of triaxial confinements and dynamic loading and numerical stress servo technique in NSTHB.

Fig.4.Loading paths of dynamic triaxial tests.
Fig.4 schematically shows the stress paths in this study,with the whole loading process divided into preload and dynamic load stages.In the preload stage,the specimen is first loaded monotonically in compression under hydrostatic conditions(σ1=σ2=σ3≠0) under a fixed displacement increment of 0.005 mm/s.Subsequently,three pre-stresses maintain constant when the corresponding desired value is achieved.In the dynamic testing process,a ramp incident wave is produced and passes through the incident bar after the striker bar struck the pulse shape.Since relative motions between the interfaces of barspecimen,these four rectangular walls also shrink axially.
In the dynamic load state,the two lateral pressures σ2and σ3are automatically governed by a precise servo technique to ensure constant lateral pressures.The key principle of the servo technique is to adjust the transverse shrinkage of these four lateral servo walls to apply lateral pressures on simulated rock specimens.Each rectangular wall consists of four vertexes and the vertex velocity governs the transverse shrinkage of the servo wall.An adaptive controller factor (G) is introduced to characterize the relation between vertex velocity υwand the stress difference Δσ.

where σmand σpare the measurement and predetermined lateral stress,respectively.Considering the computational stability,the maximum increment Δσwof lateral confinement in one step can be calculated as follows.

whereAwis the lateral servo wall area contacted with the specimen;andNcthe average normal stiffness and a total number of all contacts between the wall and specimen,respectively;and Δtthe duration of each calculation step.Furthermore,this stress increment should not be greater than the difference value between measurement lateral stress and predetermined lateral stress.

where α is a relaxation parameter generally set as 0.5 in common DEM simulations.Thus the controller gain factorGcan be calculated as

3.Experimental results and NSTHB model validation
3.1.Experimental results
In this study,the dynamic test on hydrostatically confined rock specimens is first performed to validate the microscopic parameters in subsequent simulation tests.Rock specimens are sandstone drilled from Neijiang city,Sichuan province,China.With the geometry of 35 mm×35 mm×35 mm,the tolerance of the surface perpendicular of these cubic specimens is less than 0.002 rad and the surface roughness is smaller than 0.05 mm after elaborate polish.With a density of 2320 kg/m3,basic mechanical properties of tested sandstone are illustrated as follows:an elastic modulus of 8.77 GPa,a uniaxial compression strength (UCS) of 70 MPa,and a Poisson’s ratio of 0.23.
For a valid SHPB test,the dynamic stress equilibrium on both ends of the specimen is a prerequisite.With careful pulse shaping technique,the specimen can achieve a dynamic stress equilibrium state in the authors’ dynamic tests.Fig.5a presents the dynamic stress on both ends of the cubic specimen in a typical test.The dynamic stress on the incident end of the specimen is the the sum of the incident and transmitted waves,marked asIn+Re,while the dynamic stress on the transmitted end of the specimen is expressed by the transmitted wave,noted asTr.It is clear that the dynamic stresses on both ends of the specimen are approximately identical,i.e.In+Re≈Tr,which means that the uniformity of the dynamic stress across the specimen has been achieved[22].The dynamic behavior of rock material is different at various strain rates.Using Eq.(1),the time evolution of the strain rate can be obtained,as shown in Fig.5b.According to the ISRM suggested method [22],the strain rate of a specimen is determined by the plateau part of the strain rate history.In the modified SHPB apparatus,the dynamic compression tests on the cubic specimen are conducted in two loading condition,i.e.a strain rate of approximately 122 s-1under hydrostatic confinement of 7 MPa(specimen I)and a strain rate of approximately 320 s-1under hydrostatic confinement of 14 MPa (specimen II).Using Eq.(1),the dynamic stress–strain curve can be obtained,as depicted in Fig.6.Due to the cubic rock specimen has already been compacted in the preload stage,the dynamic stress–strain curve directly processes an elastic increasing stage.The dynamic strength of specimens I and II are 190 and 224 MPa,respectively,which are much greater than its static one.Specimen I shows an inclined main crack while two shear zones are obviously generated in specimen II,as presented in Fig.6.

Fig.5.Dynamic stress balance check and determination of strain rate.
3.2.Calibration of microscopic parameter s
A number of trial–error tests are performed,derived from laboratory experimental results,to match the microscopic parameters of the simulation specimen.Primarily,according to the static uniaxial compression tests,the deformation properties (i.e.Poisson’s ratio and elastic modulus)of rock specimens are calibrated.Thereafter,the strength properties are matched by changing the bond strength in the simulation triaxial dynamic tests.The macroscopic characteristics of bars are also calibrated in a similar manner.Tables 1 and 2 tabulated the calibrated microscopic and macroscopic results,respectively.It is worth emphasizing that extremely large bond strength is assigned in bars since the pressure bars never break.
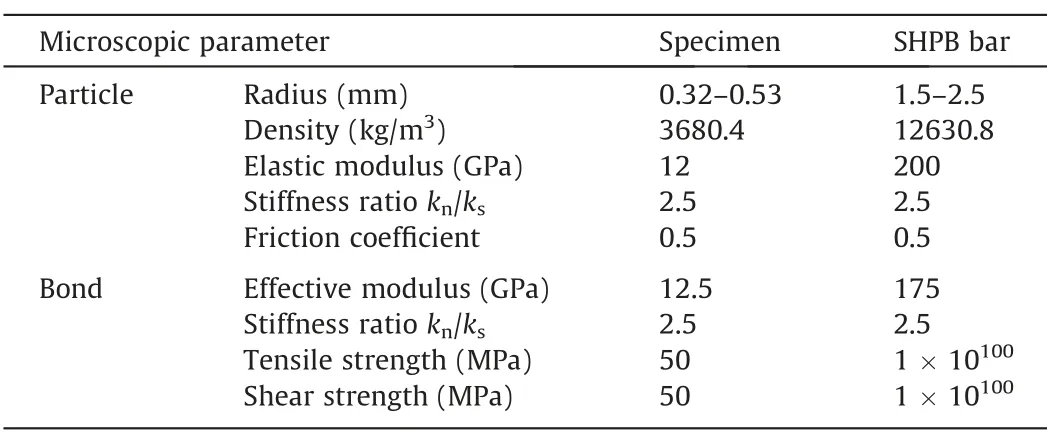
Table 1Adopted microscopic parameters in the NSTHB system.

Table 2Comparison of macroscopic parameters between laboratory and NSTHB model.
The dynamic stress–strain curve and failure modes of the numerical validation test are also presented in Fig.6.It is obviously observed that the laboratory and simulation curves are in good agreement under different loading conditions.Meanwhile,the failed specimen from numerical simulation exhibits similar failure patterns with the corresponding specimen in the laboratory.These consistency results indicate that dynamic mechanical and failure properties of triaxial confined specimens can be well reproduced by the DEM modelling.

Fig.6.Dynamic compression stress–strain curves and failure pattern of the cubic specimen from laboratory and simulation results.
3.3.Propagation of the dynamic stress wave
During dynamic loading,these three stress wave signals (i.e.εi,εr,εt)can be recorded,in the NSTHB model,at the measuring pointsA–E.Fig.7a and b displays the stress histories in the axial and radial directions in the incident bar and transmitted bar,respectively.Before turning point of 571 μs,the axial stress captured by measuring spheresA–Crepresents the incident waves(εi),while that after this time is the reflected waves(εr);the axial stress captured at measuring spheresDandEdenotes the transmitted waves(εt).The maximum values of incident waves are 409.5,408.5,and 408.7 MPa in order,while the peak values of transmitted waves at the measuring pointsDandEare 126.5 and 123.6 MPa,respectively.For radial stress,the maximum values of all signals are smaller than 2.5 MPa,and a huge difference exists compared with these of axial stress.Therefore,the dynamic 1D stress wave propagation postulation is verified in the NSTHB system.
3.4.Dynamic force balance examination
For valid data analysis of SHPB test,the dynamic force balance state of tested specimen is a prerequisite;that is,stresses on both contact surfaces should be consistent [18].To verify the dynamic force balance equilibrium state,a direct measurement approach[39,46]is adopted in this study.The incident force and transmitted force of the cubic specimen are expressed as

whereFInandFTrare the total incident force and transmitted force of specimen,respectively;NIandMTthe total quantity of incident contact and transmitted contact,respectively;thenth incident andmth transmitted contact force vectors,respectively;andthe unit-vector along the impact loading direction.
As depicted in Fig.8,the forces on both ends of the cubic specimen at a certain strain rate of approximately 210 s-1and four preload conditions of [35,7,7],[35,14,7],[35,21,7] and [35,35,7]MPa.It is worthy of note that the preload condition is represented by[σ1,σ2,σ3]in the following sections;for example,[35,21,7]MPa indicates the pre-stresses σ1,σ2,and σ3are equal to 35,21,and 7 MPa,respectively.A force equilibrium coefficient (μ) is used to assess the dynamic force balance status,which can be calculated as

Generally,if μ is not exceeded the threshold value (i.e.10%)[30],the dynamic force balance state of the specimen is satisfactory.Fig.8 marks four typical moments,includingTb,Tf,Tp,andTerepresenting balanced,fracturing,peak,and ending time of the cubic specimen failure process,respectively.Before the incident compression wave arrives at the specimen incident surface,μ is around zero,indicating that both contact forces of the specimen are consistent.The incident force and transmitted force of the specimen increase successively,and μ shows a larger fluctuation beforeTb.After that,betweenTbandTe,μ fluctuates around zero and is always smaller than the threshold value.Finely examination of dynamic force on both contact surfaces of the specimen in the entire testing process identifies that the dynamic stress equilibrium state can be obtained in all preload conditions.
4.Numerical results and discussion
4.1.Simulation scheme and stress–strain curves

Fig.7.Stress histories in the axial and radial direction of SHPB bars recorded at the measurement points A–E(the loading condition:a strain rate of 320 s-1 and a hydrostatic confinement of 14 MPa).
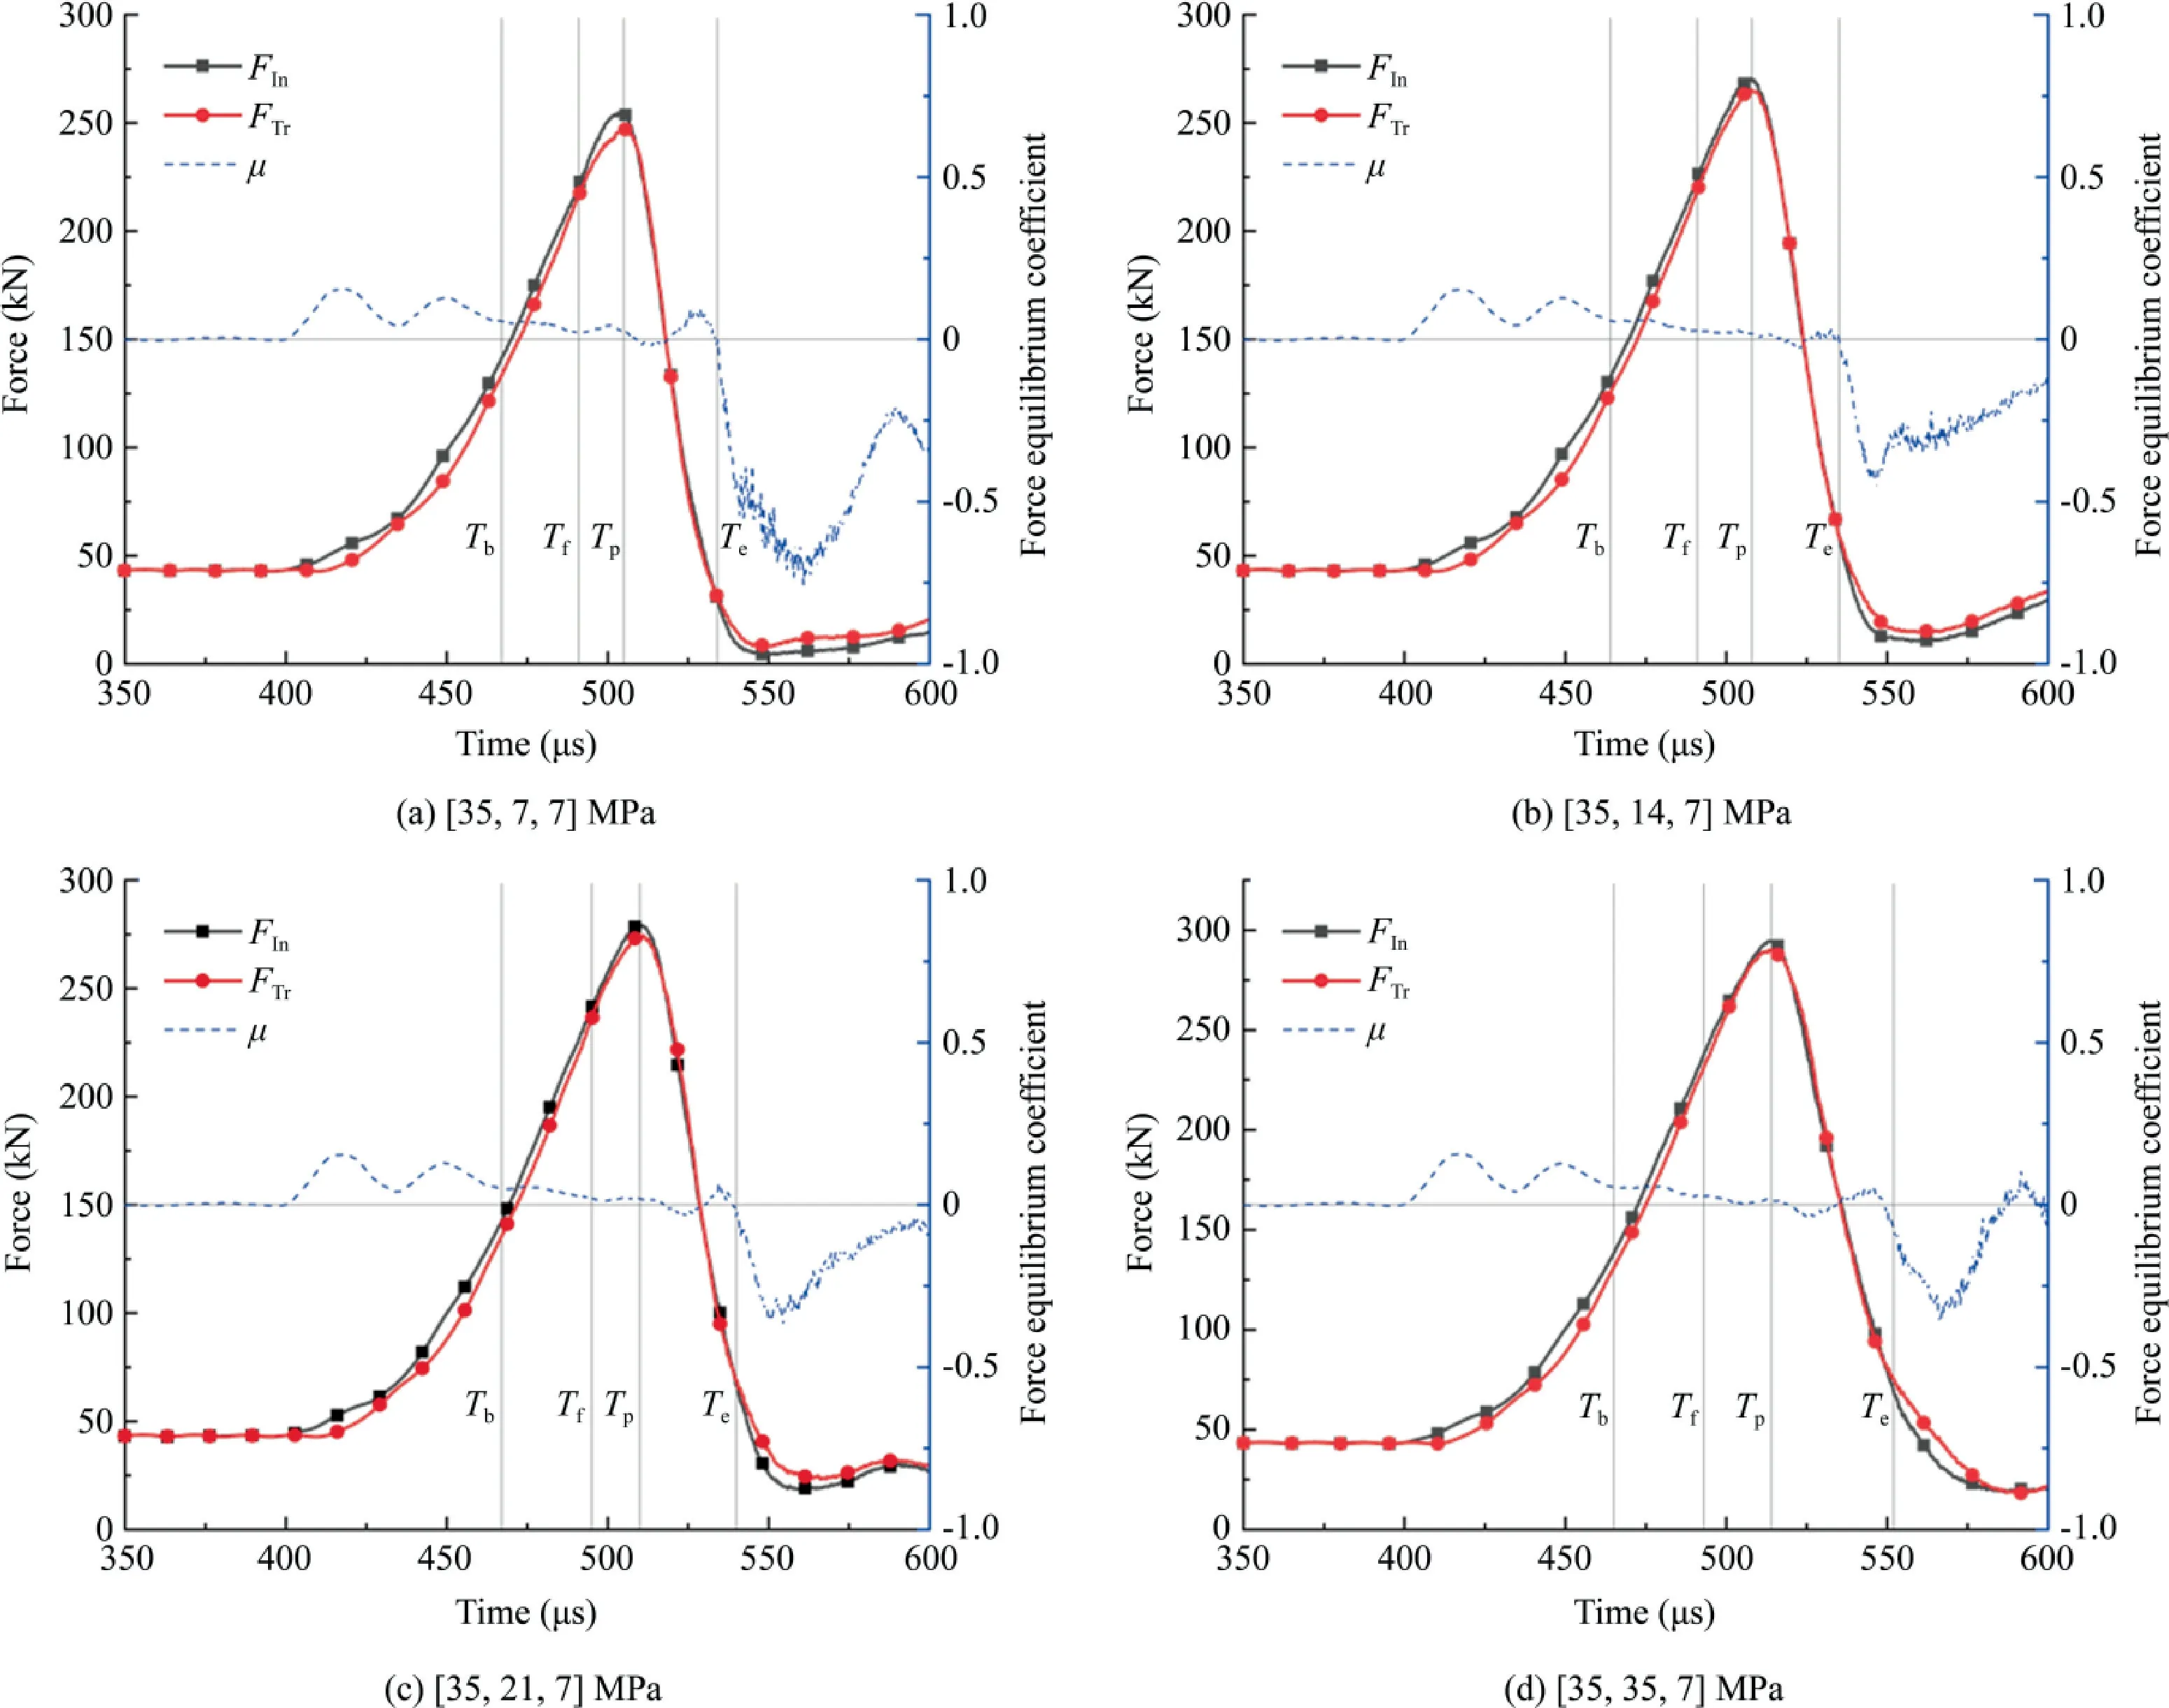
Fig.8.Dynamic force balance examination under the preload condition of [35,7,7],[35,14,7],[35,21,7],and [35,35,7] MPa with the strain rate about 210 s-1.
At given pre-stresses σ1and σ3,various σ2values are adopted to research the effects of intermediate principal stress on dynamic mechanical properties (e.g.dynamic strength,dynamic elastic modulus,and dynamic peak strain) of cubic specimens.In each preload condition,a broad range of strain rates is acquired by changing the striker velocity.The whole experimental loading scheme is presented in Table 3.

Table 3Simulation loading scheme.
Fig.9 shows time-varying histories of three principal stresses at a certain strain rate of approximately 210 s-1but four preload conditions of[35,7,7],[35,14,7],[35,21,7],and[35,35,7]MPa.During the dynamic load stage,the axial stress σ1increases first and decreases afterward while σ2and σ3barely change.By the stress servo technique in NSTHB,the constant lateral stresses state can be guaranteed.
With the strain rate changing from 88 to 308 s-1,the dynamic stress–strain curves regarding four preload conditions are presented in Fig.10.Beginning at zero,the dynamic stress–strain curves directly possess a linear-elastic rising state.Accompanied a nonlinear increase,the dynamic stress–strain curve eventually reaches its maximum value,which is described as the dynamicstrength and the corresponding strain is defined as the dynamic peak strain.Then,the stress–strain curve goes into the unloading phase and the specimen bearing capacity reduces due to the failure.As shown in Fig.11,the absolute slope of the straight part of the unloading section exhibits a decrease trend as the intermediate principal stress σ2increases,indicating that the specimen bearing capacity weakens slower under higher σ2.It should be noted that the following analysis ignores the results at the lower strain rate of about 88 s-1because some specimens keep intact at this strain rate.
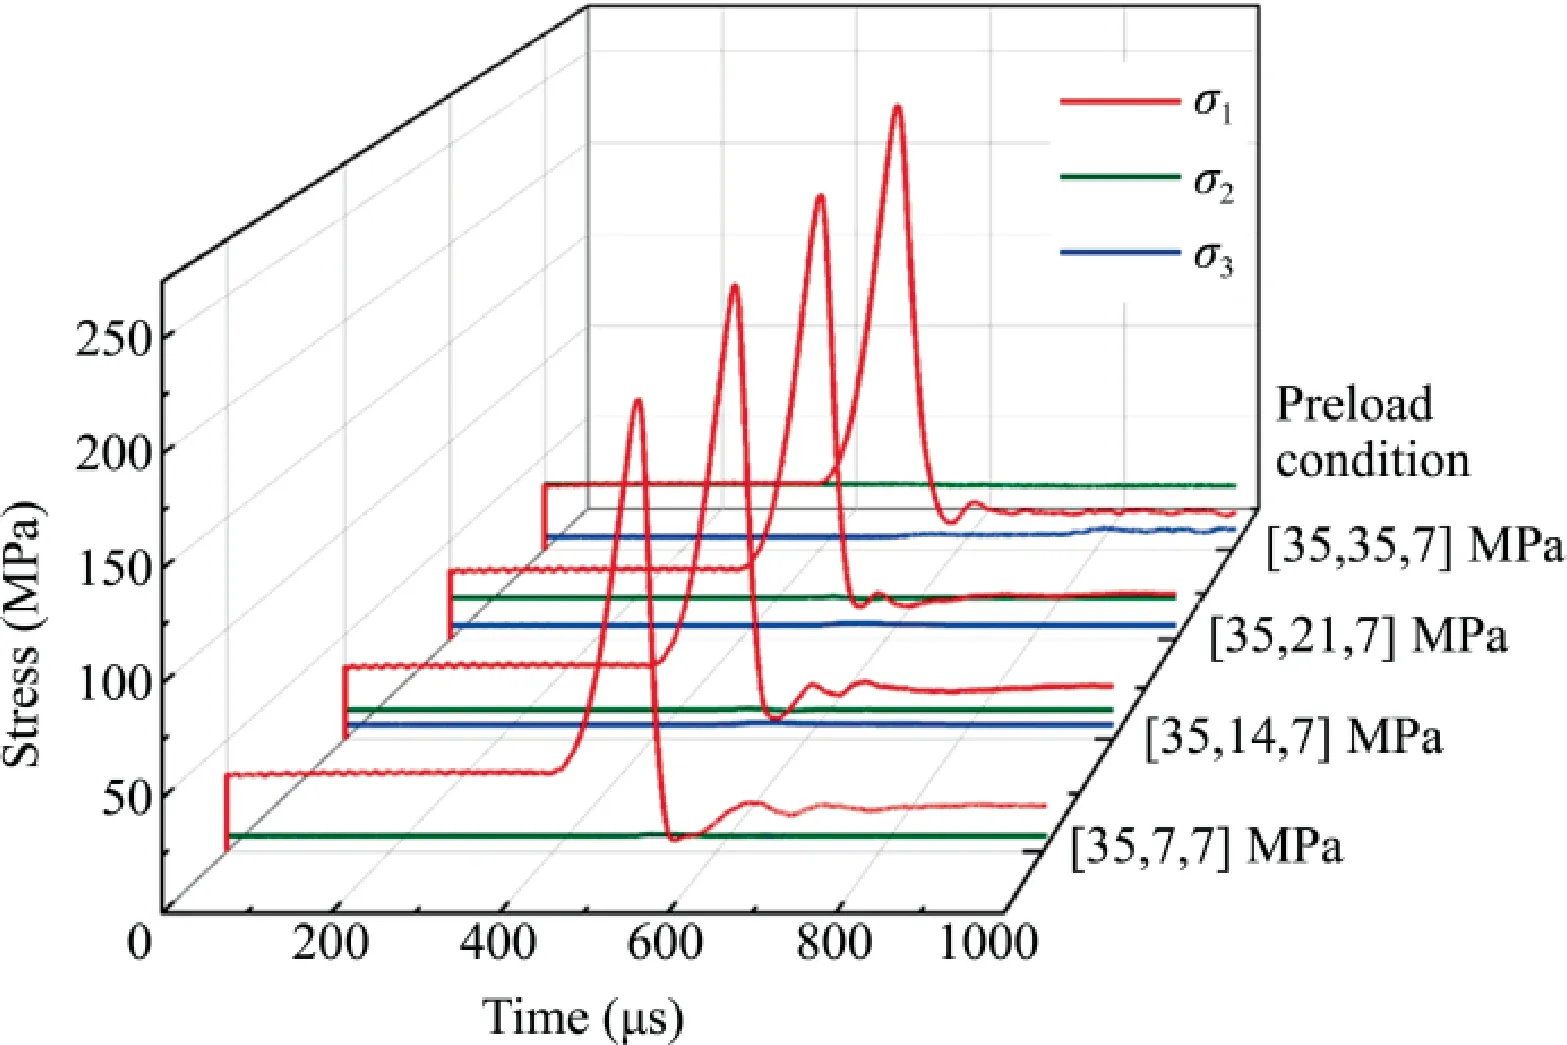
Fig.9.Three principal stresses versus time curves at a certain strain rate about 210 s-1 under four preload conditions.

Fig.10.Dynamic stress–strain curves of cubic specimens subjected to the preload condition of[35,7,7],[35,14,7],[35,21,7],and[35,35,7]MPa at different strain rates.

Fig.11.Absolute slope of the unloading section varies with intermediate principal stress.
4.2.Intermediate principal stress effect on dynamic strength and deformation properties
The results obtained from the NSTHB tests are listed in Table 4.Noted that the total strength of each specimen is the sum of prestress σ1(i.e.35 MPa) and its dynamic strength.To explore the strain rate effect on the dynamic strength and dynamic peak strain,the results under four preload conditions are shown in Fig.12a and b.Under a certain preload condition,the relationship between the dynamic strength and the strain rate can be well fitted by the logarithmic function,i.e.σd=a×log.ε+b.The formulas of the fitting curves are listed in Table 5,and all the coefficients of determinationR2are greater than 0.99.The dynamic strength increases with the rising strain rate,as confirmed by many researchers [27,30].The dynamic peak strain also shows an upward trend as the strain rate increases.In the authors’ tests,the dynamic elastic modulus of confined rocks exhibits barely correlation of strain rate.A similar conclusion was drawn by Du et al.[42] and Frew et al.[21].

Table 4Dynamic strength and deformation properties at various strain rates under different preload conditions.

Table 5Formulas of the fitting curves at different preload conditions.
The dynamic strength,deformation properties of triaxial confined rock specimen are sensitive to the intermediate principal stress σ2of preload condition as well.At given pre-stresses σ1and σ3,not only the dynamic elastic modulus but dynamic strength grows linearly with the rising σ2,as represented in Fig.12c and d.As the strain rate changes from approximately 117 to 305 s-1,the increments of dynamic strength are 22.9,24.1,27.3,and 29.9 MPa,and the increments of dynamic peak strain are 0.0017,0.0019,0.0024,and 0.0030 under different σ2.The strain rate sensitivity of dynamic peak strain and dynamic strength of triaxial confined specimen increases with the rise of σ2.
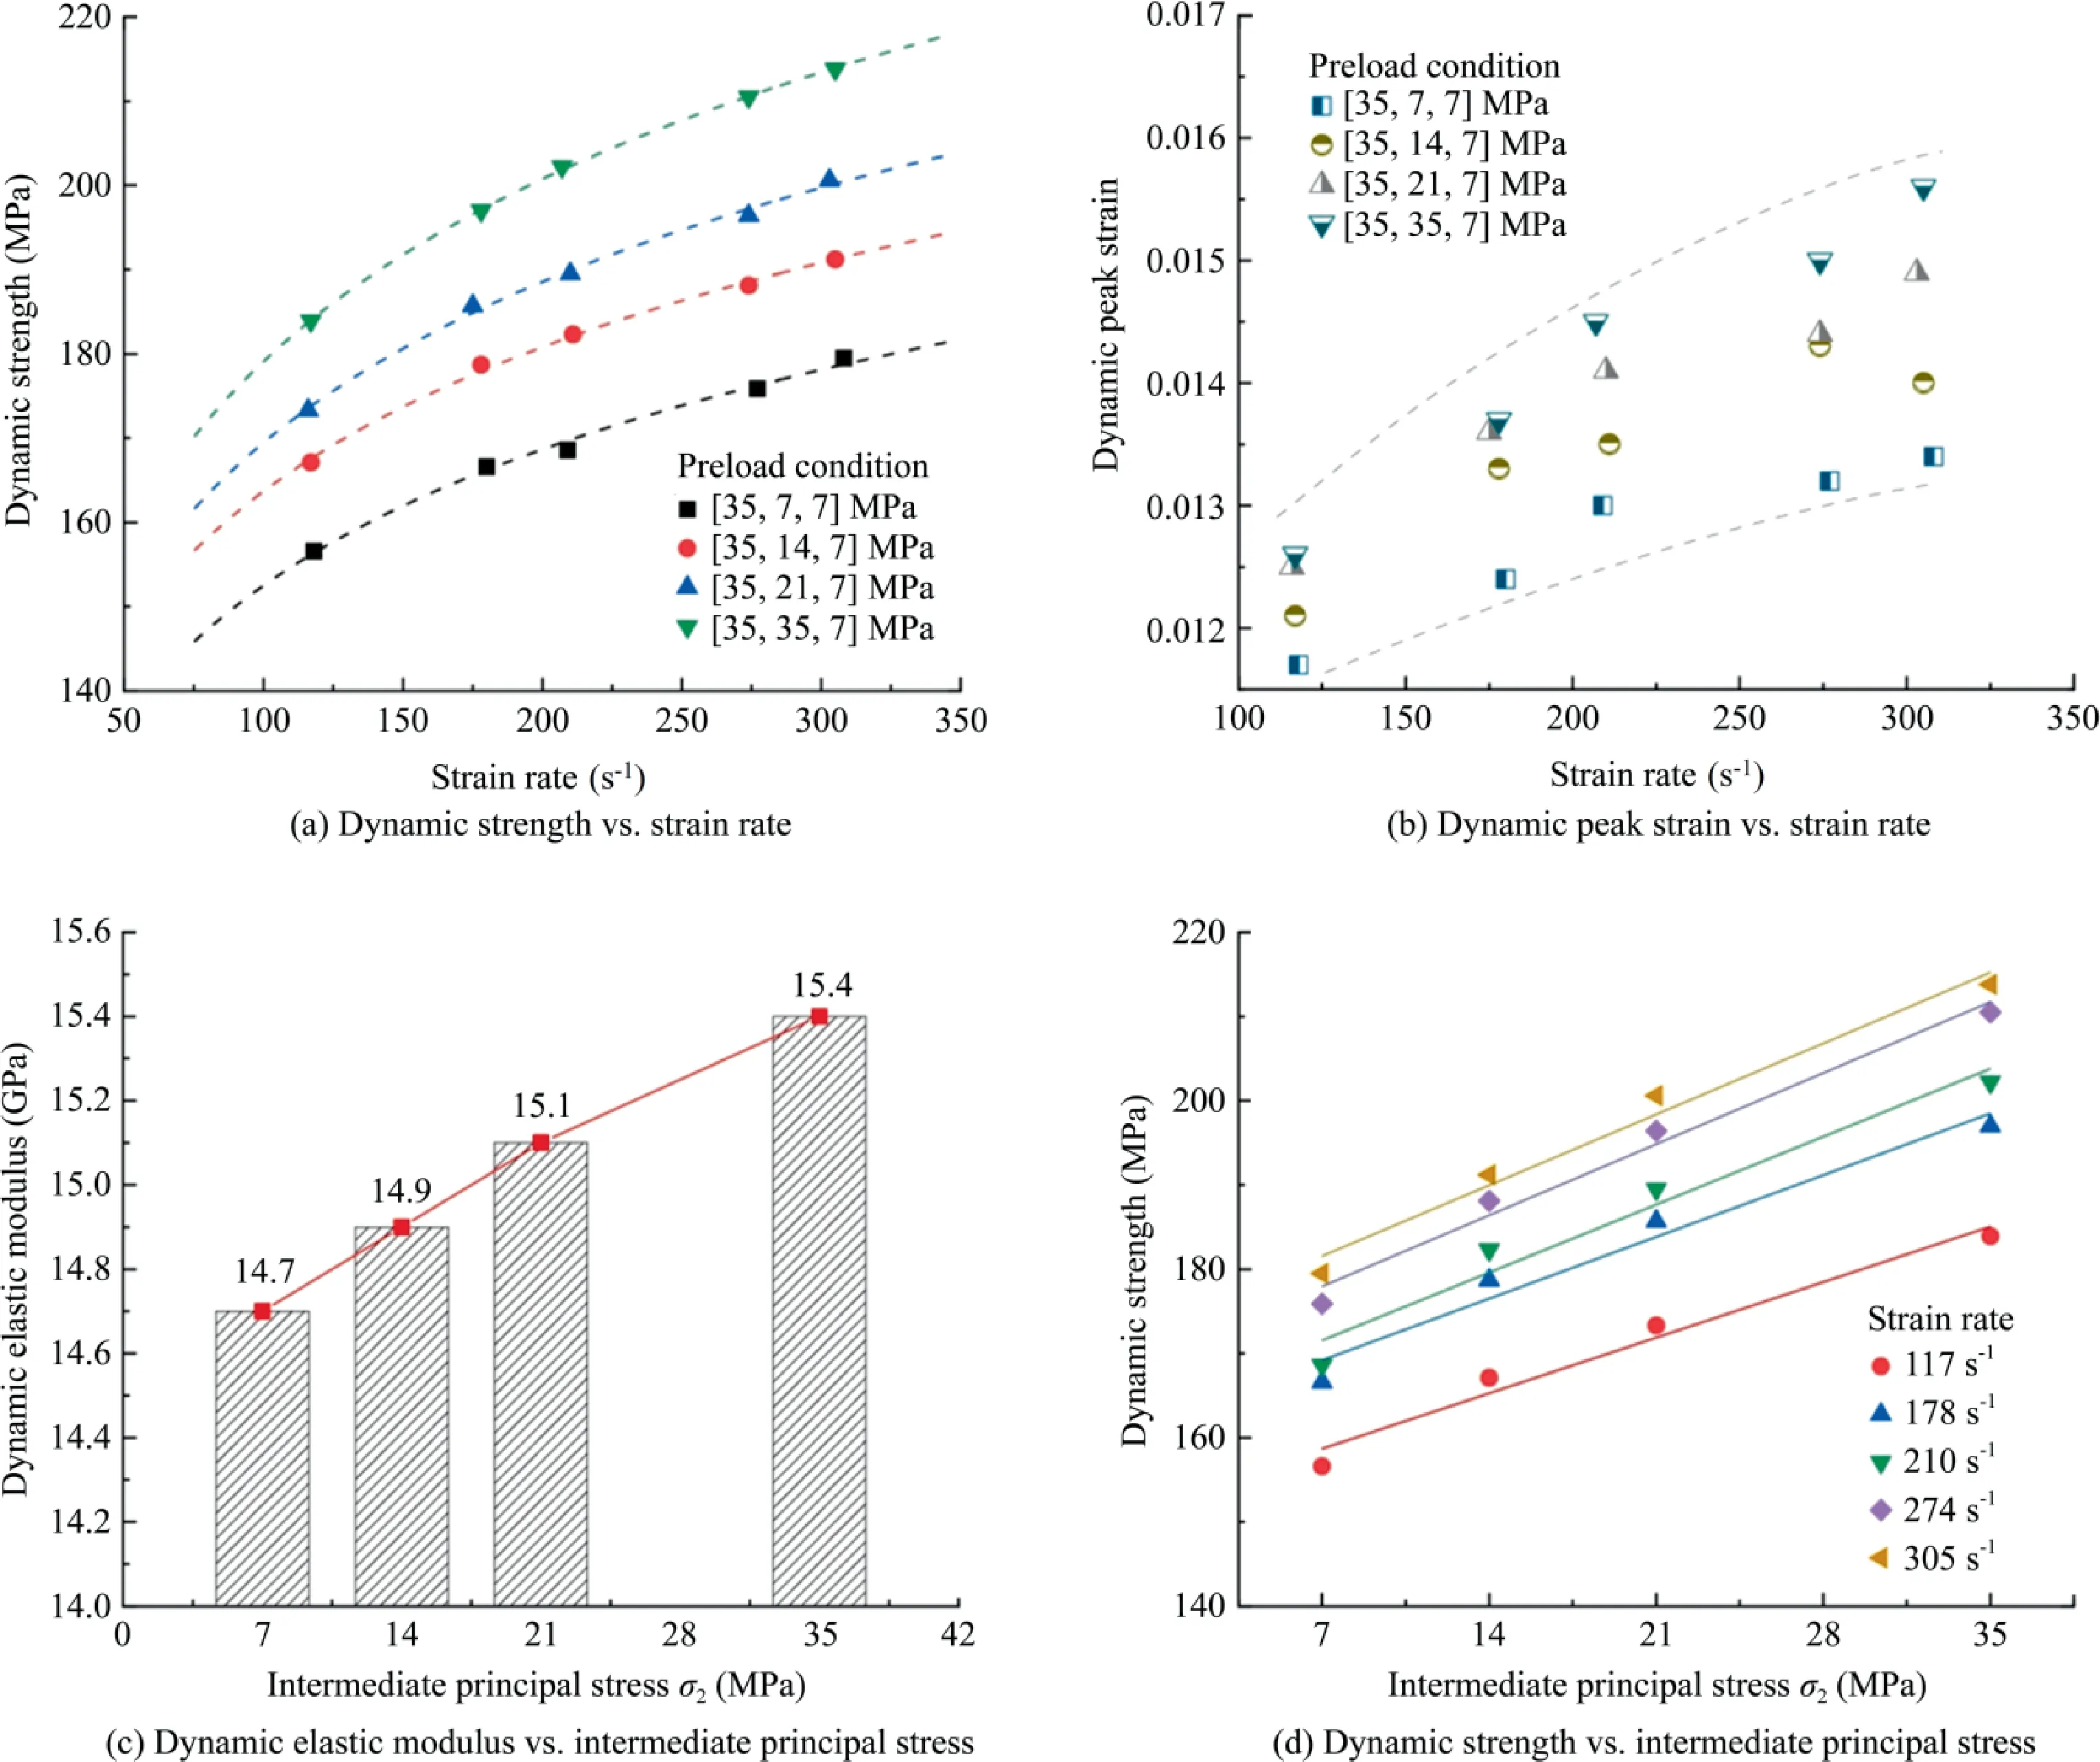
Fig.12.Strain rate effect and intermediate principal stress effect on dynamic mechanical properties.
4.3.Intermediate principal stress effect on failure modes
For revealing the intermediate principal stress effect on failure modes of a triaxial pressurized specimen,two typical test conditions (i.e.[35,7,7] and [35,35,7] MPa with a certain strain rate of approximately 210 s-1) are choosing to demonstrate the progressive failure process of triaxial confined rock specimens.As depicted in Figs.13 and 14,the dynamic stress field evolution and progressive fracture process at four typical loading moments(i.e.Tb,Tf,Tp,andTe) are displayed in turn.In the stress field,the magnitude of stress is characterized by rainbow color,and the colder tone indicates the larger compressive stress.The spatial distribution of micro-cracks can be discerned by simulation acoustic emission (AE) activities.The blue dots represent tensile microcracks,while the red dots indicate the shear micro-cracks.For demonstration,the results are exhibited along the direction of σ2.
At timeTb,the color of the dynamic maximum principal stress field is almost the same,which further shows that the dynamic force balance equilibrium status of tested specimens has been achieved.Owning to the uneven interfaces between the simulated bars and specimen,some damages distribute randomly at both contact surfaces regardless of preload condition.At timeTf,the stress gradually concentrates to the central region and some micro-cracks occur in the middle of the cubic specimen.At timeTp,the stress concentration region further widens and the compressive stress mounts to the maximum value,while the microcracks gathered and ulteriorly propagated emerging the main macroscopic cracks.At timeTe,the rapidly expanding fractures eventually spread throughout the whole specimen and the stress declines to a small value.
The specimens under coupled true triaxial confinement and dynamic loading fail with different patterns as the σ2increases.At the preload condition of [35,7,7] MPa,the main crack propagates along the diagonal of the cubic specimen,forming a single shear zone with an inclination of 45°.At the preload condition of[35,35,7] MPa,two main macroscopic cracks are slanted in the direction of σ1with an angle of 32°,forming two parallel shear zones.The conclusion is drawn that the failure modes of rock specimens especially the macro shear zone orientation are significantly affected by the intermediate principal stress σ2.With a fixed value of σ3,the angle of the shear zone in rock specimens decreases with the increasing σ2.Similar results were observed in quasi-static true triaxial compression tests,e.g.Mogi [4] in dolomite,and Haimson and Chang [6] in granite.From the perspective of mechanics,the higher σ2restricts the dilatability of rocks in the orientation of σ2,and thus rock specimen is more likely to dilate in the direction of σ3.
Two typical tests under the preload condition of[35,21,7]MPa at strain rates of 116 and 303 s-1are selected to demonstrate the effect of strain rate on the failure pattern of cubic specimens.Figs.15 and 16 present the dynamic stress field evolution and progressive fracture process at different strain rates.The cubic rock specimens both exhibit two nearly parallel shear zones with an angle of about 37° even under the different strain rates.With a higher strain rate of 303 s-1,the main macroscopic cracks are wider and more AE dots emerge.From the above analysis,it can be suggested that the increasing strain rate barely affects the failure modes but intensifies the damage degree of rock specimens[19].
4.4.Devices comparison
As shown in Fig.17,the THB3B system is numerically established.It should be worth noting that the cubic specimen and bars in THB3B system and NSTHB system are set with the same corresponding microscopic parameter to guarantee that the main mechanical and physical properties of these materials are consistent.The cubic specimens with a fixed preload condition of [35,21,7] MPa but different strain rates are simulated in THB3B system,and the mechanical properties of specimen in THB3B system are compared with that in NSTHB system.This numerical model consists of a striker,six square bars with a cross-section of 35 mm× 35 mm in three perpendicular directions.The dynamic loading system is composed of a 1.6 m incident bar,a 1.0 m transmitted bar,and a 0.2 m striker,whose axial direction is in accordance withx-axis.Four output bars with a length of 800 mm are used to apply two lateral confining stresses (σ2and σ3) inyandzaxial directions.To capture stress waves,six measurement spheres are placed in appropriate positions at each of these six bars,respectively.

Fig.13.Stress evolution of the cubic specimen with preload condition of [35,7,7] and [35,35,7] MPa at the strain rate of approximately 210 s-1.
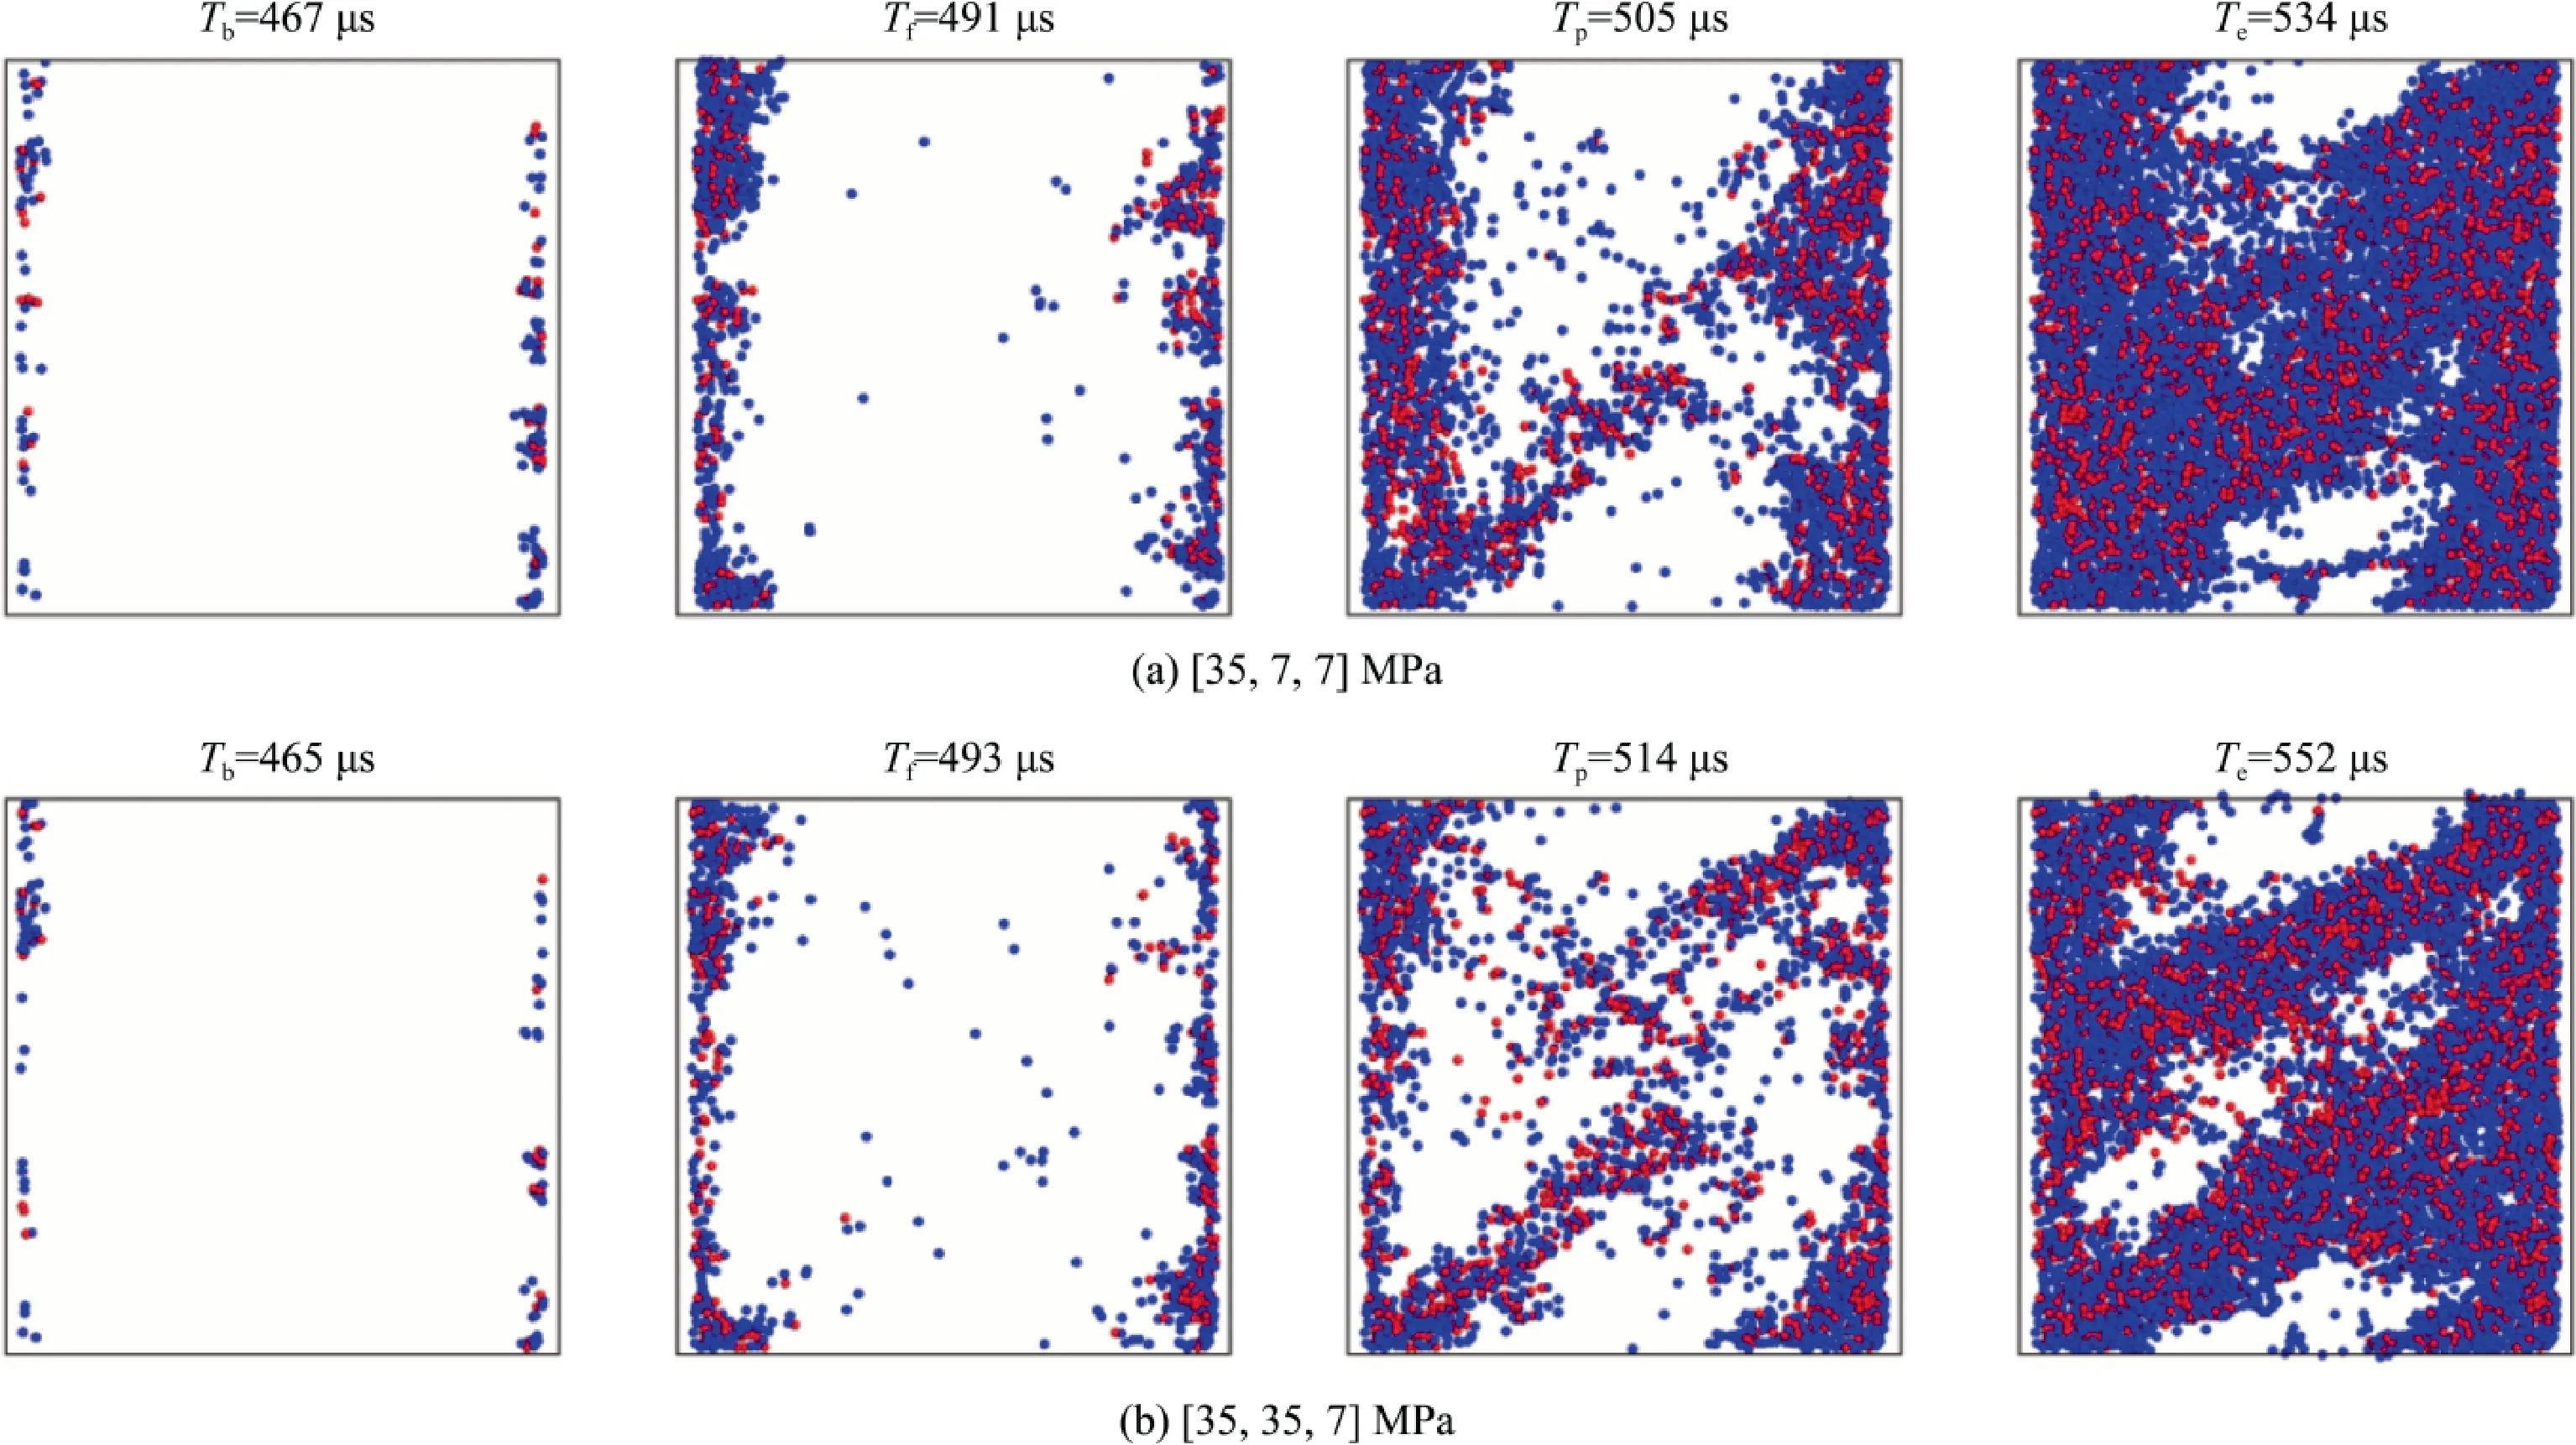
Fig.14.Progressive failure process under the preload condition of [35,7,7] and [35,35,7] MPa at the strain rate of approximately 210 s-1.

Fig.15.Stress evolution of the cubic specimen under preload condition of [35,21,7] MPa at the strain rate of 116 and 303 s-1.
Fig.18 presents the dynamic strength and peak strain under various strain rates.Not only the dynamic strength but dynamic peak strain increases as the strain rate is rising.At lower strain rates,both the dynamic strength and dynamic peak strain in NSTHB are greater.At upper strain rates,the dynamic strengths of rock specimens in these two systems come to a close while the dynamic peak strain in the THB3B is much larger.Fig.19 demonstrates the dynamic stress–strain curves of the cubic specimen under the preload condition of [35,21,7] MPa in the THB3B and the NSTHB model at various strain rates.The stress–strain curves of these tests own nearly the same linear elastic region,which means that the preload compact effects in these two triaxial Hopkinson bar systems are consistent.However,the inelastic deformation and the dynamic strength are apparently different in these two triaxial Hopkinson bar systems.In the THB3B,the specimens exhibit much more nonlinear deformation before the dynamic stress reaches peak value leading to larger dynamic peak strain at a higher strain rate.

Fig.16.Progressive failure process under the preload condition of [35,21,7] MPa at the strain rate of 116 and 303 s-1.

Fig.17.Discrete element model of the THB3B.
The main reason causing these measuring differences is that the changes of the lateral stresses are quite distinct in these two triaxial Hopkinson bar systems.Fig.20a and b present the lateral stresses variation of the specimen under the fixed preload condition of[35,21,7] MPa but different strain rates in the NSTHB and the THB3B,respectively.In the NSTHB,the lateral stresses σ2and σ3slightly oscillate around the desired values as the strain rate varies from 88 to 303 s-1,during the dynamic loading process.In the THB3B,however,both σ2and σ3significantly increase during the dynamic loading process.At an upper strain rate of 280 s-1,σ2increases from 21 to 58.5 MPa and the increasing rate is 178%;the σ3exhibits a much great increasing rate of 686%,from 7 to 55 MPa.
Though the THB3B is so far the latest laboratory apparatus to explore the dynamic responses of rocks confronted with true triaxial pre-stresses state,large increments of σ2and σ3cannot be avoided during the dynamic testing process owing to the inertial effect of bars and Poisson effect of rocks.As rock materials and alloy bars differ greatly in stiffness,the variation of lateral stress in the THB3B tests hardly assesses the true stress state of rocks suffered the impact loads in practical engineering.In this case,the study on the dynamic responses of triaxial confined rocks becomes inaccurate since the unrealistic lateral stress increments.In the traditional quasi-static true triaxial tests,researchers usually change the principal stresses σ2and σ3according to the designed stress path,so as to make the constitutive model of different rock materials readily available.The NSTHB simulations accurately control the change of lateral stress by the precise stress servo technique,so this method could provide a more controllable tool for studying the dynamic behavior of rocks under true triaxial confinement.

Fig.18.Dynamic strength and dynamic peak strain in two triaxial Hopkinson bar systems under the same preload condition of [35,21,7] MPa.

Fig.19.Dynamic stress-strain curves of the cubic specimen in two triaxial Hopkinson bar systems under the same preload condition of [35,21,7] MPa.
5.Conclusions
The authors developed a numerical servo triaxial Hopkinson bar system to research the dynamic mechanical properties of rocks subjected to controllable triaxial confinements.A set of dynamic true triaxial tests under four preload conditions and six strain rates were numerically conducted to systematically explore the effect of intermediate principal stress on dynamic responses of rocks confronted with true triaxial pre-stresses confinement.The primary conclusions of this study are as follows.
(1) The dynamic strength and dynamic elastic modulus increase with the rise of intermediate principal stress σ2at fixed prestresses σ1and σ3.The strain rate sensitivity of dynamic strength and dynamic peak strain of triaxial confined rocks increases when σ2grows.As the strain rate increases,the dynamic strength increases while the dynamic elastic modulus is independent of strain rates.
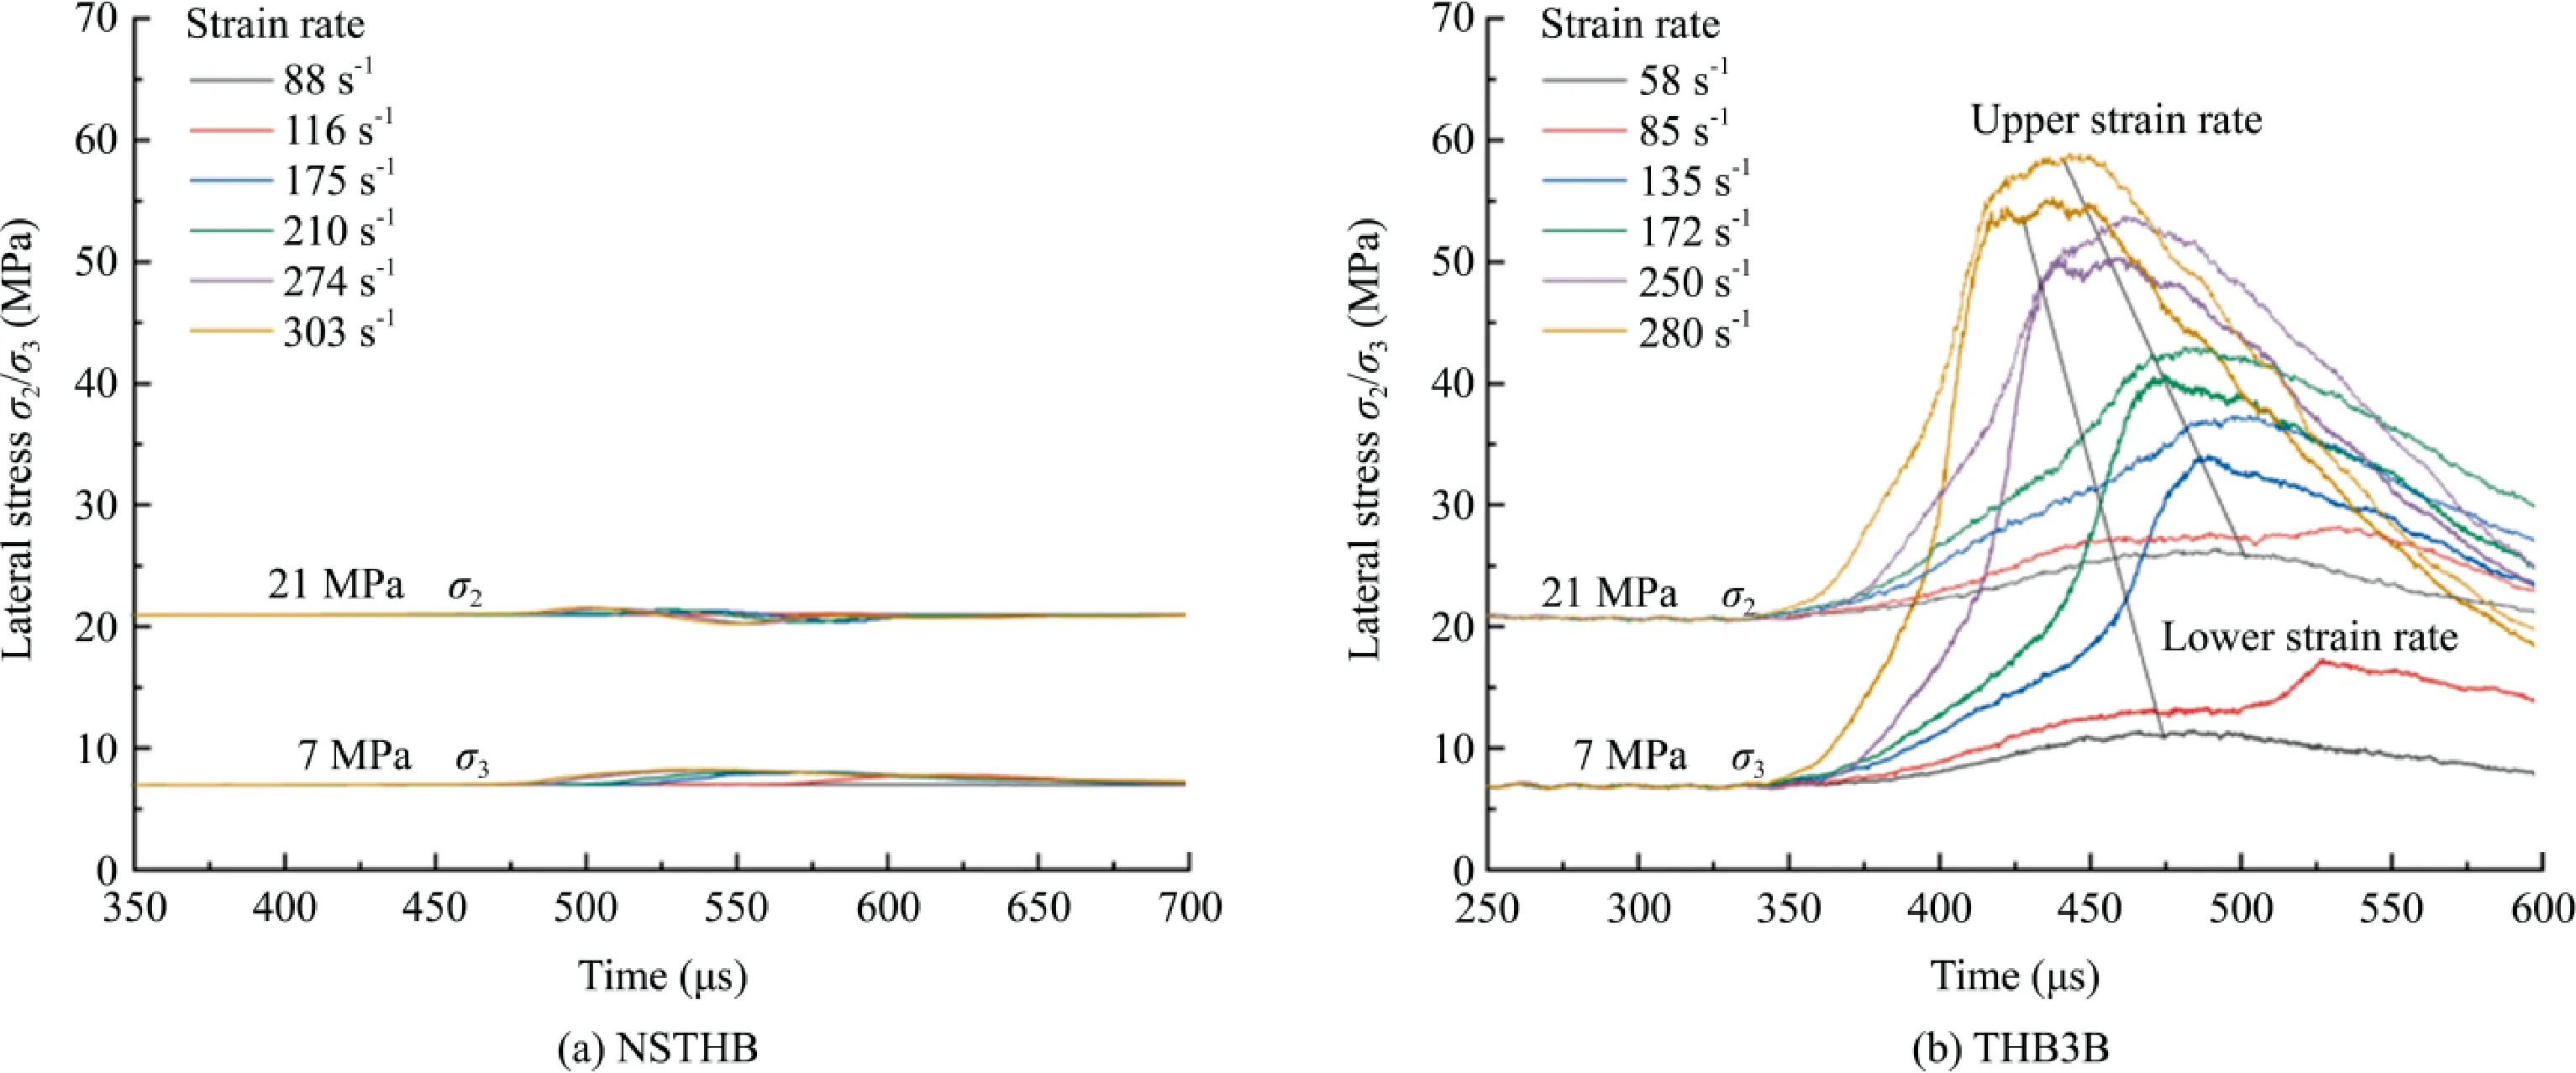
Fig.20.Two lateral stresses vary with dynamic time at the same preload condition of [35,21,7] MPa in the NSTHB and the THB3B.
(2) The simulated acoustic emission distributions suggest that the intermediate principal stress σ2dramatically affects the dynamic failure modes of confined rocks.With the increasing σ2,the failure pattern switches from a single diagonal shear zone to two parallel shear zones with a small slant.The increasing strain rate barely affects the failure modes but intensifies the damage degree of rocks.
(3) Compared to the conventional triaxial Hopkinson bar using three bar pairs,the authors’numerical servo triaxial Hopkinson bar system can guarantee constant lateral confinement during the whole dynamic loading process.This method thus could provide a more controllable tool for studying the dynamic behavior and constitutive model of rocks under true triaxial confinement.
Acknowledgements
The authors are grateful for the financial support from the National Natural Science Foundation of China (Nos.52039007 and 52009086),and the Sichuan Province Youth Science and Technology Innovation Team (No.2020JDTD0001).
杂志排行

矿业科学技术学报的其它文章
- Strategic sill pillar design for reduced hanging wall overbreak in longhole mining
- Effects of confining pressure on acoustic emission and failure characteristics of sandstone
- Understanding the influence of petrographic parameters on strength of differently sized shale specimens using XRD and SEM
- Experimental investigation of rigid confinement effects of radial strain on dynamic mechanical properties and failure modes of concrete
- Dynamic Mode Ⅱfracture behavior of rocks under hydrostatic pressure using the short core in compression (SCC) method
- Experimental study on the infrared precursor characteristics of gas-bearing coal failure under loading