Synthesis and Characterization of Polyaniline/MgTiO3 Composite with Excellent Thermal and Electrochemical Performance
2021-09-15JINYazhouXINGWeiweiZHAOSiyuGUXiaojieCHILipingYUANMengXUFenWANGShaoxu
JIN Yazhou, XING Weiwei, ZHAO Siyu, GU Xiaojie, CHI Liping, YUAN Meng,XU Fen, WANG Shaoxu*
(1. College of Materials Science and Engineering, Dalian Jiaotong University, Dalian 116028, China; 2. Dalian Eco-environmental Affairs Service Center,Dalian 116028, China; 3. Guangxi Key Laboratory of Information Materials (Guilin University of Electronic Technology),Guilin 541004, China; 4. College of Environmental and Chemical Engineering, Dalian Jiaotong University, Dalian 116028, China)
Abstract: This article explores the effects of doping ferroelectric materials MgTiO3 with different proportions on the properties of polyaniline (PANI). PANI / MgTiO3 composites were prepared by in-situ composite method. Fourier transform infrared spectroscopy (FTIR) and X-ray diffraction (XRD) were used to characterize the structure of the composites. Scanning electron microscope (SEM) was used to characterize the morphology of the composites.The thermal stability of the composites was investigated by thermogravimetry(TG) and derivative thermogravimetry (DTG). Electrochemical methods (cyclic voltammetry(CV),electrochemical impedance spectroscopy(EIS), and constant current charge-discharge test) were used to compare and analyze the electrochemical performance of the composites.TG-DTG analysis and electrochemical experiments all show that the thermal stability and electrochemical properties of the PANI / MgTiO3 composite with a mass ratio of 82/18 (w/w) are the best.The results indicate that there is a synergistic effect between PANI and MgTiO3, which improves the performances of the PANI when the appropriate amount of MgTiO3 is added.
Key words: PANI/MgTiO3 composites; in-situ composite method; thermal stability; electrochemical performance
1 Introduction
Conductive polymers such as polythiophene,polypyrrole, polyacetylene, polyaniline, and polyphenylene are being studied in multiple disciplines including environmental, electronics, electromagnetics,thermoelectric, sensors, batteries, electroluminescence,and electromechanical applications[1-5]. Polyaniline(PANI) has the advantages of easier synthesis, cheaper raw materials, stable chemical properties and adjustable conductivity, and it is widely considered as one of the conductive polymers with high prospects for practical application[6-7]. Several disadvantages, such as poor solubility, poor mechanical properties, and low effective surface area, limit the use of PANI[8-10].To overcome these limitations, PANI is usually polymerized in the presence of various other organic and inorganic materials to enhance its performance[11-13].Ferroelectric materials are important functional materials because of their excellent dielectric properties.Piezoelectric properties, as well as pyroelectric and optical properties, have received widespread attention.Titanate, niobate, zirconate, and cobaltate are all ferroelectric[14]. MgTiO3is a pyrite-type structure. Due to the higher dielectric constant and lower synthesis and sintering temperature, MgTiO3has a broad application prospect in life[15,16]. Recently through our research,we found that when ferroelectric material (MgTiO3) is doped in PANI, the performance of PANI is significantly improved.
In this study, PANI and PANI/ MgTiO3composites were prepared byin-situcomposite methods. X-ray diffraction analysis, scanning electron microscopy,and Frontier Fourier infrared spectrometer were used to characterize the structure and surface morphology of the synthesized composites. The thermal stability was detected by a thermogravimetric analyzer, and the electrochemical properties were analyzed by cyclic voltammetry(CV), electrochemical impedance spectroscopy(EIS), and constant current charge–discharge test.
2 Experimental
2.1 Materials
Aniline(Tianjin Guangfu Technology Co, Ltd,99%), Ammonium peroxydisulfate (APS, Merck,Kenilworth, NJ, USA, 99%), MgTiO3(Dalian Institute of Physical Chemistry, Chinese Academy of Sciences),C2H5OH (Tianjin Tianli Chemical Reagent Co, Ltd),H2SO4(Sigma Aldrich, St. Louis, MO, USA, 98%),Acetone (Merck, Kenilworth, NJ, USA, 95%) and C5H5NO(Tianjin Guangfu Technology Co, Ltd.). All of the reagents that were involved in the experiments were of analytical grade. Deionized water was used throughout the entire study.
2.2 Material synthesis
The calculated amount of aniline (0.4 M, 40 mmol) was dissolved in 100 mL of an aqueous solution H2SO4. APS (0.4 M,40 mmol) and MgTiO3were dissolved in 100 mL H2SO4(0.5 M). Wherein the molar ratio of PANI to MgTiO3was 1:1,3:1,5:1. The oxidant solution was then added slowly to the aniline solution with continuous stirring at 0-5 ℃. The reaction mixture was stirred continuously for 3 h and kept in refrigerator overnight to complete the reaction. The reaction mixture was then filtered and washed with H2SO4(0.1 M) until the filtrate became colorless and subsequently with deionized water until the filtrate became neutral.It was then washed with a mixture of acetone and methanol (1:1 ratio) to remove unreacted monomer and oligomers. The obtained polymer was dried in a vacuum oven at 100 millibars of pressure and 60 ℃overnight. The green color of the obtained polymer indicated the formation of conductive PANI emeraldine salt.
2.3 Methods of characterization
The XRD test in this experiment was performed on a DX-2000 powder X-ray diffractometer with a scanning range of 10°-80°. The thermal stability of the specimens was carried out using a Setsys16/18 thermogravimetric (TG) analyzer in air atmosphere and the air as protective gas.The Fourier infrared spectrum analysis of the material was completed using a Bruck Tensor 27 spectrophotometer in the wavelength range 4 000-400 cm−1with a resolution ratio of 4 cm−1.The morphology of materials was performed using a JSM-6360LV scanning electron microscope (SEM).Electrochemical experiments were performed using a CHI600D electrochemical workstation (Shanghai Chenhua) in a 0.1 mol/L HClO4electrolyte with a threeelectrode system. 3 mg of the sample was dispersed in 0.8 mL of ethanol, 0.7 mL of deionized water, and Nafion ( 15 μL, 5%) to obtain a suspension. A working electrode was prepared by dropping the suspension (15 μL) on a glassy carbon electrode (5 mm) pre-polished.The three-electrode system uses a platinum electrode as an auxiliary electrode, and Ag / AgCl is used as a reference electrode.
3 Results and discussion
3.1 Composition analysis
As shown in Fig.1, it is the TG curve of PANI and PANI/MgTiO3composites. As the temperature increases, the weight of the four samples no longer decreases at a temperature of 800 ℃. The weight of the PANI(curve d) is reduced to 8% of total weight of the sample at the end, and the PANI/MgTiO3composites (curves a-c) are reduced to 47%, 26%,and 23%, respectively. Because the weight of MgTiO3does not change from room temperature to 800 ℃, and the composition of the composite is calculated from the analysis of the thermogravimetric curves[17].For example, the content of MgTiO3in composite(curve a) is (47-8)% = 39% and PANI is (100-39)% = 61%.According to the above calculation method, the mass ratios of MgTiO3in PANI / MgTiO3composites are calculated to be 39 wt%,18wt% and 15 wt%,respectively.

Fig.1 TG curve of polyaniline and PANI / MgTiO3 composite: (a)PANI / MgTiO3 (61/39 (w / w)); (b) PANI / MgTiO3 (82/18(w / w)); (c) PANI / MgTiO3 (85/15 (w / w)); (d) PANI
3.2 Structure characterization
Fig.2 is the SEM image of PANI and PANI /MgTiO3composites, which are both magnified at 20 000 times. From Fig.2(d), it can be clearly seen that PANI has a morphology of a small rod shape and the sample particles have agglomeration. When PANI are doped with a small amount of MgTiO3in Fig.2(b)and 2(c), the polyaniline / MgTiO3composites selfassemble to form a tight cluster coral display, and the morphology is very regular. As the mass of the MgTiO3increases, as shown in Fig.2(a), the sample morphology changes from regular to irregular. And the rod shape becomes thicker and larger than that doped with less amount of MgTiO3. From the SEM image, we can see MgTiO3content has a significant effect on the morphology of the composites.
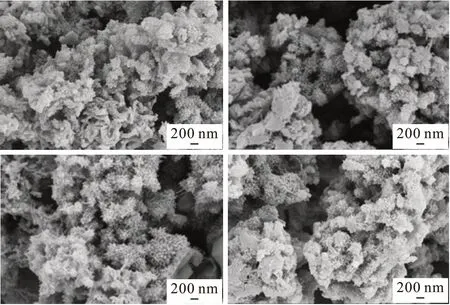
Fig.2 SEM image of polyaniline and PANI / MgTiO3 composite:(a) PANI / MgTiO3 (61/39 (w / w)); (b) PANI / MgTiO3(82/18 (w / w)); (c) PANI / MgTiO3 (85/15 (w / w)); (d)PANI
Fig.3 shows the XRD diffraction pattern of PANI,PANI / MgTiO3composite and MgTiO3. Curve d shows that the PANI has a certain degree of crystallinity.There are two very obvious diffraction peaks at 2θ=20° and 2θ= 25°. The diffraction peak at 2θ= 20° is a diffraction peak generated by the periodicity parallel to the effect of the polymer chain groups[18,19]. The diffraction peak at 2θ= 25 ° is the diffraction peak generated by the periodicity perpendicular to the polymer chain groups. Curve e is the XRD diffraction pattern of MgTiO3. There are very sharp peaks at 18°,35°, 42°, and 62°, respcetively, indicating a welldeveloped crystal structure.
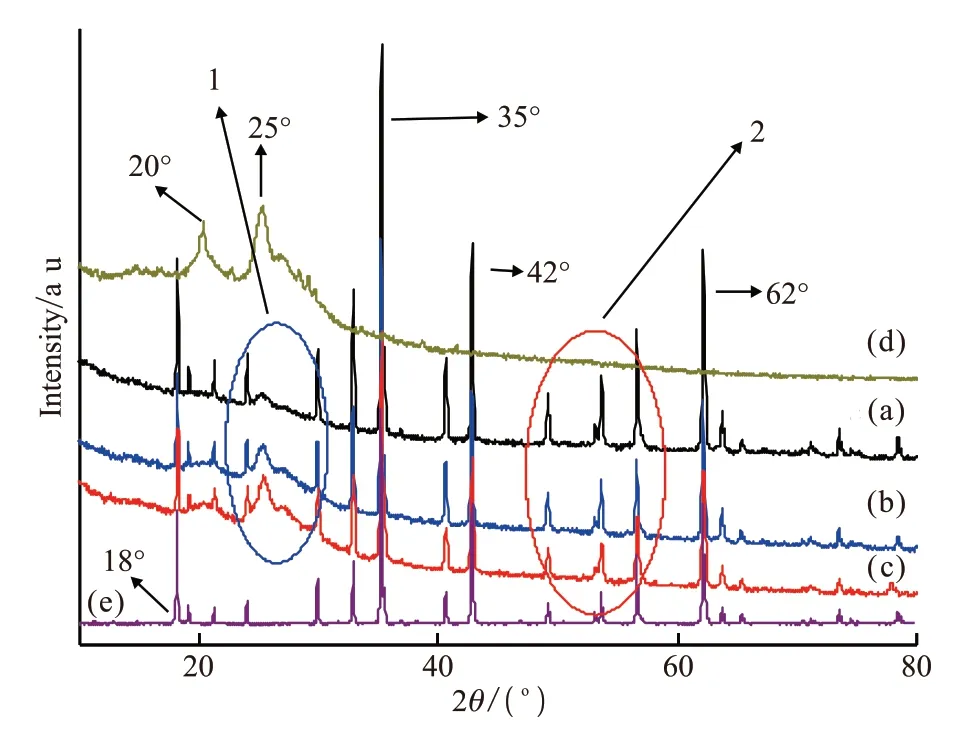
Fig.3 XRD patterns of polyaniline and PANI / MgTiO3 composite:PANI / MgTiO3 (61/39 (w / w)); (b) PANI / MgTiO3 (82/18(w / w)); (c) PANI / MgTiO3 (85/15 (w / w)); (d) Pure PANI;(e)MgTiO3
In the diffraction pattern of PANI / MgTiO3composite (curve a, b, and c ), both the diffraction peaks of PANI and MgTiO3can be clearly observed.As the content of MgTiO3increases, the intensity of the diffraction peak in circle 2 becomes stronger and sharper. Similarly, the diffraction peaks in circle 1 can clearly be observed as the diffraction peaks of PANI. It can be concluded that characteristic diffraction peaks of PANI and MgTiO3exist in the composites. Therefore,composites doped with MgTiO3were successfully synthesized.
In the infrared spectrum of PANI, the individual absorption peaks change due to different types of acids to synthesize PANI. This research used sulfuric acid to synthesize PANI. In Fig.4, it can be observed that the infrared spectrum of PANI/MgTiO3composite mainly shows the characteristic peaks of PANI. The polymer have strong absorption peaks at wavenumbers of 834,1 195, 1 364, 1 517, 1 617, and 2 875 cm-1. Among them, the absorption peak at a wavenumber of 834 cm-1is caused by bending vibration outside the C-H plane on the benzene ring; the absorption peak at a wavenumber of 1 195 cm-1is the stretching vibration peak of quinone nitrogen atom; the absorption peak at a wavenumber of 1 364 cm-1is a C-N stretching vibration peak; the absorption peak at a wavenumber of 1 517 cm-1is a skeleton vibration of a benzene ring;the absorption peak at a wavenumber of 1 617 cm-1is a skeleton vibration of a quinone ring[20,21].
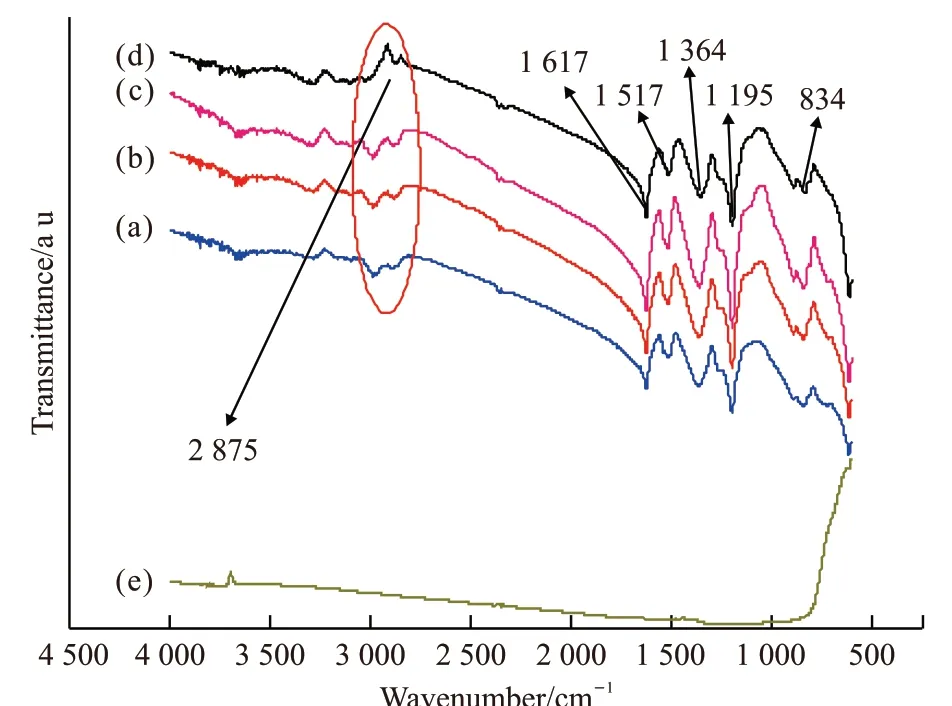
Fig.4 Infrared spectra of polyaniline and PANI / MgTiO3 composite: PANI / MgTiO3 (61/39 (w / w)); (b) PANI /MgTiO3 (82/18 (w / w)); (c) PANI / MgTiO3 (85/15 (w /w)); (d) Pure PANI;(e)MgTiO3
The position and intensity of the characteristic peaks of PANI/MgTiO3composite are slightly different. For example, the approximate position at 2 875 cm-1( the position circled by the ellipsein in Fig.4), has changed in the composite, which means that there is an influence and interaction between PANI and MgTiO3[22,23].
3.3 Thermal stability
From the TG curves of PNAI and PANI / MgTiO3composite (Fig.6) , it can be seen that both PANI and PANI /MgTiO3composites have two-stepweight loss processes in the temperature range of 0 to 800 ℃. The first-step weight loss is at about 100 ℃, which may be mainly caused by the loss of adsorbed moisture. The weight loss in the second step can clearly be seen in the range of 240 -320 ℃, which is mainly caused by the decomposition of the polymer chain[24,25].Initial decomposition temperature (Ti) is a criterion to indicate the thermal stability of the materials. The larger the value ofTi, the higher the thermal stability is.Tivalue of PANI and PANI / MgTiO3composite is shown in Table 1. It can be seen that the thermal stability of PANI / MgTiO3composite is greatly higher than that of the pure PANI and shows a tendency to first increase and then decrease with increasing MgTiO3amount.When the mass ratio of PANI to MgTiO3is 82 to 18, the thermal stability of the composite is the best.During the thermal decomposition,the contribution from the free PANI chains may be more greater because these free chains are more exposed to the heating when compared with the PANI chains constrained by MgTiO3.This proves that the interaction between MgTiO3and PANI strengthens with the increase of MgTiO3content and reduces the amount of the free PANI chains in the composites. From the DTG curves of PNAI and PANI / MgTiO3composite (Fig.5) , it can be seen that for the pure PANI, there are multi-minima peaks corresponding to the second-step mass loss of the TG curve. For the composites, there is one minimum with a small shoulder peak, which indicates that the molecular mass of PANI in the composite distributes more evenly than that of the pure PANI.

Table 1 Initial decomposition temperature (Ti) of PANI and PANI / MgTiO3 composite
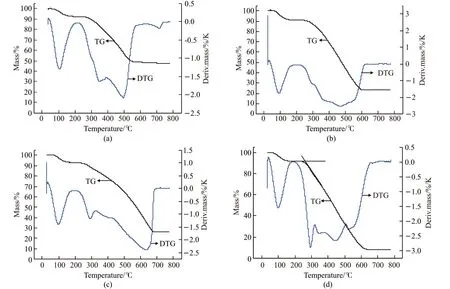
Fig.5 TG-DTG curve of polyaniline and PANI / MgTiO3 composite: (a) PANI / MgTiO3 (61/39 (w / w)); (b) PANI / MgTiO3 (82/18 (w / w));(c) PANI / MgTiO3 (85/15 (w / w)); (d) PANI
3.4 Electrochemical properties
Fig.6 is the CV curves of PANI and PANI /MgTiO3composite at a voltage window of -0.2 - 0.8 V and a voltage sweep speed of 10 mV / s. The curves show that two pairs of redox peaks,corresponding to the intermediate oxidation state and intermediate reduction state,have good symmetry, which mean that the oxidation-reduction reaction of PANI in HClO4medium has good electrochemical reversibility. Comparing the area of the CV curve, the specific capacitance of the PANI / MgTiO3composite electrode with a mass ratio of 82/18 (w/w) (curve b)is larger than that of PANI,which means the capacitance performance of PANI can be enhanced when appropriate amount of MgTiO3is added.
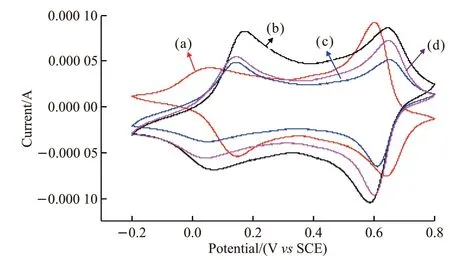
Fig.6 CV curve of PANI and PANI / MgTiO3 composite: (a)PANI / MgTiO3 (61/39 (w / w)); (b) PANI / MgTiO3 (82/18(w / w)); (c) PANI / MgTiO3 (85/15 (w / w)); (d) PANI
The electrochemical impedance spectrum(EIS) characteristics of electrode materials are very important electrochemical properties. The Nyquist curve consists of a semicircle in the high frequency region and a straight line in the low frequency region.It is generally believed that the impedance spectrum in the high frequency region reflects the electrochemical control of charge transfer. In the process, the diameter of the semi-circular arc reflects the charge transfer resistance (Rct) caused by the charge transfer reaction,and the size of the arc can reflect the resistance of the reaction. The low-frequency region is controlled by the diffusion process, and the ions in the electrolyte are at the electrode interface. Diffusion leads to the Warburg impedance (Zw), and theZwrepresents the impedance of charge migration within the active material. When the straight line slope in the low frequency region is larger,that is, itsZwis smaller, the rate of charge diffusion from the electrolyte solution into the active material is faster. As can be seen from Fig.7, the diameter of the semicircle of PANI / MgTiO3composite in the high frequency region is smaller than that of PANI,indicating that theRctof the composites is smaller than that of PANI and the charge transfer rate inside the composites is greater than PANI. Also in the low frequency region, it can be seen that theZwof PANI/ MgTiO3composite is smaller than that of PANI,which means that the diffusion rate of the charge from the electrolyte solution into the active material in the medium has been greatly improved[26-28].The migration and diffusion rate of the charge, for the PANI / MgTiO3composite with a mass ratio of 82/18 (w/w)(curve b), is the fastest,which means the impedance performance of PANI can be enhanced when the appropriate amount of MgTiO3is added.
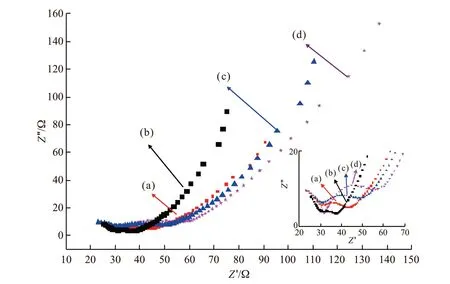
Fig.7 Niquist plots of PANI and PANI / MgTiO3 composite:(a) PANI / MgTiO3 (61/39 (w / w)); (b) PANI / MgTiO3 (82/18 (w / w)); (c) PANI/ MgTiO3 (85/15 (w / w)); (d) PANI
Fig.8 shows the charge / discharge curves of PANI and PANI / MgTiO3composites. The voltage window for testing charge and discharge is 0.05 - 0.4 V and the current density is 0.5A / g. The charge and discharge curve of the composites is similar to a symmetrical triangle, showing a better capacitance properties. The charge and discharge time corresponds to the specific capacitance of the material[29]. We can clearly see that under the same active material load, the charge and discharge time of the PANI / MgTiO3composite with a mass ratio of 82/18 (w/w)(curve b) is the longest, and the capacitor performance is the best, which is superior to PANI. It can be concluded that when an appropriate amount of MgTiO3is added to PANI, the diffusion rate of protons can be enhanced and the capacitance value of the PANI material can be increased.
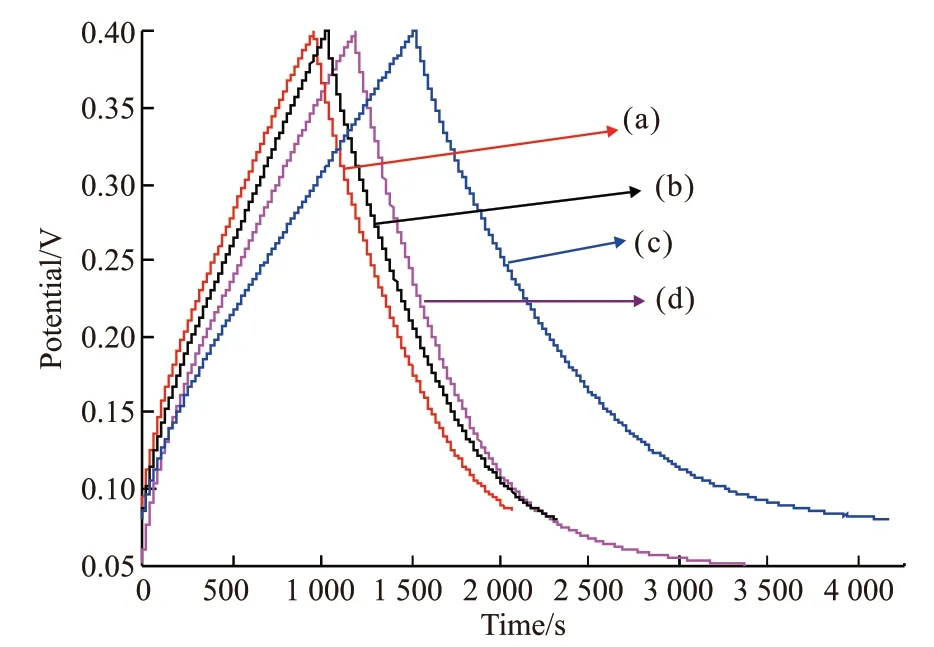
Fig.8 Charge / discharge curves of PANI and PANI / MgTiO3 composite: (a) PANI / MgTiO3 (61/39 (w / w)); (b) PANI/ MgTiO3 (82/18 (w / w)); (c) PANI / MgTiO3 (85/15 (w /w)); (d) PANI
The above three types of electrochemical experiments have all proved that there is a synergistic effect between PANI and MgTiO3, which improves the electrochemical performance of the PANI.
4 Conclusions
PANI/ MgTiO3composites were prepared byinsitucomposite method. The structure and morphologe of materials have been examined by FTIR, XRD and SEM , and the results show that there is a synergistic effect between PANI chains and MgTiO3, which improves the performances of the PANI when appropriate amount of MgTiO3is added.TG-DTG analysis and electrochemical experiments all show that the thermal stability and electrochemical properties of the PANI / MgTiO3composite with a mass ratio of 82/18 (w/w) are the best.Due to the excellent electrochemical properties of PANI composites, it is expected to be used as a material for supercapacitor electrodes in the future.
杂志排行
Journal of Wuhan University of Technology(Materials Science Edition)的其它文章
- Mechanical Properties and Microstructure of Al2O3/SiC Composite Ceramics for Solar Heat Absorber
- Effect of Friction Stir Welding on Bulk Metallic Glasses
- Effects of Lay-up Types of Out-of-autoclave Prepregs on Preparation Quality of L-shape Composite Laminates
- Hypereutectic Al-Si Matrix Composites Prepared by In Situ Fe2O3/Al System
- Preparation of Heavyweight Ultra-high Performance Concrete Using Barite Sand and Titanium-rich Heavy Slag Sand
- Effects of Shale and CaO Incorporation on Mechanical Properties and Autogenous Deformation of Early-age Concrete
