Effects of Temperature,Salinity,and Fluid Type on Acoustic Characteristics of Turbulent Flow Around Circular Cylinder
2021-09-10SertaBulutSelmaErgin
Sertaç Bulut·Selma Ergin
Abstract The effects of the temperature,salinity,and fluid type on the acoustic characteristics of turbulent flow around a circular cylinder were numerically investigated for the Reynolds numbers of 2.25×10⁴, 4.5×10⁴, and 9.0×10⁴. Various hybrid methods—Reynolds-averaged Navier-Stokes(RANS)with the Ffowcs Williams and Hawkings(FWH)model,detached-eddy simulation(DES) with FWH, and large-eddy simulation with FWH—were used for the acoustic analyses, and their performances were evaluated by comparing the predicted results with the experimental data.The DES-FWH hybrid method was found to be suitable for the aero-and hydro-acoustic analysis.The hydro-acoustic measurements were performed in a silent circulation channel for the Reynolds number of 2.25×10⁴.The results showed that the fluid temperature caused an increase in the overall sound pressure levels(OASPLs)and the maximum sound pressure levels(SPLT)for the air medium;however,it caused a decrease for the water medium. The salinity had smaller effects on the OASPL and SPLT compared to the temperature. Moreover, the main peak frequency increased with the air temperature but decreased with the water temperature,and it was nearly constant with the change in the salinity ratio.The SPLT and OASPL for the water medium were quite higher than those for the air medium.
Keywords Hydro-andaero-acoustics .Computationalacoustics .Acousticmeasurement .Flownoise .Hybridacousticmethods .Temperature effect .Salinity effect
1 Introduction
The requirements for reduced noise levels in engineering applications have become increasingly demanding,with great limitations on aero-and hydro-systems.Health and comfort problems,environmental noise pollution,and the negative impacts on marine mammals are some of the critical issues resulting from high noise levels.A further understanding of the nature and origins of acoustic phenomena is necessary to propose applicable solutions for reducing and controlling the noise levels.
The investigation of the fluid properties affecting the acoustic characteristics has great importance for aero-and hydro-acoustics,due to the wide range of applications in many engineering fields.Particularly,the seawater properties have a crucial impact on underwater acoustic communication systems (Zaibi et al.2009). These systems are commonly used in many open-sea applications for offshore exploration,pollution monitoring,surveillance systems,oceanographic research,assisted navigation,military purposes, and mining prospecting. Unmanned underwater vehicles are also equipped with underwater acoustic sensors(Akyildiz et al.2005;Imran et al.2017;Sendra et al.2016).The physical characteristics of ocean and seawater such as temperature and salinity significantly affect the underwater wireless communication network and acoustic signal characteristics(Awan et al.2019).The temperature and salinity of water have various effects on the properties of the acoustic communication channels(Sehgal et al.2009).It is necessary to understand the effects of these properties to obtain optimal capacity and efficiency.Furthermore,the air temperature significantly affects the aerodynamic and aero-acoustic fields of turbulent jets.Jet noise has become one of the most important fields of research due to its effects on aircraft overall noise characteristics.However,it is quite a challenging problem in aero-acoustics because of the insufficient understanding of noise generation mechanisms.Some studies(e.g.,Tanna et al.1975;Bodony and Lele 2005;Bridges 2006; Bogey and Marsden 2013; Benderskiy and Lyubimov 2014;Kuo et al.2015)have been performed to evaluate the effects of the fluid temperature on the aerodynamic and acoustic fields of turbulent jets.This paper presents a comprehensive investigation of the effects of temperature,salinity,and fluid type on the aero- and hydro-acoustic characteristics of turbulent flow around a circular cylinder.The study provides a new perspective on the understanding of the phenomena for the concerned application areas.
The flow noise around a cylinder is an important problem to understand the mechanisms of dynamic noise,as it consists of the fluid forces, pressure distribution, wake interference,flow separation,and turbulence characteristics.It occurs in a wide variety of engineering applications,including civil engineering (cables in bridges, fences, and transmission lines),transportation system engineering(aircraft landing gears and train pantograph), and marine engineering (risers, pipelines,and the hard tank of the offshore platforms). However, the noise produced by a viscous flow over a cylinder is difficult to calculate at moderate and high Reynolds numbers because of its extremely complicated structure. Flow separation as a result of adverse pressure gradient and the shedding of vortices through the interaction between both separated shear layers are some of the important aspects concerning the flow field around a cylinder. In addition, the computation of the flow noise has several challenges due to the complex physics of noise production and propagation and the presence of multiple sources,dispersion,and dissipation.There is a large disparity in energy and length scales between the acoustic and flow fields. Large distances are necessary to examine the acoustic wave propagation. Both aspects make unfeasible the direct solution of the Navier-Stokes equations(direct numerical simulation) for computational acoustics, except for limited applications such as 2-D cases or elementary configurations (for example, see Ianniello and De Bernardis 2015;Mahato et al.2018;Dawi and Akkermans 2018;Ganta et al.2019).Hybrid methods,which allow separating the fluid dynamic problem from the acoustic one,are regarded as an alternative. The flow field can be simulated by employing a turbulence model, while the acoustic solver can use any of the acoustic analogies. The first comprehensive study in the computational acoustic field was known as the Lighthill analogy.The main idea of this analogy was that the fundamental conservation laws of mass and momentum were rearranged into an inhomogeneous wave equation (Lighthill 1952).Proudman (1952) derived approximate analytical formulas based on the Lighthill analogy for the estimation of acoustic sound intensity. Curle (1955) extended the analogy for the presence of a stationary body in the flow field.Subsequently,Williams and Hawkings(1969)derived a more comprehensive formulation by considering the body in motion. For the acoustic analysis of the fluid-body interactions,this formulation provides a physically consistent wavepropagation model. Brentner and Farassat (2003) evaluated the Ffowcs Williams and Hawkings(FWH) equation for the modeling of aerodynamically generated sound of rotors by comparing the Kirchhoff formulation.Farassat’s formulations 1 and 1A were developed as an efficient way to solve the FWH equation with the surface sources when objects move at subsonic speeds(Farassat and Succi 1983;Farassat 2007).The hydrodynamics and noise behavior of marine propellers have been investigated through FWH equations under various operational conditions (Ianniello and De Bernardis 2015;Ianniello 2016; Bagheri et al. 2017; Testa et al. 2018). By employing a noise prediction code based on formulation 1A,Cox et al.(1997)examined the sound pressure levels(SPLs)generated by the flow over a circular cylinder. Choi et al.(2016) performed acoustic analysis to estimate the turbulence-induced noise of a submerged cylinder by comparing the FWH method without quadrupole sources and the permeable FWH method with quadrupole sources.Cianferra et al. (2018) analyzed the hydro-acoustic fields of three elementary geometries (sphere, cube, and prolate spheroid)through numerical simulations coupling large-eddy simulation (LES) and FWH. Cianferra et al. (2019) assessed the accuracies of the different numerical methodologies to solve the FWH equation and predict the noise generated by a finitesize square cylinder immersed in uniform flow. Zhang et al.(2019) evaluated the noise from the flow around a circular cylinder by using LES and FWH on solid and porous surfaces.
There is limited experimental research on the hydroacoustic characteristics of submerged bodies. In contrast,aero-acoustic measurements have been adequately performed in the literature.For example,Revell et al.(1978)conducted aero-acoustic measurements on a cylinder to determine the relationship between Mach number, Reynolds number, and SPLs. Lockard et al. (2007) experimentally investigated the radiated noise by tandem cylinders in air medium and concluded that the downstream cylinder dominated the noise radiation. Hutcheson and Brooks (2012) performed aeroacoustic experiments to examine the effect of Reynolds number,surface roughness,freestream turbulence,proximity,and wake interference on the radiated noise for single and multiple rod configurations.Liu et al. (2011)conducted experimental research on the underwater radiated noise of a submarine by evaluating the double-peak phenomenon. Bosschers et al.(2013) experimentally investigated the noise levels of the towing carriage in the depressurized wave basin. A silent towing carriage has been developed for measuring surface ship flow noise.Choi et al.(2017)developed the formulation Q1As considering quadrupole sources and performed hydroacoustic measurements to estimate noise levels around a submerged cylinder.
Bulut and Ergin(2018)performed a numerical investigation on the acoustic characteristics of the circular cylinder.The study was based on the low-precision Reynolds-averaged Navier-Stokes(RANS)model and k-omega with FWH in the simulations.The study extended the previous work of Bulut and Ergin(2018)by expanding the temperature and salinity ranges,presenting new hydro-acoustic experimental data,and using more sophisticated turbulence modeling techniques: detached-eddy simulation (DES) and LES. Furthermore, the studies on the effects of temperature on acoustic characteristics remain restricted to the aero-acoustic field, especially jet noise. Studies on the effects of temperature and salinity on hydro-acoustic characteristics are lacking.Also,there is a lack of comparative evaluation of acoustic characteristics for water and air, which are the most commonly used media in which a wide range of sensitive systems operate.
The current study aims to comprehensively investigate the effects of the temperature,salinity,and fluid type on the aeroand hydro-acoustic characteristics. The ranges of temperature and salinity ratios are determined by considering the properties of the oceans and seas and their usage in engineering applications.The effects of the temperature on the acoustic properties were examined within the range of 10°C to 50°C for water and air.The effects of the salinity contributions between 10-g salt per kilogram of seawater (g/kg)and 70-g salt per kilogram of seawater (g/kg) were evaluated for water. In addition, the acoustic characteristics obtained by water and air media were compared on the frequency spectrum.Various hybrid models were reviewed in terms of their performance on the predictions of turbulent flow and acoustic characteristics. The results of hybrid methods(RANS with FWH,DES with FWH,and LES with FWH)were compared with the experimental data from the literature and this study.Considering the simulation cost of result accuracy,the hybrid method DES-FWH was chosen as an appropriate method for the analyses.
The results show that the effects of the temperature increase on the acoustic characteristics are completely different for air and water media. The main peak frequency, fT, shifted to a lower value with an increase in the air temperature, while it increased with an increase in the water temperature.Interestingly, the main peak frequency was nearly independent of the salinity ratio.The main characteristics of the overall sound pressure level (OASPL) and the maximum SPLTincreased with the air temperature but decreased with the increase in the water temperature.The increase in these characteristics with the salinity was relatively small.The shape of the acoustic spectrum significantly changed with the fluid type.The main peak frequency within the air medium was higher than that within the water medium. The SPLTand OASPL values for water and air media at the same Reynolds numbers were found to be quite different.
2 Theoretical Background for Flow and Acoustic Analyses
2.1 Turbulence Modeling
The RANS,DES,and LES models were used for the modeling of flow structures and turbulence distribution in this study.The RANS models include the realizable two-layer k-epsilon model(Jones and Launder 1972)and the shear stress transport(SST)k-omega model (Menter 1993). The DES variant of the improved delayed DES (IDDES), which combines the SST komega model in boundary layers with LES in unsteady separated regions and the LES model, which uses the dynamic Smagorinsky subgrid-scale model to simulate small-scale motions,is chosen for the flow analyses.
Reynolds averaging and filtering processes are two common ways to turn the Navier-Stokes equations into a resolvable form so that the direct simulation of the small-scale turbulent structures can be avoided.Reynolds averaging is defined as the decomposition of any of the flow variables into a mean value
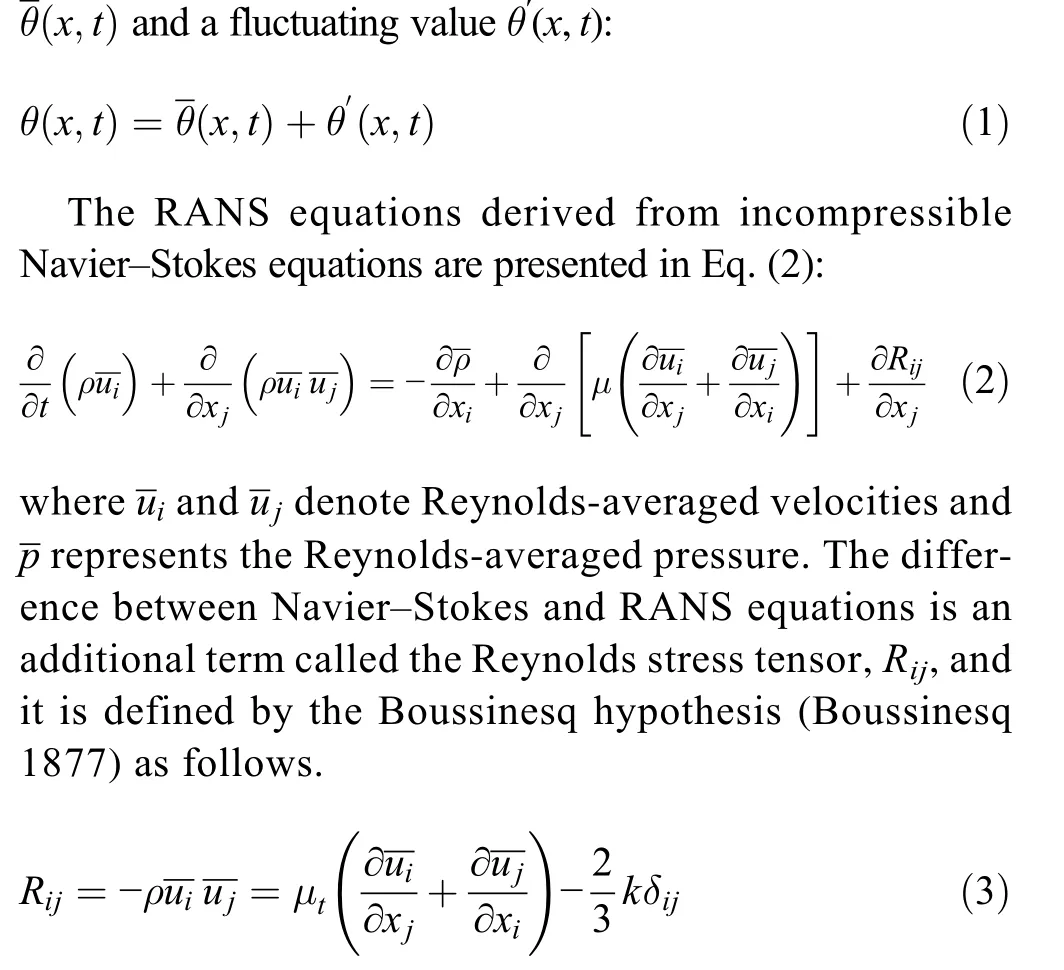
The RANS models of k-epsilon and k-omega turbulence models based on the Boussinesq hypothesis determine the eddy (turbulent) viscosity, μt, differently. The k-epsilon model uses the turbulent kinetic energy k and the turbulent dissipation rate ε to determine the eddy viscosity,while k-omega considers the turbulent kinetic energy k and the specific dissipation rate ω. The realizable twolayer k-epsilon model combines the realizable k-epsilon model with the two-layer approach. In the two-layer approach, turbulent kinetic energy k is solved across the entire flow domain, while the turbulent dissipation rate ε and eddy (turbulent) viscosity μtare defined as functions of the wall distance in the layer next to the wall. The procedure of the realizable k-epsilon model allows defining certain mathematical constraints on the normal stresses in accordance with the physics of turbulence(realizability). The SST k-omega model is a twoequation model; it includes a blending function combining a k-omega model near the wall with a k-epsilon model in the far field. The model also has a new definition of eddy viscosity, which considers the effect of the transport of the principal turbulent shear stress.


The filtered equation of LES for incompressible Navier-Stokes equations is as follows:

The DES is a hybrid approach that employs unsteady RANS models in near-wall regions and the LES model in regions away from the near-wall (Spalart et al. 1997). The IDDES variant of the DES makes it possible for RANS to be used in a much thinner near-wall field and presents wallmodeled LES capabilities.The applied RANS and LES length scales are combined with blending functions.The characteristic length scale of the wall-modeled LES branch of IDDES(lDDES)is described as follows:

2.2 FWH Model
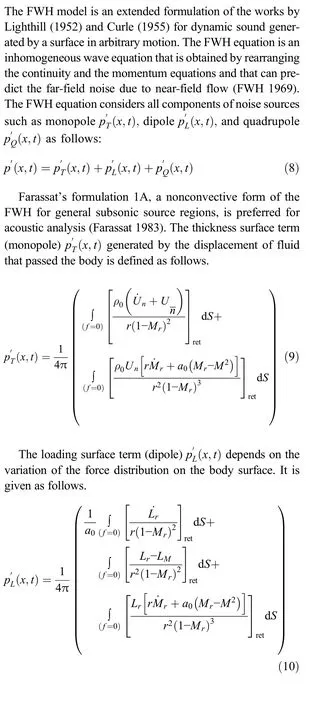
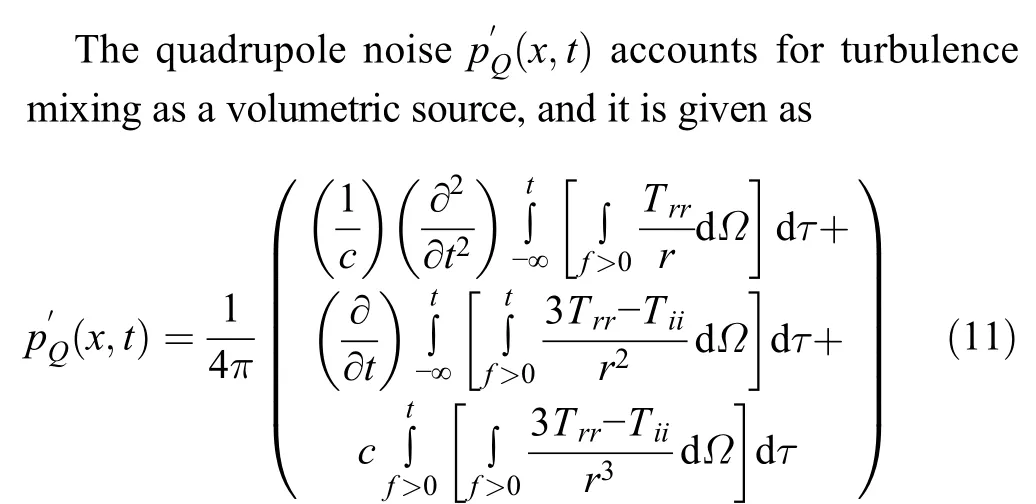
where U represents the fluid velocity;Liand Trrare the blade load vector and the Lighthill stress tensor,respectively;ρ0is the far-field density;r is the distance from a source point to the observer;and Mris the Mach number of the source toward the observer.The subscript ret indicates retarded time,and a dot above a variable defines the derivative with respect to source time for that variable.Moreover,f=0 denotes a mathematical surface to embed the exterior flow problem (f >0) in an unbounded space.The quadrupole source is assessed as a“collapsing-sphere” formulation (Eqs. 11 and 12) in which the space derivatives are transformed into time derivatives(Brentner and Farassat 1998).

3 Experimental Setup and Procedure
Hydro-acoustic experiments were performed in a silent circulation tunnel at the Ata Nutku Ship Model Testing Laboratory,Istanbul Technical University. A circular cylinder diameter and span length of D=0.02 m and L=30.0D,respectively,were used in the experiments.The size of the circulation channel was L = 6 m, W = 1.75 m, and H = 1 m. The cylinder spanned the entire test section,with the size of W=1.35 m and H = 0.85 m. The measurements were performed for the Reynolds number of 2.25×10⁴.
The acoustic measurements were recorded using a Bruel&Kjær(B&K)8104 hydrophone fixed to the streamlined strut.A specific mechanism was designed to locate the hydrophone in different underwater positions.The form of the mechanism was modeled based on a design used in the flow noise measurements in the literature to generate minimum noise levels(Felli 2006; Pereira et al. 2016). The cylinder was also installed in the test section by taking preventative measures for the silent underwater medium.The hydrophone was located at a distance of 5 diameters downward and 25 diameters behind the cylinder center for the recordings of the noise measurements. The hydrophone position was determined such that the depth-dependent effects near the water surface and interference effects close to the bottom surface were avoided(de Jong et al.2011).The data obtained from the hydrophone were analyzed by the B&K 3560-B-049 analyzer during the postprocessing phase.The measurement accuracy was±1 dB for the hydro-acoustic experiments.The schematic diagram of the experimental rig used to perform acoustic experiments is shown in Figure 1.
The background noise consisted of the mechanical noise from the pump and other mechanisms in the cavitation tunnel.The noise tests showed that the noise levels generated by the flow around the circular cylinder were distinguishable from the background noise.Figure 2 displays the test section with the circular cylinder and the hydrophone mechanism.
4 Numerical Procedure
The realizable two-layer k-epsilon, SST k-omega, IDDES,and LES models were used to model the turbulent flow structures around the circular cylinder in the fluid dynamics analyses.Farassat’s 1A integral formulation of the FWH equation with quadrupole sources was implemented for the acoustic simulations.The numerical analyses were performed for three Reynolds numbers: 2.25×10⁴, 4.5×10⁴, and 9.0×10⁴. All flow and acoustic simulations were performed through the computer software STAR-CCM+ v12.04.011 double precision by Siemens.
The computational domain was 29.2D (diameter) long in the streamwise x-direction.The inlet and exit boundaries were placed at 8.6D and 20.6D from the cylinder axis,respectively.The positions of the top and bottom boundaries were at 10.3D from the cylinder axis(Lehmkuhl et al.2014).The spanwise length was determined as 2.5D to resolve any spanwise flow structure of a large length scale(Patankar and Spalding 1972).Using a fine mesh structure is necessary to obtain timeaccurate data on the near-field flow,since the data are utilized as input for the determination of the noise sources in the FWH equation.It is also important for the accurate prediction of the boundary layer and to satisfy the requirements for turbulence models. Therefore, the grid independence study was performed to provide the best suitable mesh structures required for the flow analyses.The block-structured hexahedral grids with a total of 5.4,10.3,and 14.2 million cells were used for RANS,DES,and LES models,respectively.The grid refinement was performed around the cylinder wall and within the cylinder wake, especially. A spatial mesh resolution of Δy+≈1 was used by considering the grid resolution requirements of the near-wall region.Figure 3 shows the details of the mesh structure around the cylinder surface and within the computational domain.
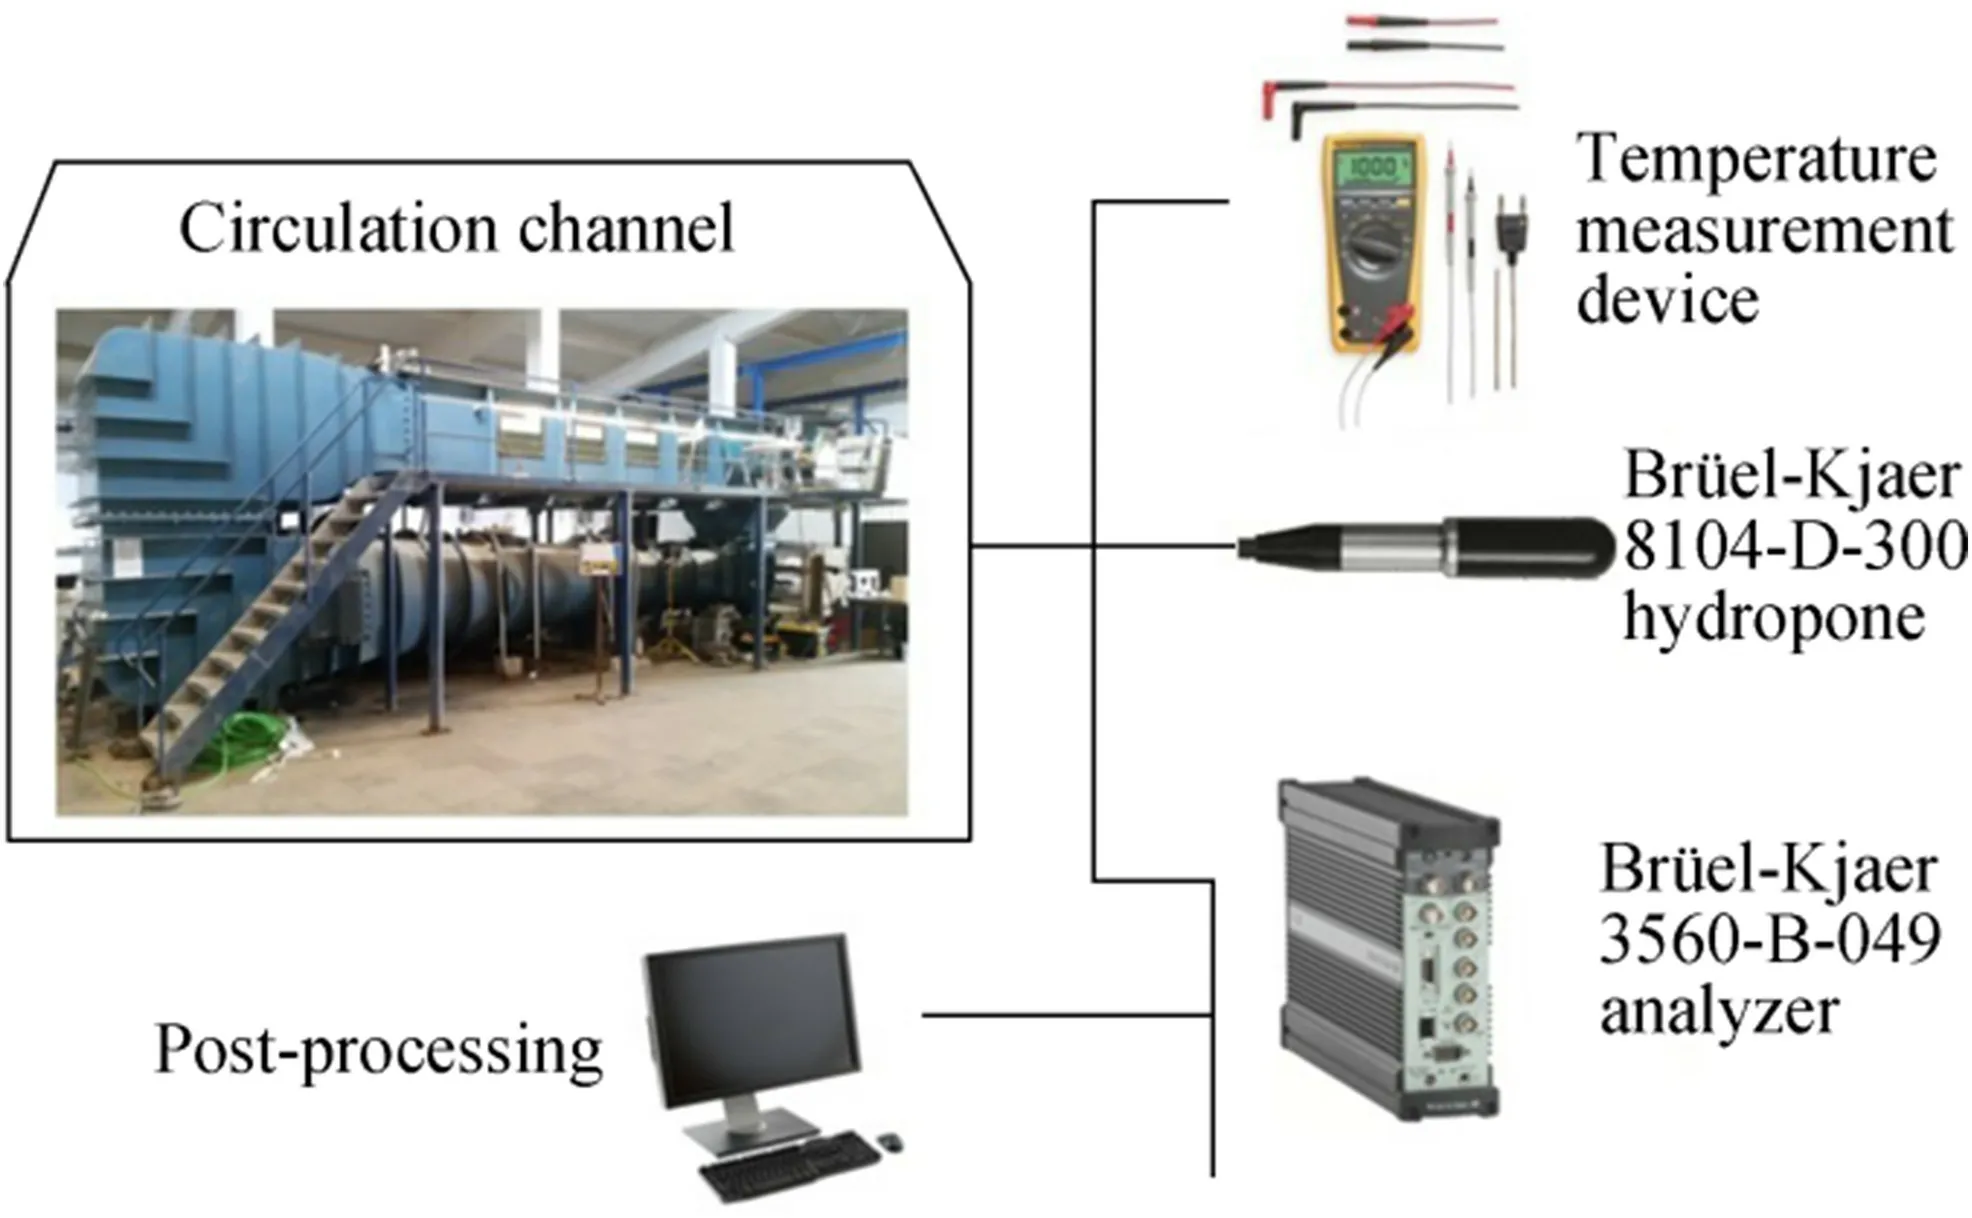
Figure 1 Schematic diagram of experimental rig
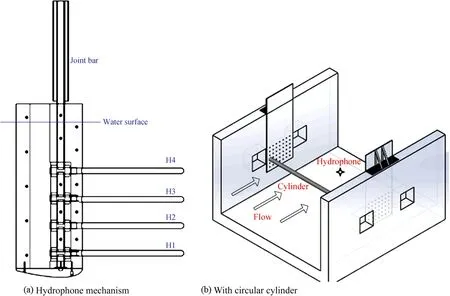
Figure 2 Test section of experimental rig
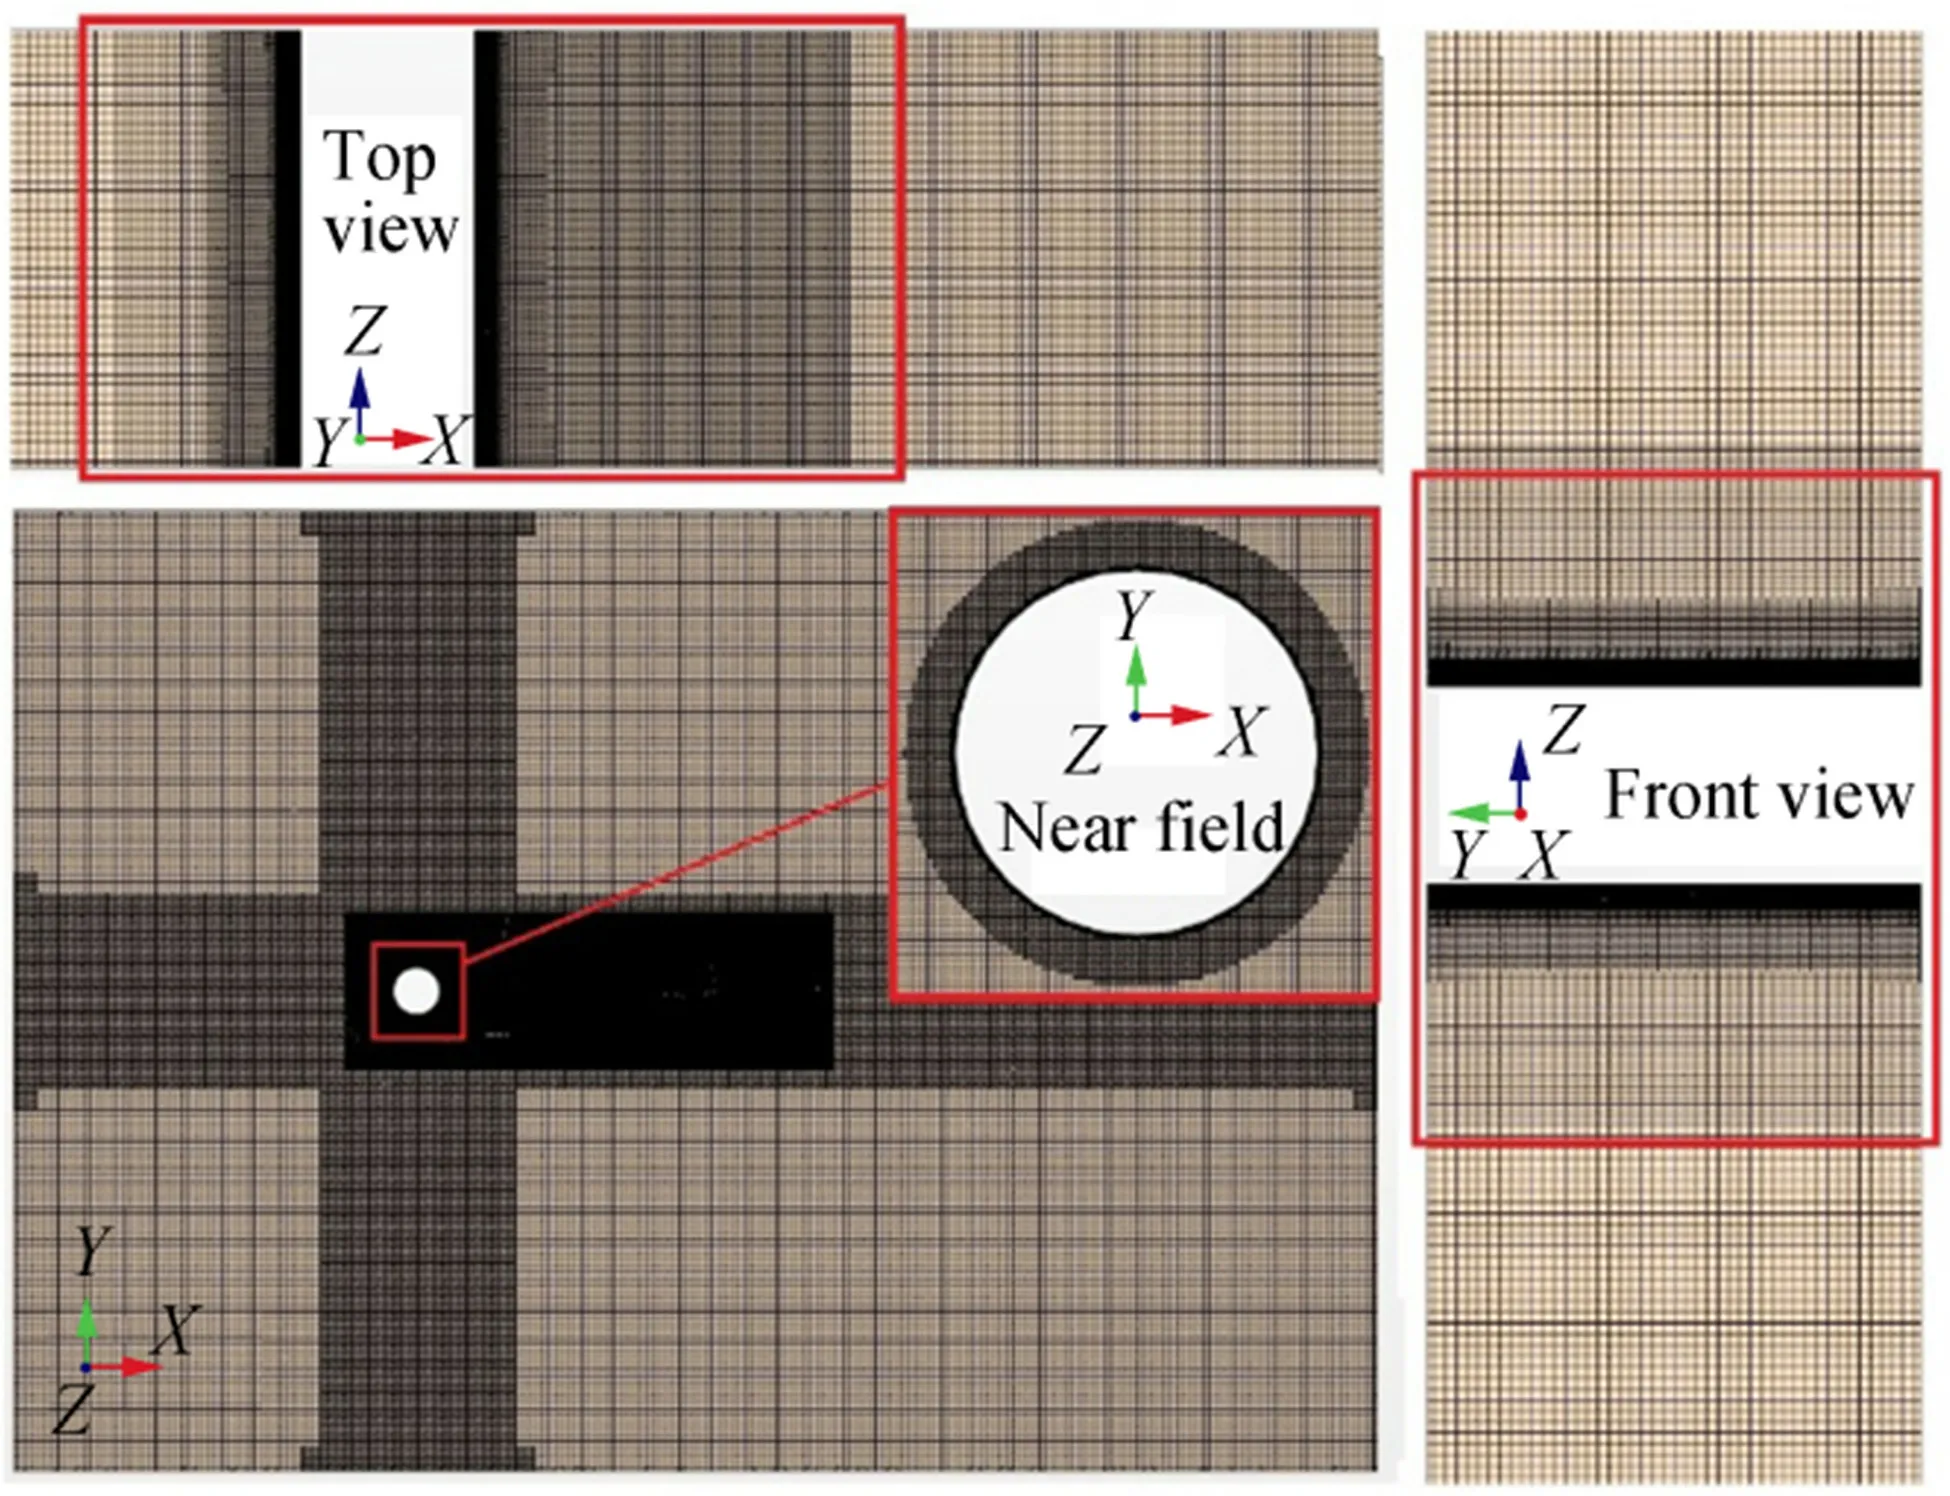
Figure 3 Various views of computational grid
The time step of Δt=2×10⁻⁵s and 20 substeps were adopted to ensure a Courant-Friedrichs-Lewy number of less than 1 in all cells of the domain,so that the calculation converges within each time step.For each numerical simulation,approximately 18 000 time steps were considered.It took nearly 3 weeks to complete each numerical case using all existing processor cores in a DELL Precision T7810 workstation with two Intel Xeon E5-2640v4 processors and 160-GB DDR4 RAM.
A spanwise periodicity condition was specified for the two lateral boundaries.A constant freestream pressure and a constant freestream velocity without any turbulence velocity components were applied for the inlet and exit boundaries,respectively.All the numerical calculations of the continuity and momentum were performed using the finite volume method. This method transforms the mathematical model into a system of algebraic equations by discretizing the governing equations in space and time.The algebraic multigrid methods were used to solve the resulting linear equations. The SIMPLE algorithm was employed for pressure velocity coupling for different Reynolds numbers(Travin et al. 2000). Bounded-central differencing (BCD) was used as the discretization scheme for RANS and LES models,while hybrid-BCD was utilized for the DES model.The hybrid-BCD scheme blends second-order upwind and BCD.The convective terms are discretized by the second-order upwind scheme,while the second-order time-discretization together with an implicit scheme is used for the time integration.
The effects of the temperature on acoustic properties were investigated within the range of 10-50°C for the water and air media.The effects of the salinity between 10 and 70 g/kg were evaluated for the water medium.Four receiver points(R1,R2,R3, and R4) used for the acoustic analysis were positioned perpendicular to the flow direction and downward of the cylinder at distances of 5D,10D,15D,and 20D away from the cylinder center.Unsteady pressure fluctuations data obtained from receivers were transformed from the time domain to the frequency domain using the fast-Fourier transform functions.The reference sound pressure was considered as 1.0×10⁻⁶Pa for the water and 2.0×10⁻⁵Pa for the air. The Hann(Hanning)function was used as the window function.
5 Results of Computational Fluid Dynamics Modeling and Comparisons with Experiments

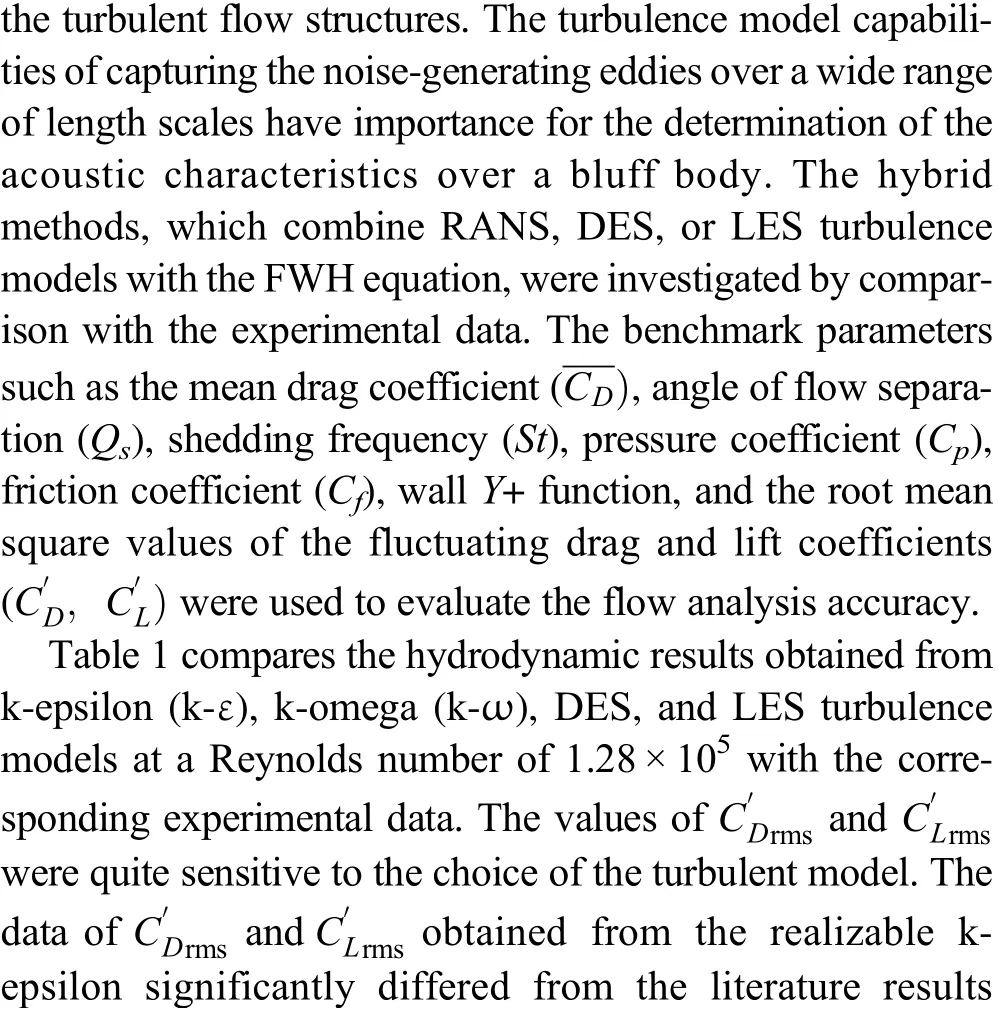
(West and Apelt 1993; Cantwell and Coles 1983),whereas DES and LES matched well with the earlier findings. Each turbulence model presented reasonable results in terms of the mean drag coefficient, within the experimental data range.
The azimuthal distributions of Cpand the dimensionless form of Cfover the cylinder surface are presented for all turbulence models in Figure 4.From Figure 4 and Table 1,the flow separation angles(θs) determined by the DES and LES models show satisfactory agreement with those reported by Travin et al.(2000),with a 2.0%-6.0%difference.
The vortex shedding is the main sound-generation mechanism related to the pressure fluctuations on the cylinder surface. The shedding frequencies obtained by DES and LES,which corresponds to the Strouhal number St = 0.19 and 0.18,respectively,appear to be well supported by the reported values in the literature,with a 0.5%-5.0%difference(Norberg 2003;Bearman 1969;Park 2012).
Figure 5 shows the three-dimensional flow structures based on the Q-Criterion in the cylinder wake for the Reynolds number of 1.28×10⁵. The laminar region in the front of the cylinder and the turbulent oscillating wake in the rear can be seen in detail for each turbulence model. As shown in the figure,the LES and DES turbulence models captured the vortices behind the cylinder better than the RANS models.
Figure 6 compares the mean pressure and skin-friction coefficients along the cylinder surface obtained by DES with the experimental data at a Reynolds number of 9.0×10⁴(Cantwell and Coles 1983; Achenbach 1968). The surface pressure distribution obtained by the DES mostly matched well with the measured values for the region around the cylinder surface. The flow separation angle was determined by DES as 85°,which agrees with the experimental data of 82°.The error percentages between the DES simulations and experiments (Cantwell and Coles 1983; Achenbach 1968) are presented in Table 2. In general, the pressure and mean dimensionless skin-friction coefficients were well predicted byDES;however,they were overpredicted after the flow separation.At the separation angle of 82°,the error percentages for the pressure and skin-friction coefficients were 11.58% and 5.71%,respectively.
Table 1 Comparisons of flow quantities of θs,St,,and for Re=1.28×10⁵
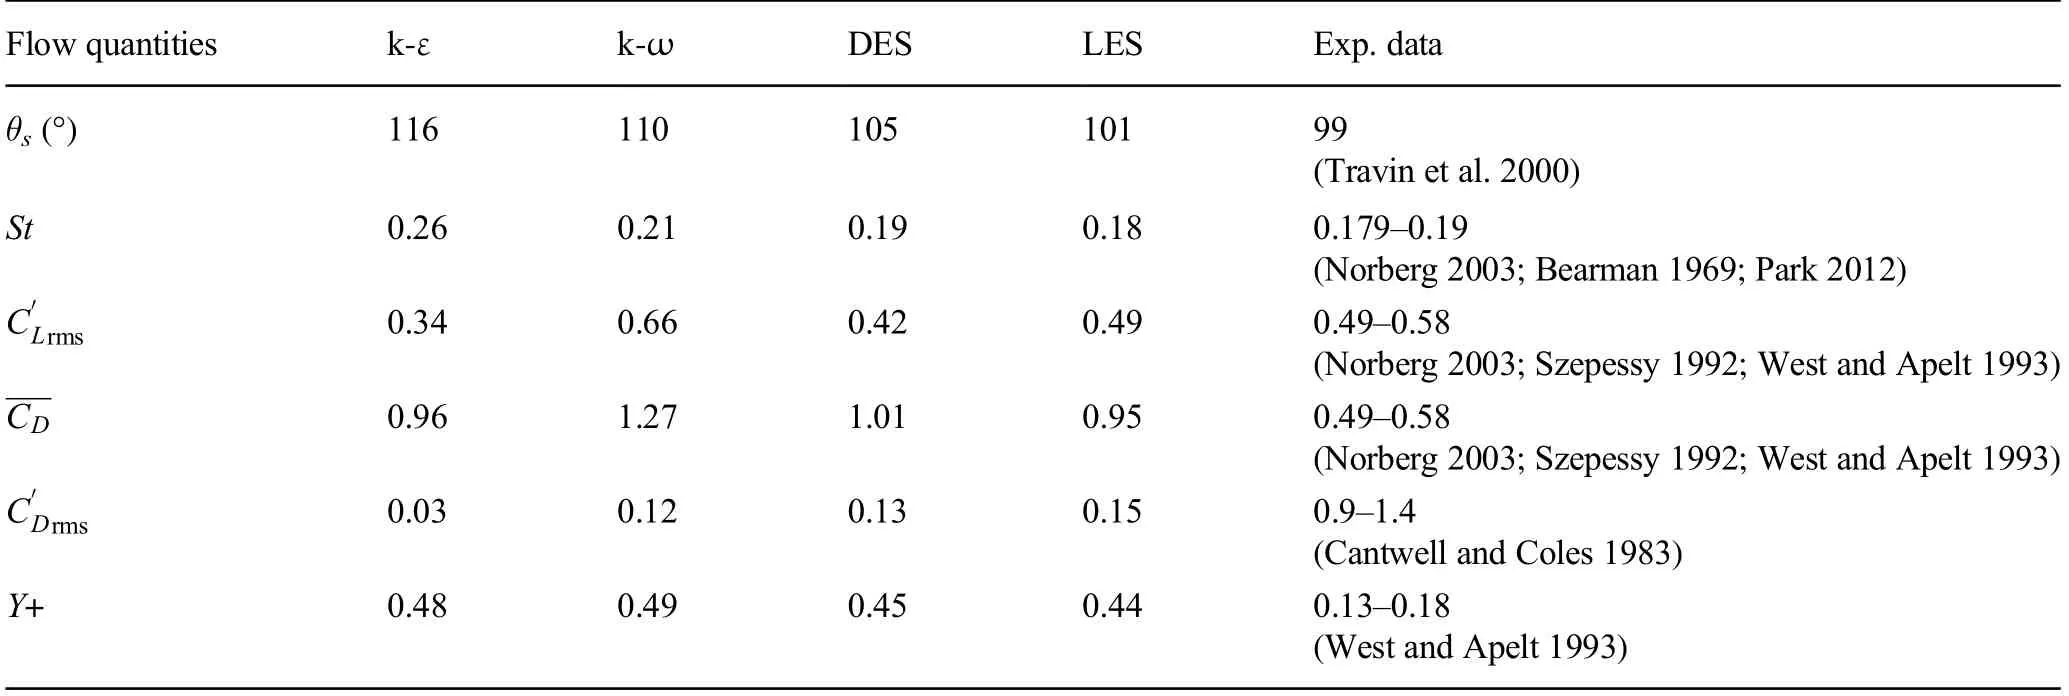
Table 1 Comparisons of flow quantities of θs,St,,and for Re=1.28×10⁵
Flow quantities k-ε k-ω DES LES Exp.data θs(°) 116 110 105 101 99(Travin et al.2000)St 0.26 0.21 0.19 0.18 0.179-0.19(Norberg 2003;Bearman 1969;Park 2012)C′Lrms 0.34 0.66 0.42 0.49 0.49-0.58(Norberg 2003;Szepessy 1992;West and Apelt 1993)CD 0.96 1.27 1.01 0.95 0.49-0.58(Norberg 2003;Szepessy 1992;West and Apelt 1993)C′Drms 0.03 0.12 0.13 0.15 0.9-1.4(Cantwell and Coles 1983)Y+ 0.48 0.49 0.45 0.44 0.13-0.18(West and Apelt 1993)
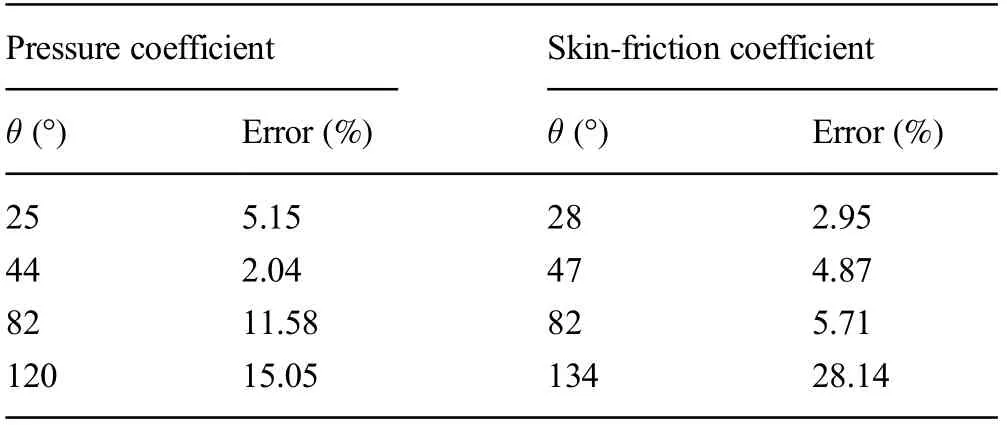
Table 2 Error percentages between DES results and experimental data by Cantwell and Coles(1983)and Achenbach(1968)
The details of the flow path behind the cylinder for the Reynolds number of 9.0×10⁴are presented in Figure 7 using streamlines.The separation points and vortices in the streamline plot are shown in this plot.

Figure 4 Azimuthal distributions of pressure and skin-friction coefficients for Re=1.28×10⁵ (a) Mean pressure coefficient (b) Mean dimensionless skin-friction coefficient
The accuracy of the turbulence models was evaluated by comparing the benchmark parameters with the literature findings.The DES and LES models enabled a reliable prediction of turbulent fluctuations for fluid dynamics analyses and gave better agreement than RANS models. The DES model was also evaluated to determine flow parameters for aerodynamic simulations, and it showed reasonable agreement with the corresponding experimental data.
6 Results of Acoustic Analyses and Comparisons with Experiments
In this study,the hybrid methods of k-omega with FWH,DES with FWH,and LES with FWH were investigated to evaluate their prediction capacities of hydro-acoustic characteristics by comparing their results with the measurements.Farassat’s 1A formulation of the FWH equation with quadrupole sources was used to determine acoustic characteristics in the analyses.Hydro-acoustic analyses and measurements were performed for the Reynolds number of 2.25×10⁴. The hydrophone was located at a distance of 5 diameters downward and 25 diameters behind the cylinder center for the analyses and measurements.The background noise levels were measured with unsteady flow through the empty test section for the Reynolds number used in the experiments.The frequencies of the anechoic part of the test chamber were below 600 Hz, and the noise levels generated by the flow around the circular cylinder were distinguishable from the background noise.
The acoustic results were evaluated in terms of the SPL in the decibel scale (dB). The SPL (dB) can be defined as follows:

where Pedenotes the effective sound pressure and Prefis defined as the reference pressure,which was taken as 1 μPa in water and 20 μPa in air. The OASPL was obtained by summing the contributions of all acoustic spectrum results,as given in the following expression:

The spanwise dimension of the model used in numerical simulations was 2.5D, which was 1/12 of the experimental model.Therefore,it is necessary to utilize a correction method to consider the effect of the longer span length used in the measurements. The Kato correction method (Kato et al.2007)was utilized to consider the additional sound level generated due to the longer span length of the cylinder.The correction formula is as follows:

where L,Ls,and Lcare the span length,simulation length,and correlation length, respectively. According to the study by Norberg (2003), the correlation length was Lc≈9D for the Reynolds number used in this acoustic analysis. This corresponds to an increase by 16 dB for the predicted SPLs.
Figure 8 presents the SPL spectra of the cylinder based on the frequency obtained by hybrid methodsand hydro-acoustic measurements. The comparisons with the measured spectra showed that the hybrid methods of DES-FWH and LES-FWH performed excellently to resolve the harmonics in the low-frequency region. These models well predicted the SPLT, as the values agreed well with the measurement results, while k-omega with the FWH model significantlyoverpredicted the SPLT. Especially, the slight difference of over 600 Hz was due to the effect of the background noise.

Figure 5 Flow structure view behind smooth cylinder for Re=1.28×10⁵(colored by pressure magnitude)
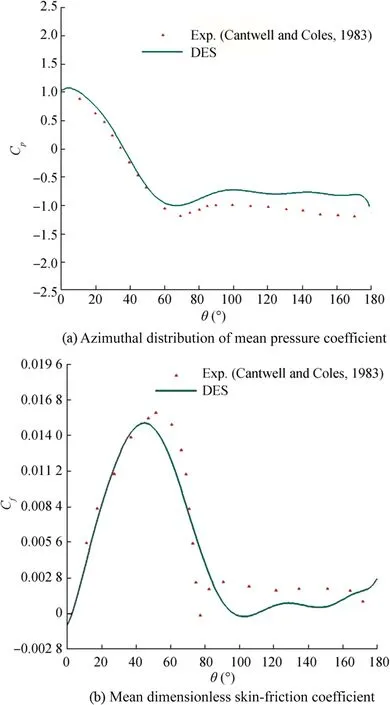
Figure 6 Azimuthal distribution of mean pressure coefficient and mean dimensionless skin-friction coefficient for Re=9.0×10⁴.(a)Azimuthal distribution of mean pressure coefficient (b) Mean dimensionless skinfriction coefficient
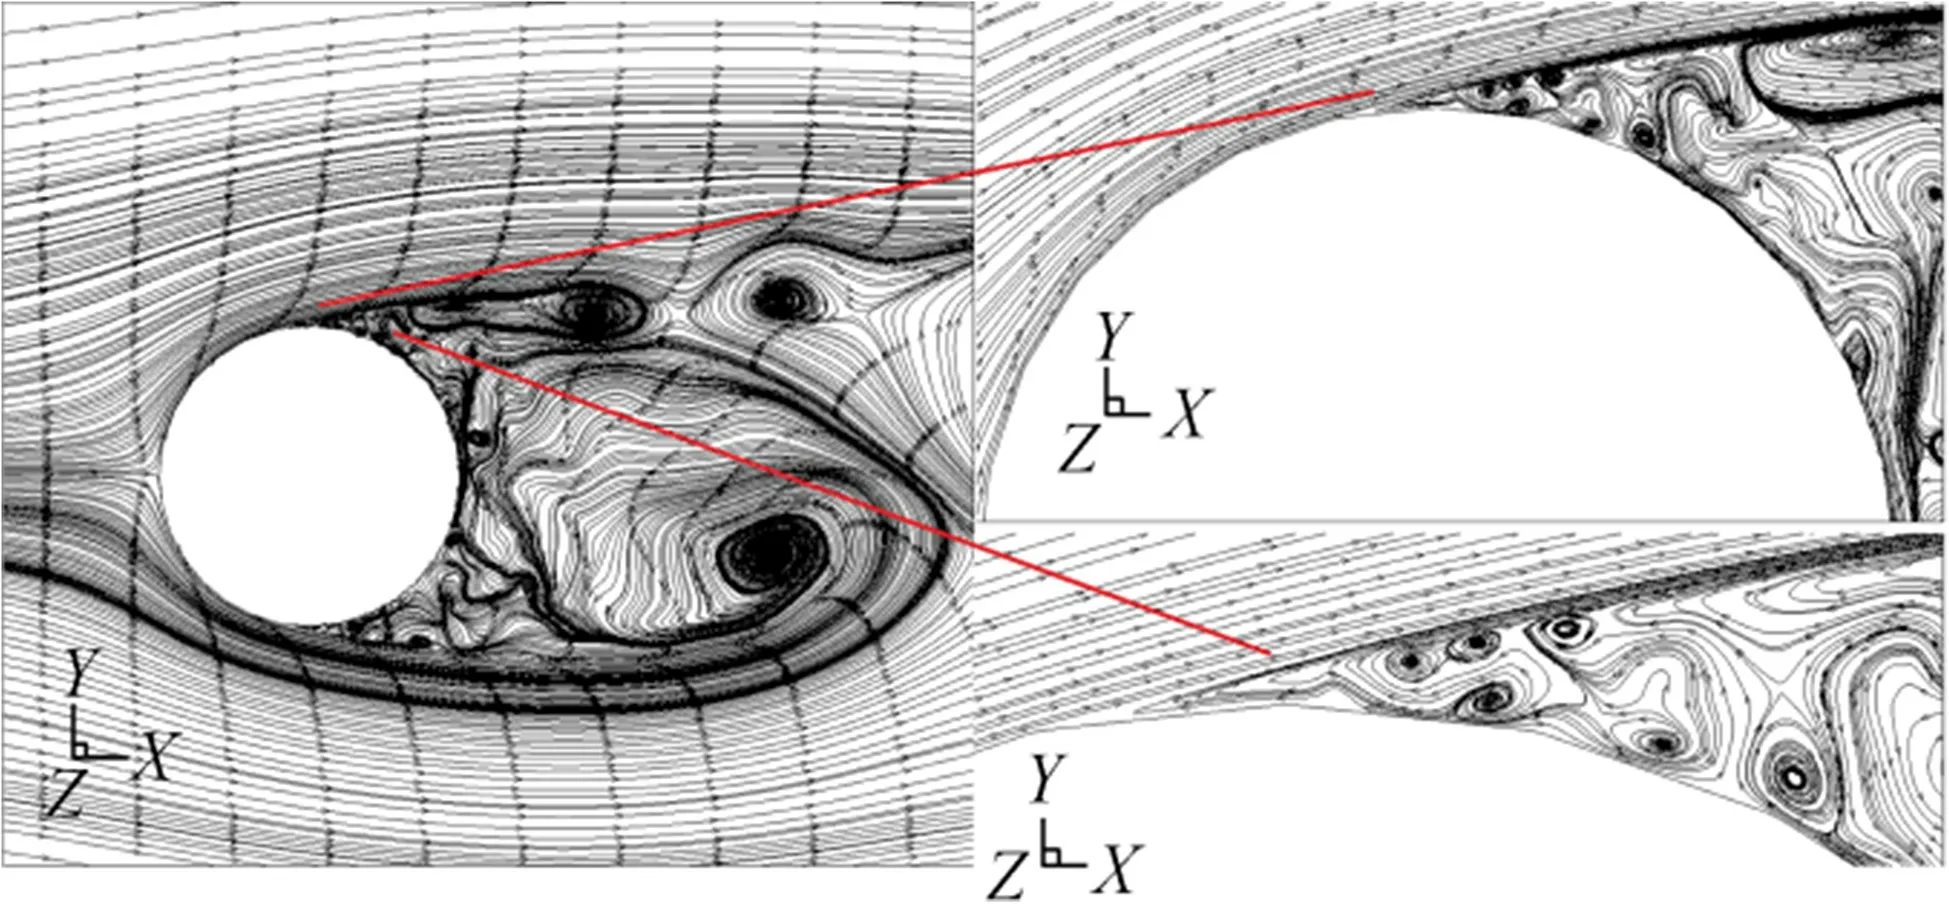
Figure 7 Streamline plot of the flow past circular cylinder for Re=9.0×10⁴
Table 3 presents the main characteristics of the SPL spectrum, namely, the main peak frequency (denoted by fT); the SPL at this frequency, that is, the maximum SPL (SPLTin dB);and the OASPL in dB. The DES-FWH and LES-FWH models provided the best predictions in terms of the maximum SPL, within about 2 dB of the spectra obtained directly from the hydrophone signals in measurements.Regarding the OASPL,the predictions of these models accurately matched with experimental values,while the LES-FWH model had a slightly better agreement than the DES-FWH for the main peak frequency.The omega-FWH model had difficulty in capturing both the maximum SPLs and broadband noise levels but exhibited reasonable performance for the vortex shedding frequency.

Table 3 Comparisons of computed acoustic data with experimental data
Regarding the fluid dynamics and acoustic analyses, the DES-FWH and LES-FWH models best agreed with the experimental data. As for the computational costs,the DESFWH model was more suitable for performing the acoustic analysis to investigate the effects of temperature,salinity ratio,and fluid type on the acoustic characteristics of the circular cylinder.
7 Results of the Effects of Temperature,Salinity,and Fluid Type on Acoustic Characteristics
The acoustic characteristics of the circular cylinder were numerically obtained by considering the effects of temperature,salinity ratio, and fluid type. The hybrid method DES-FWH was employed for the numerical simulations due to its capability for predicting the turbulent flow structures and the acoustic spectrum.The aero-and hydro-acoustic simulations were performed for the Reynolds numbers of 2.25×104,4.5×104,and 9.0×10⁴at four different receiver points.The effects of temperature, salinity ratio, and fluid type on the main acoustic characteristics were evaluated by considering the main acoustic characteristics, such as broadband noise,main peak frequency (fT), SPLT, and OASPL. The range of temperature and salinity ratios was determined by considering the properties of the oceans and seas and their usage in engineering applications. The effects of the temperature on the acoustic properties were investigated within the range of 10-50°C for the water and air media.The effects of the salinity between 10 and 70 g/kg were evaluated for the water medium.In addition,the acoustic characteristics obtained for water and air media were compared in terms of the frequency spectrum.
The acoustic spectra obtained for different water temperatures are displayed in Figure 9 for the Reynolds number of 9.0×10⁴. The spectral shape significantly changed with the increase in temperature. As the water temperature increased from 10 °C to 50 °C, the main peak frequency, at which the maximum SPLs were observed, decreased from about 68-22 Hz.The broadband noise(f >1 kHz)decreased with the increase in the water temperature. The maximum decrease of about 15 dB in the broadband noise occurred between the temperature values 30°C and 50°C.
Figure 10a presents the variations of the SPLTand the OASPL with the water temperature at Reynolds numbers of 2.25×104,4.5×104,and 9.0×10⁴.The dotted and solid lines represent the SPLTand OASPL,respectively.In general,the OASPL and SPLTvalues decreased with the increase in the water temperature. For example, when the temperature increased from 10°C to 50°C,the OASPL decreased from about 152.1 to 135.7 dB for the Reynolds number of 9.0×10⁴,and the SPLTfrom about 150.2 to 134.5 dB (Figure 10a). The variations of the OASPL and SPLTvalues with the receiver distance are presented in Figure 10b. When the receiver distance increased fourfold,from R1 to R4,the OASPL and SPLTvalues decreased by the maximum amount, about 23.5 and 23.6 dB,respectively.As shown in Figure 10b,the maximum decrease occurred at the air temperature of 50°C.
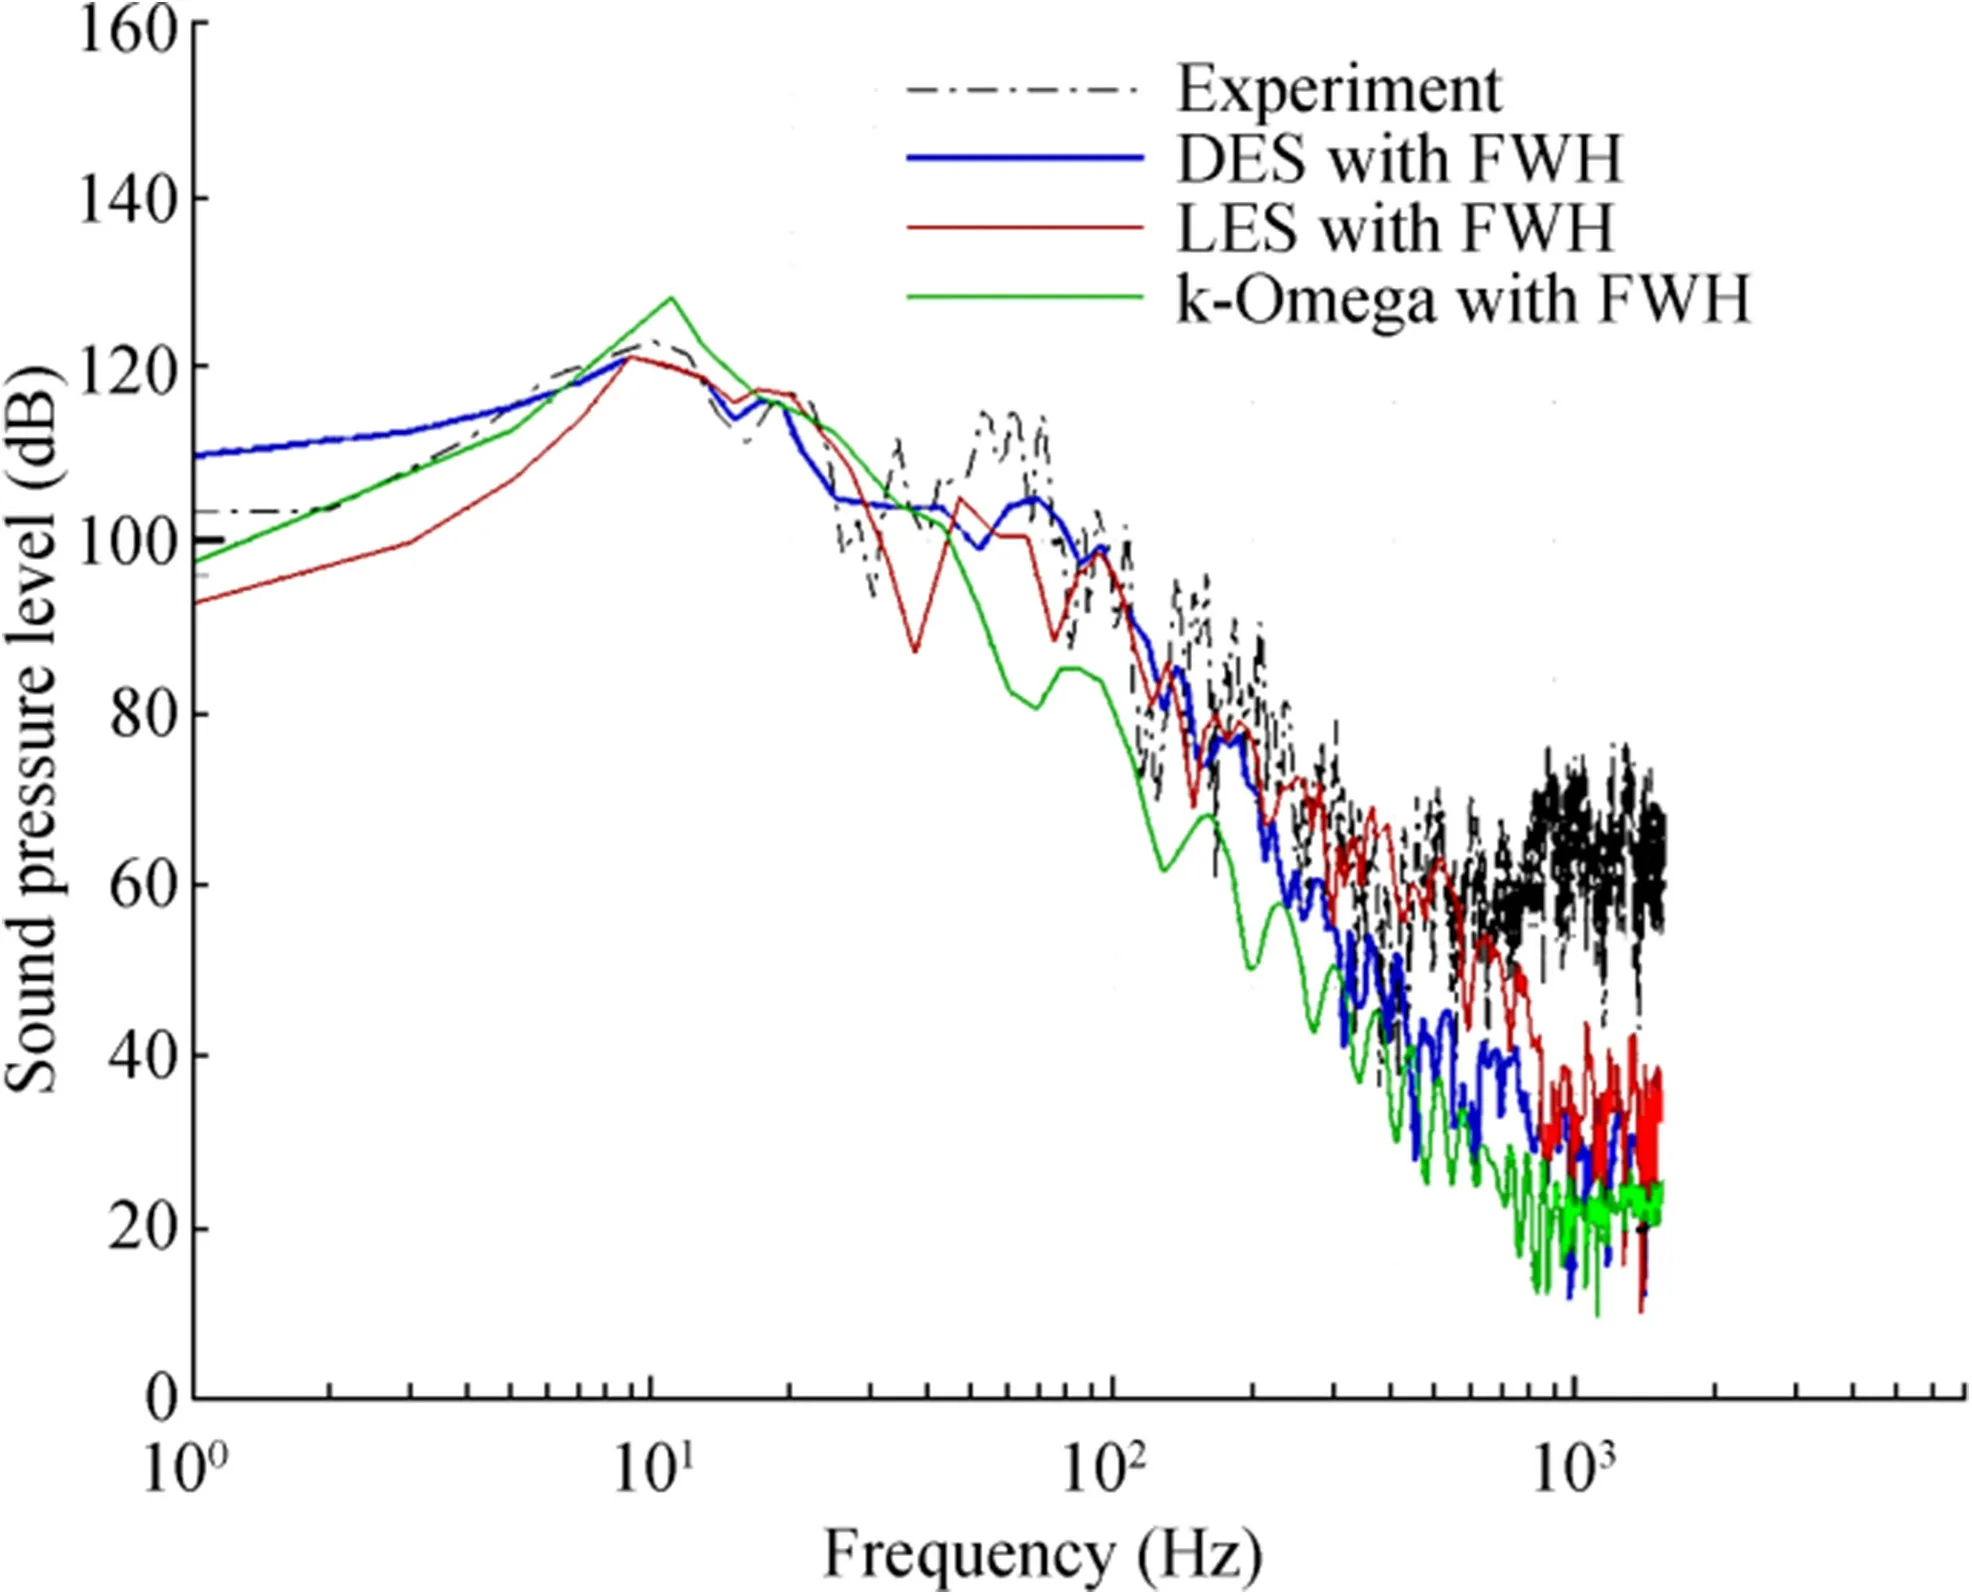
Figure 8 Comparisons of SPL spectra obtained from hybrid methods and experiments
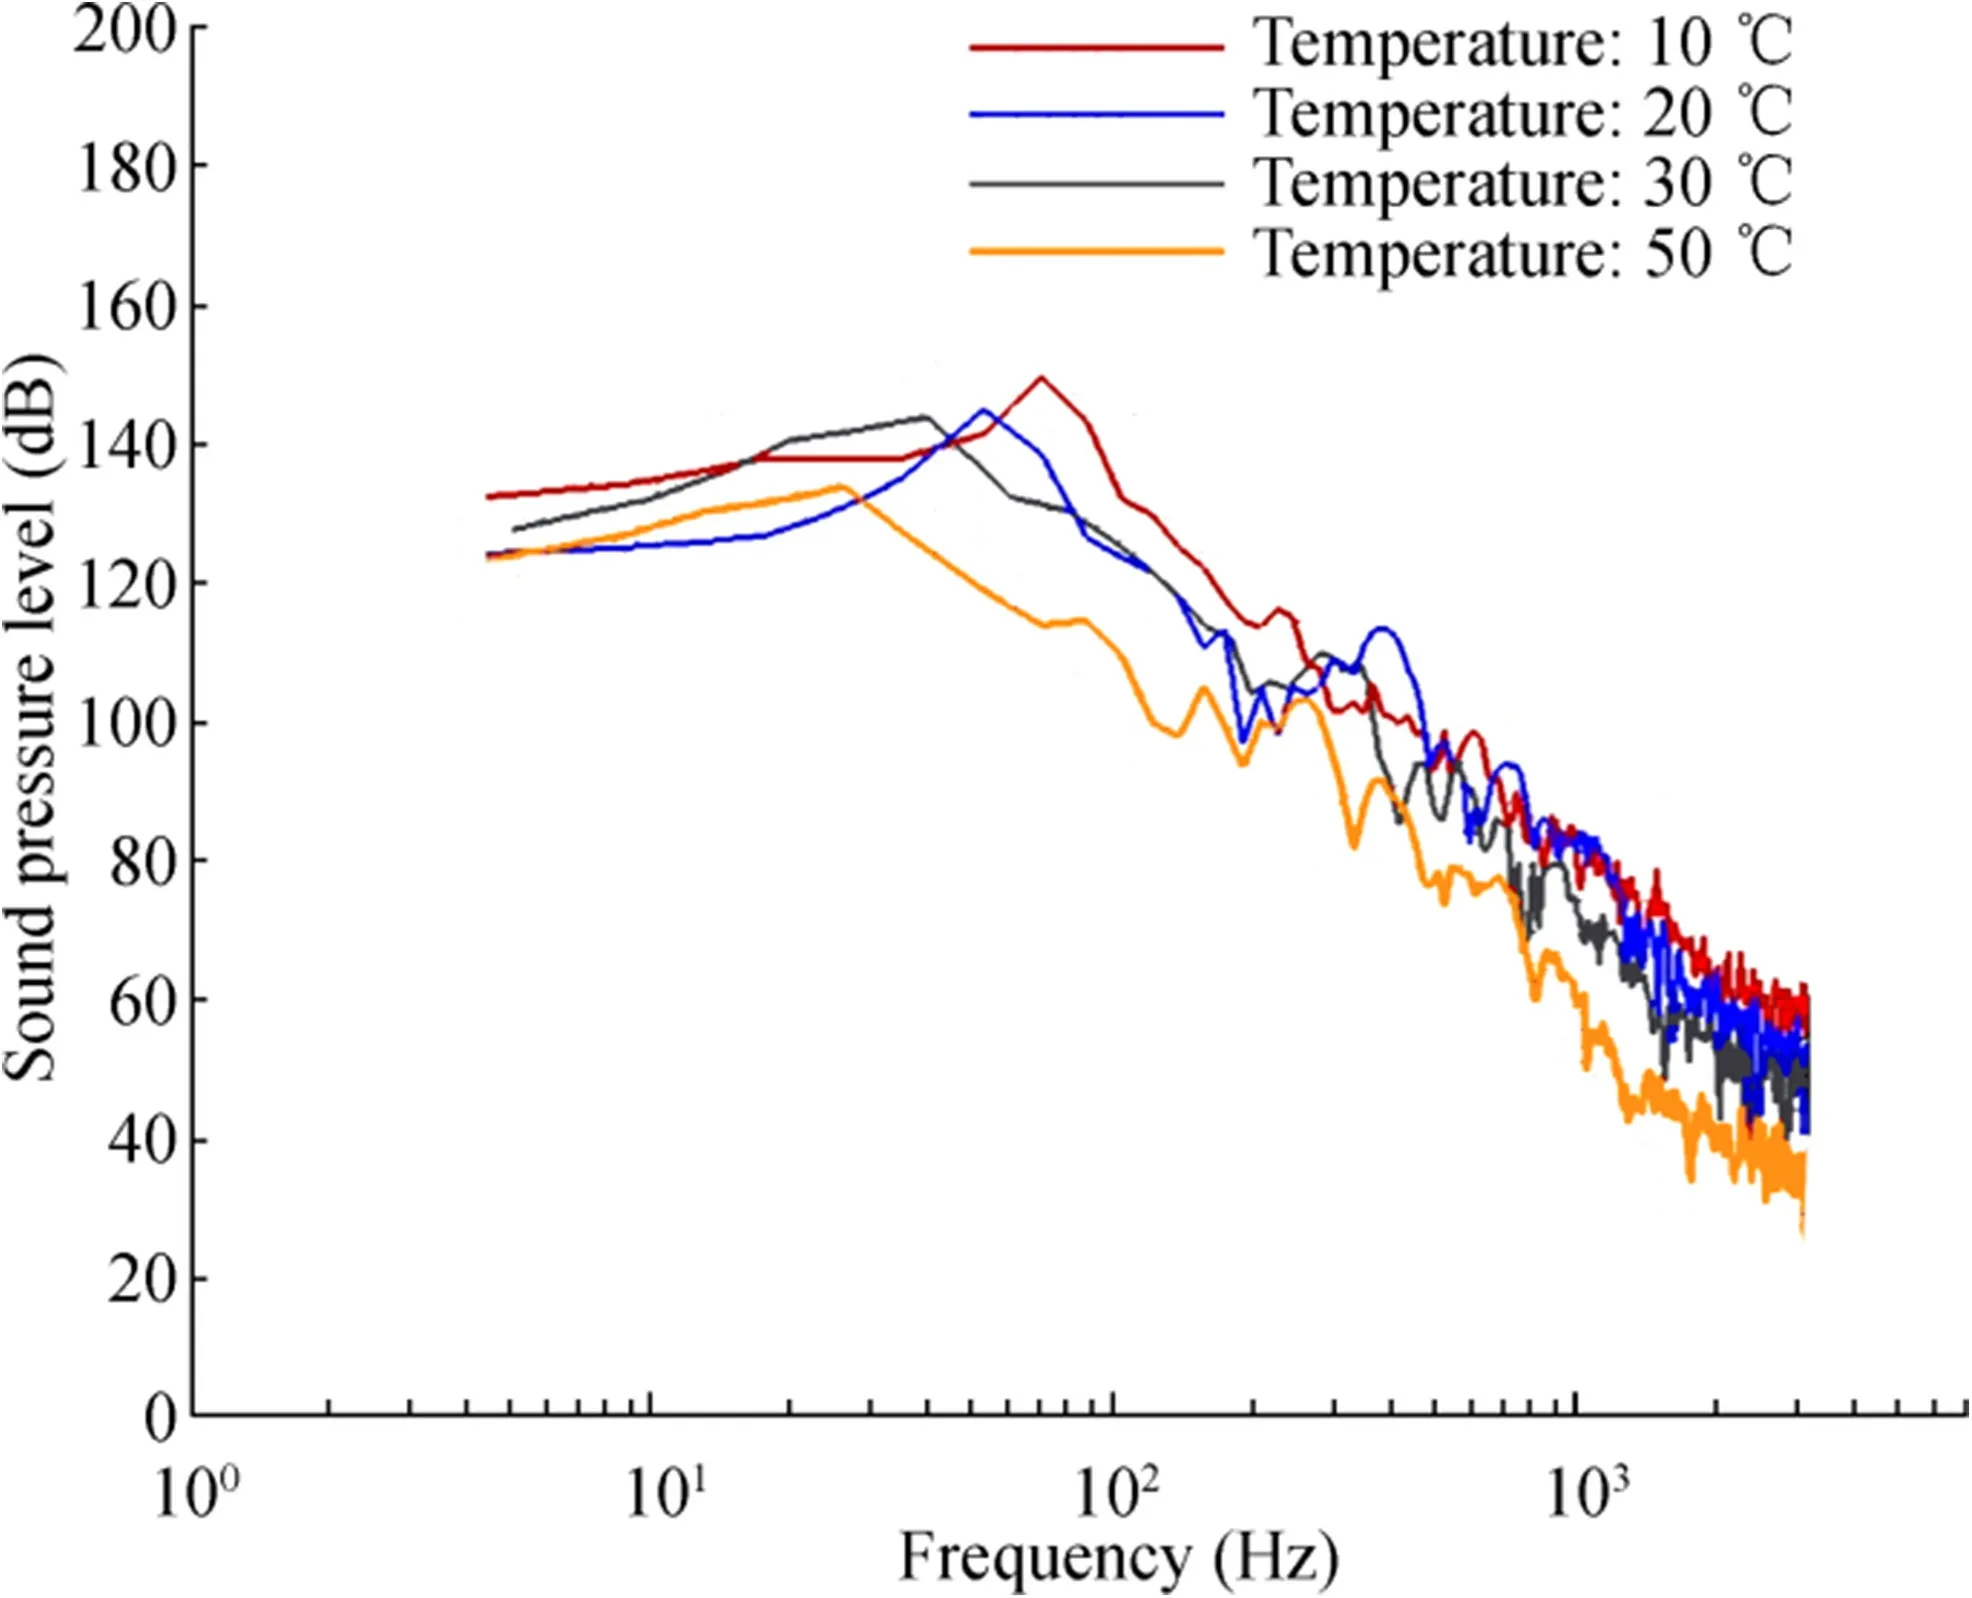
Figure 9 Comparisons of SPL spectra obtained for various water temperatures at receiver R1
The temperature effect on the viscosity of liquids is different from that for gases. The intermolecular forces of attraction are greater, and the molecules are less loosely packed in liquids than in gases. When the liquid is gaining heat, the energy level of molecules and the distance between them increase, which causes the intermolecular forces of attraction to weaken, and thus, the viscosity decreases. Viscous shear stress is the main source of the dipole noise (Hu et al. 2002; Shariff and Wang 2005). The wall shear is equal to the viscous shear at the wall for smooth walls (see, Eq. (16)), and the turbulence is almost totally damped. Therefore, molecular viscosity becomes the most important factor.Increasing the temperature from 10 °C to 50 °C resulted in a 57.7% reduction in the water viscosity. The noise level reduction at all Reynolds numbers was due to the viscosity reduction, which weakened the dipole source strength. Hence, a 1.3% decrease in the density with the increase in water temperature had a slight diminishing impact on the quadrupole source strength (Cocking 1974; Hoch and Duponchel 1973).

Figure 11 presents the variations of acoustic spectra with the air temperature for the Reynolds number of 9.0×10⁴.The increase in the fluid temperature affected the main peak frequency,fT;the effect in the air medium was different from that in the water medium.When the air temperature increased from 10°C to 50°C,the main peak frequency increased from about 664 to 968 Hz. The broadband noise (f >1 kHz) increased with an increase in the air temperature.There is a maximum increase of about 17 dB between the temperature values of 30 °C and 50 °C.
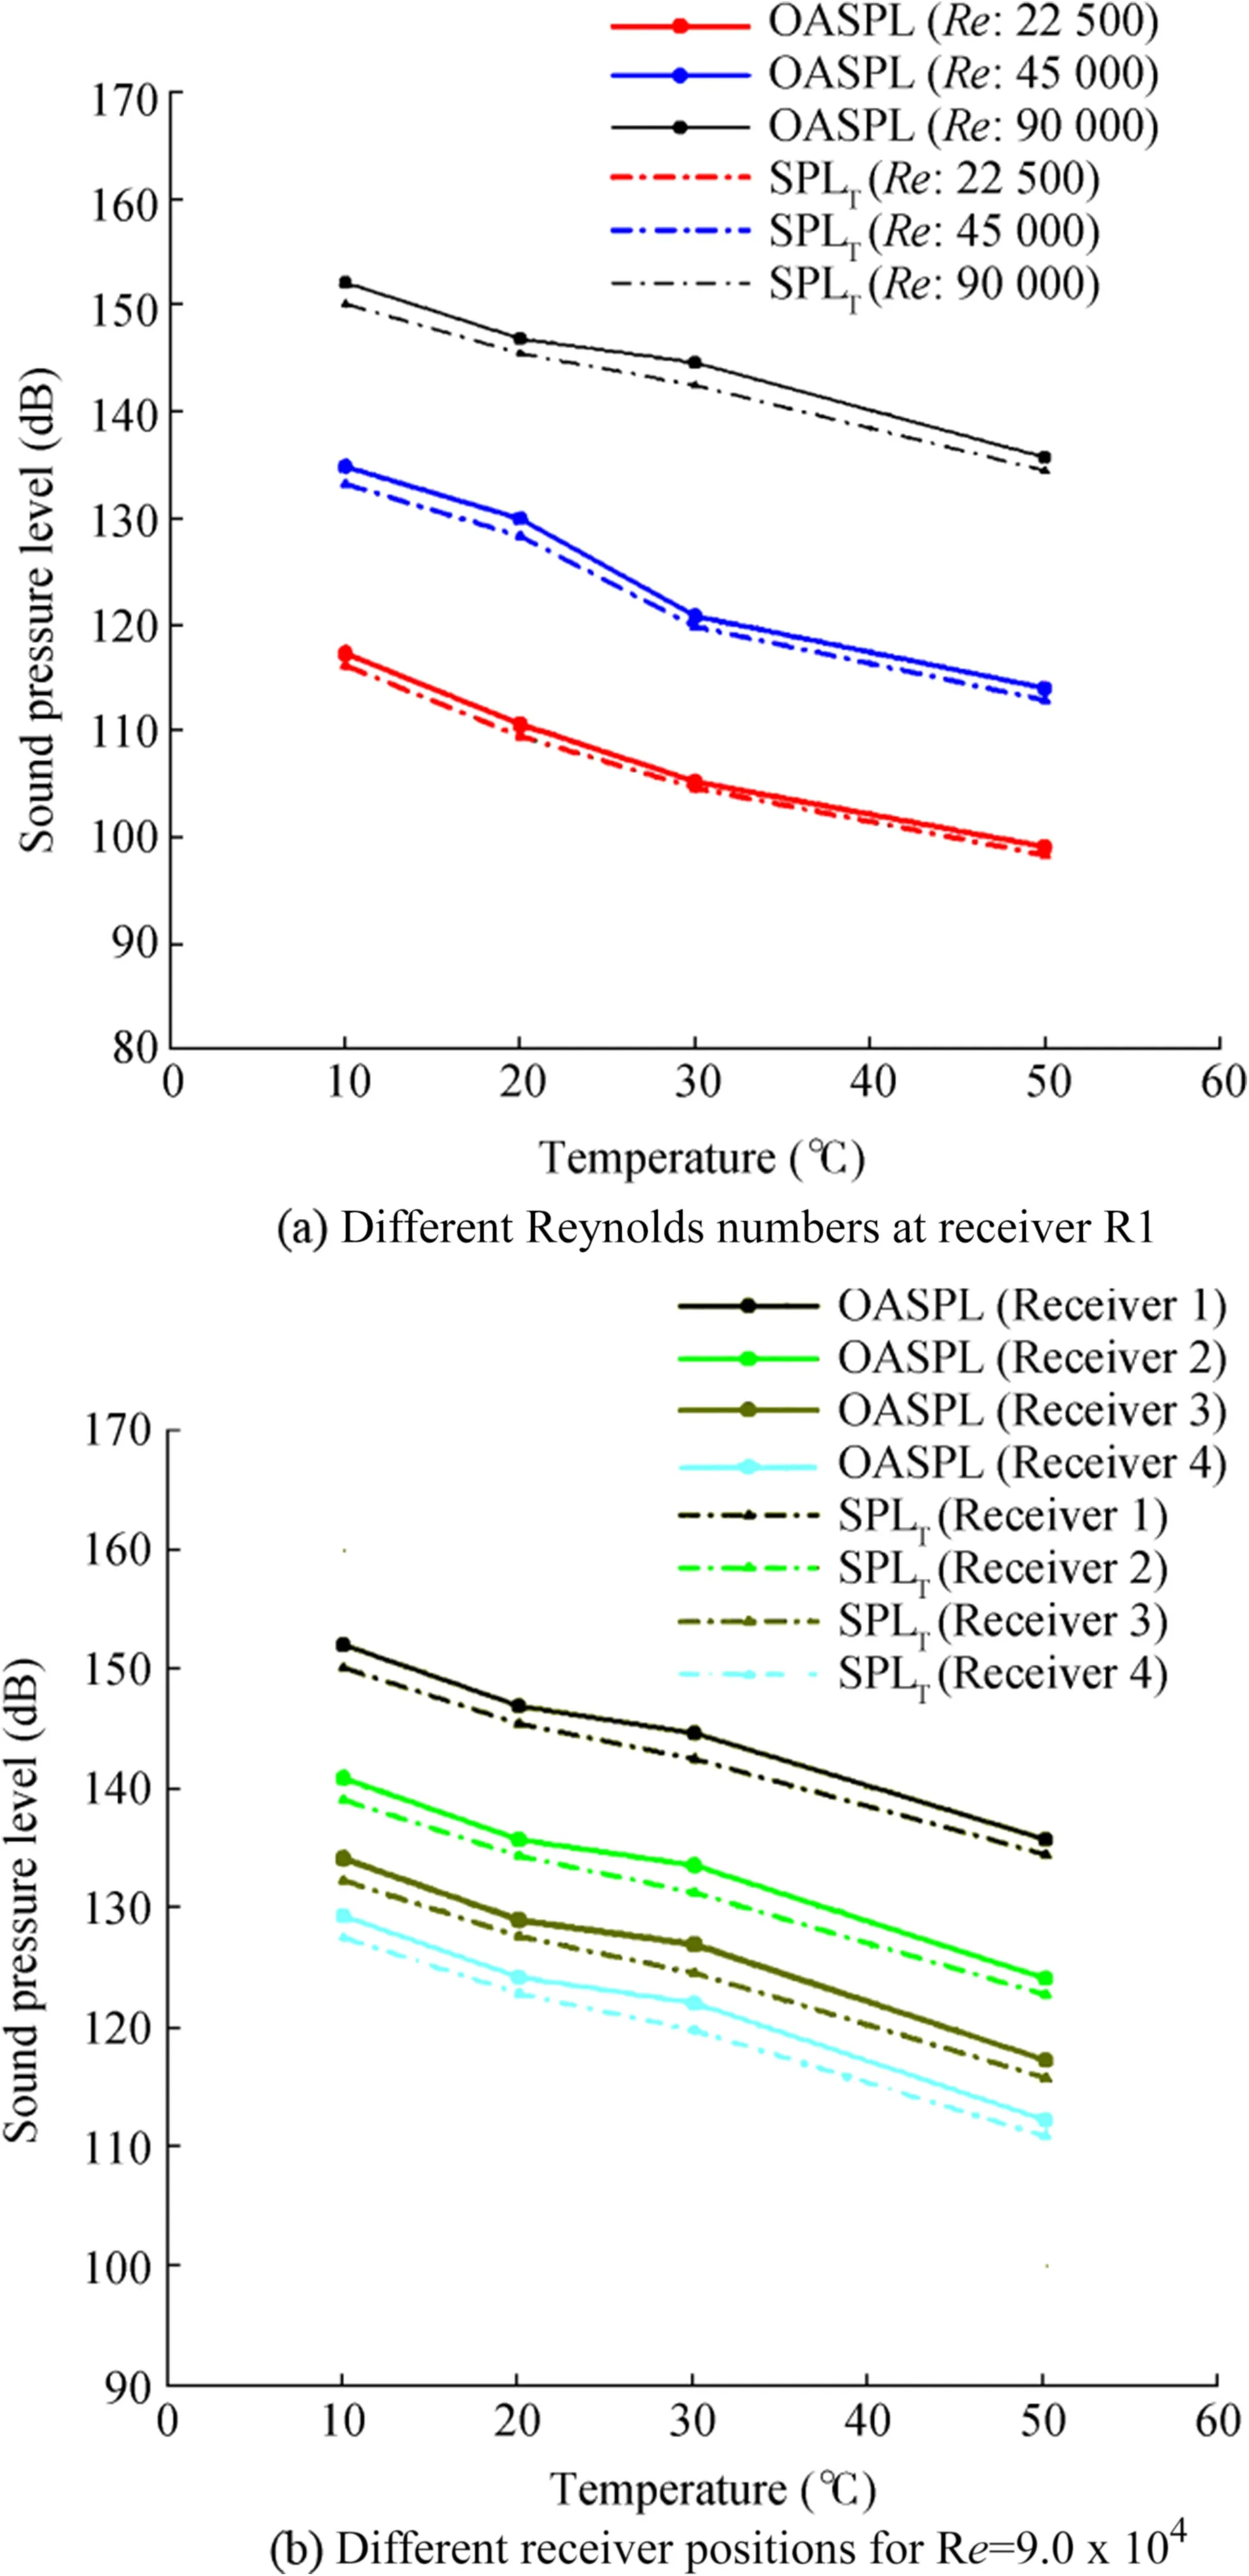
Figure 10 Variations of OASPL and SPLT with the water temperature(a)Different Reynolds numbers at receiver R1 (b) Different receiver positions for Re=9.0 x 10⁴
An increase in the temperature of a gas causes an increase in the molecular interchange and further intensifies the chaotic molecular motion. Consequently, the gas viscosity increases. Therefore, the heating of the air medium caused an increase in its viscosity, unlike for the water medium. The studies by Hu et al. (2002) and Shariff and Wang (2005) indicate that viscous shear stress can be a true source of sound and treats as a dipole with its dominance over quadrupole sources at low Mach numbers (M <1). In the current study, the air viscosity increased by about 10.4% with the temperature increase from 10 °C to 50 °C.This strengthened the dipole sources. A decrease of about 15.5% in density within the same temperature range undermines the quadrupole sources. However, the total noise levels increased with an increase in air temperature, as the dipole sources were more dominant than quadrupole sources for the Reynolds numbers considered.
The SPLTand OASPL obtained for different air temperatures are shown in Figure 12a.The OASPL and SPLTvalues increased with an increase in the air temperature.For instance,the OASPL increased from about 101.2 to 110.8 dB,and the SPLTfrom about 91.4 to 104.2 dB between the air temperature values of 10 °C to 50 °C for the Reynolds number of 9.0×10⁴. When the receiver distance was quadrupled, the OASPL value decreased by the maximum amount, about 12.8 dB,for the air temperature of 20°C,and the SPLTvalue also decreased by the maximum amount, about 13.0 dB, for the air temperature of 50°C(Figure 12b).
Figure 13 shows acoustic spectra for the salinity values of 10, 30, 50, and 70 g/kg. The main peak frequency was nearly independent of the water salinity. The broadband noise(f >1 kHz)increased with an increase in water salinity. It had a maximum increase of about 8 dB when the salinity increased from 50 to 70 g/kg.
The effects of salinity on the fluid viscosity can be explained by two mechanisms. First, each ion added to the water can be treated as an independent particle carrying momentum within the fluid.Second,the ionic interaction generates a certain resistance to the shear directly related to the fluid viscosity (Kwak et al.2005).When the water salinity increased from 10 to 70 g/kg,the viscosity increased by about 14.4%.As a result,the dipole source strength increased. Also, the density increased with salinity by about 3.9%,and this increased the quadrupole source strength.
The changes in the acoustic characteristics of OASPL and SPLTwith the water salinity are illustrated in Figure 14a.The OASPL and SPLTvalues increased with the water salinity.At the Reynolds number of 9.0×10⁴, the OASPL value increased from about 141.0 to 151.7 dB and the SPLTfrom about 137.6 to 150.5 dB.When the receiver distance increased fourfold,from R1 to R4,the OASPL decreased by the maximum amount,about 23.0 dB,for the water salinity of 10 g/kg;the SPLTalso decreased by the maximum amount,about 22.7 dB,for the water salinity of 30 g/kg(Figure 14b).
Figure 15 compares the acoustic spectra obtained for the water and air media.The spectral shape alters significantly by the fluid type.The noise levels obtained from the water and air media showed similar characteristics for the broadband noise at high frequencies(f >1 kHz).However,the acoustic characteristics for both media were completely different at low frequencies(f <1 kHz).

Figure 11 Comparisons of SPL spectra obtained for various air temperatures at receiver R1
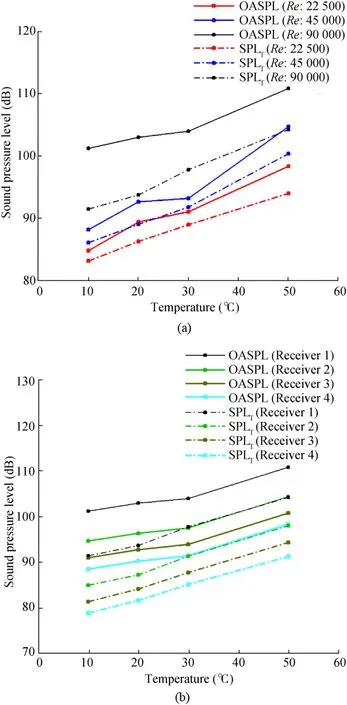
Figure 12 Variations of OASPL and SPLT with air temperature (a)Different Reynolds numbers at the receiver R1(b)Different receiver of Re=9.0x10⁴
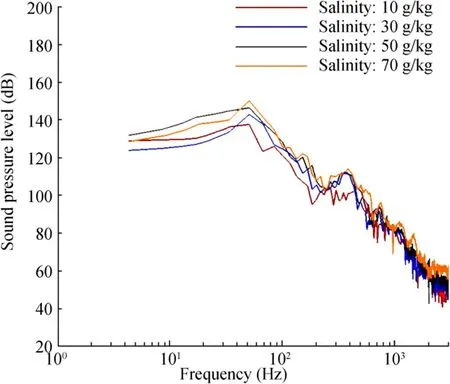
Figure 13 Comparisons of SPL spectra obtained for various salinity ratios(receiver:R1)
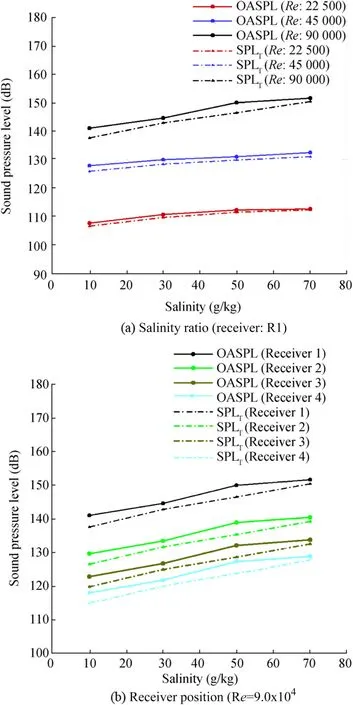
Figure 14 Variation of OASPL and SPLT. (a) Salinity ratio (receiver:R1)(b)Receiver position(Re=9.0x10⁴)

Figure 15 Comparisons of acoustic spectra obtained from water and air media(temperature:20°C,receiver:R1)
The main acoustic characteristics, that is, the main peak frequency (fT), SPLT, and OASPL for water and air media,are presented in Table 4.The main peak frequency for the air medium was higher than that for the water medium.The main peak frequency was 52 Hz for the water medium and 696 Hz for the air medium at the Reynolds number of 9.0×10⁴.The differences in the SPLTand OASPL values between water and air media were considerably high. For instance, the OASPL values were 146.9 and 103 dB for the water and air media at the Reynolds number of 9.0×10⁴,respectively.
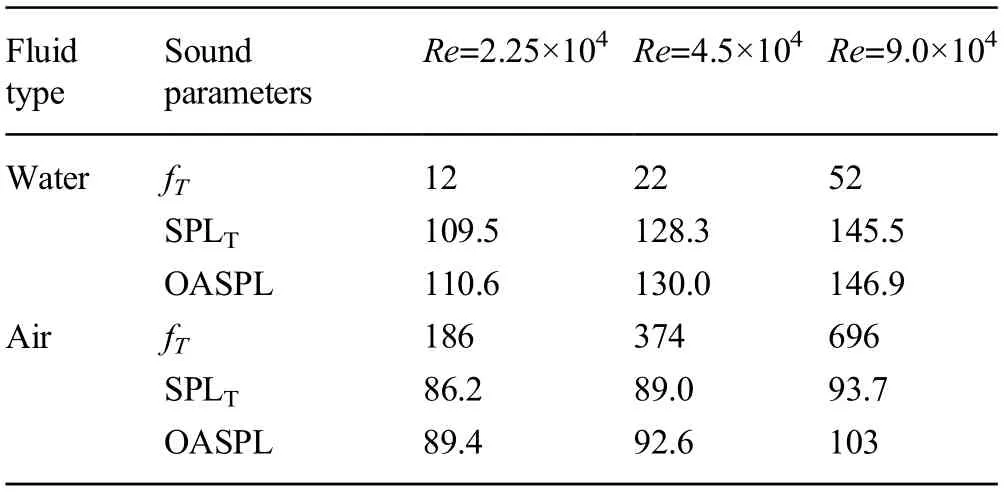
Table 4 fT,SPLT,and OASPL for water and air media(temperature:20°C,receiver:R1)
This difference in the SPLTand OASPL values between the two media was due to the difference in the fluid properties of the air and water media.For example,the water viscosity was about 57 times the air viscosity,and the water density was about 841 times the air density for the temperature of 20°C.Particularly,the difference in the viscosity was the dominant factor affecting the dipole sources. The other factor was the difference in density,which contributes to the noise levels by strengthening the quadrupole sources.
8 Conclusions
This study numerically investigated the effects of temperature,salinity, and fluid type on the acoustic characteristics of turbulent flow around a circular cylinder. Hydro- and aeroacoustic analyses were conducted to evaluate these parameters for a circular cylinder and at Reynolds numbers of 2.25×104,4.5×104,and 9.0×10⁴.The capabilities of the hybrid models(RANS-FWH,DES-FWH,and LES-FWH)to predict the turbulent flow structures and acoustic characteristics were examined by comparing the results with the experimental data.The hybrid method DES-FWH was chosen as an appropriate method for the analyses by considering the simulation cost and the accuracy of the results with the experimental findings.Hydro-acoustic measurements were also performed at the Reynolds number of 2.25×10⁴in a silent circulation channel.The temperature values within the range of 10-50 °C were examined for water and air media.The salinity values between 10 and 70 g/kg were evaluated for the water medium. The acoustic spectra obtained for the water and air media were compared for various Reynolds numbers.
The important findings of the investigation are as follows:
1) Increasing the water temperature from 10 °C to 50 °C resulted in about 57.7%and 1.3%decrease in water viscosity and density,respectively. Therefore, the temperature increase for water had diminishing effects on the dipole and quadrupole source strength. When the water temperature was increased from 10 °C to 50 °C, the OASPL decreased from about 152.1 to 135.7 dB, and the SPLTfrom about 150.2 to 134.5 dB for the Reynolds number of 9.0×10⁴.
2) An increase in the air temperature from 10°C to 50°C led to about 10.4% increase in the air viscosity and 15.5%decrease in the air density.This had strengthening effects on the dipole sources but weakening effects on the quadrupole sources. As the dipole sources were more dominant than the quadrupole sources for the Reynolds numbers considered, the total noise levels increased with an increase in the air temperature. The OASPL increased from about 101.2 to 110.8 dB and the SPLTfrom about 91.4 dB to 104.2 dB between the air temperature values of 10°C and 50°C for the Reynolds number of 9.0×10⁴.
3) With increase in the salinity from 1×10⁻⁵to 7×10⁻⁵,the water viscosity and density increased by about 14.4%and 3.9%,respectively.This led to an increase in the strength of dipole and quadrupole sources. When the salinity increased from 10 to 70 g/kg,the OASPL value increased from about 141.0 to 151.7 dB for the Reynolds number of 9.0×10⁴and the SPLTfrom about 137.6 to 150.5 dB.
4) The shape of the acoustic spectrum significantly depends on the fluid type. The acoustic characteristics were completely different for the water and air media at low frequencies(f <1 kHz).The main peak frequency for the air medium was higher than that for the water medium.The differences in the SPLTand OASPL values between water and air media were considerably high.For instance,the OASPL values for the water and air media were 146.9 and 103 dB,respectively,at the temperature of 20°C for the Reynolds number of 9.0×10⁴. This was due to the difference in the fluid properties of the media.
5) The effects of the increase in the fluid temperature on the main peak frequency fTdiffered based on the fluid type.An increase in the temperature caused a reduction in the main peak frequency for the water medium,while it led to an increase in the main peak frequency for the air medium. Interestingly, the main peak frequency was nearly independent of the water salinity.
6) The broadband noise (f >1 kHz) decreased with an increase in the water temperature but increased with an increase in the air temperature. Also, an increase in the salinity led to an increase in the broadband noise. The noise levels obtained from the water and air media showed similar characteristics for the broadband noise at high frequencies(f >1 kHz).
Overall, this study presents valuable information on the effects of temperature,salinity,and fluid type on the acoustic characteristics of turbulent flow around a circular cylinder.It further clarifies the complex nature and structure of aero-and hydro-acoustics.
杂志排行
Journal of Marine Science and Application的其它文章
- Analysis of Wave Energy Resources Around the Saint Martin Island in Bangladesh
- Reliability Analysis Method of a Control System for Subsea All-Electric Christmas Tree
- Topside Axial Bearing Wear Under the Eccentric Load of a Single-Anchor Leg Mooring System in Bohai Bay
- Fire Risk Quantitative Assessment of Offshore Supported Platform
- Fast Tool for Structural Monitoring of a Pier After Impact of a Very Large Vessel Using Ambient Vibration Analysis
- Numerical Investigation of Sloshing Under Roll Excitation at Shallow Liquid Depths and the Effect of Baffles
