Super-resolution reconstruction based on CNN: A case study of Jilin-1 multispectral data
2021-09-10JINDaomingandWUQiong
JIN Daoming and WU Qiong
College of Geo-Exploration Science and Technology, Jilin University, Changchun 130026, China
Abstract: MS or MS+PAN is usually applied separately in convolutional neural network (CNN) resolution reconstruction to obtain high-resolution MS images, but the difference between the two datasets is rarely studied. This paper introduced a dual-channel network and took MS and MS+PAN of Jilin-1 spectrum satellites as two datasets to evaluate the performance of CNN resolution reconstruction, and analyzed the difference with bicubic and GS methods. The result of CNN reconstruction shows that MS+PAN dataset performed better than MS, with about 6% improvement in spatial and spectral components, and the overall quality of MS+PAN dataset was slightly higher than that of MS dataset, with QNR from 0.955 9 to 0.958 4. The bicubic performed best in spectral components with the quality value of 0.017, and GS performed best in spatial components with the quality values of 0.044 3. CNN showed similar performance in spectral and spatial components with the two traditional methods and achieved the best overall quality with QNR value of 0.958 4.
Keywords: Jilin-1 spectrum satellites; CNN; super-resolution reconstruction
0 Introduction
High-resolution remote sensing images contain rich details and feature information that have been widely applied in classification, target recognition, assessment of urban economic levels, resource exploration, and change detection (Ghamisietal., 2019). Different ground objects with the specific spectral characteristics can be reflected in the multispectral remote sensing images, whereas the low-resolution (LR) images cannot reflect the ground truth due to the pixel confusion limited by the hardware performance. Super-resolution reconstruction obtains high-resolution (HR) images with more accurate reflection of the true size of ground objects (Yueetal., 2016). Remote sensing satellites usually provide high-resolution PAN images and low-resolution MS images in the early time (Lietal., 2013). Moreover, pan-sharpening is a frequently applied super-resolution method using the panchromatic band to supplement the multi-spectral band to acquire a high spatial resolution synthetic image with multi-spectral features (Restainoetal., 2017).
Component substitution (CS) and multiresolution analysis (MRA) are the two main traditional pan-sharpening methods. CS methods up-sample the LRMS image and convert it to a suitable dimension, replace a component of the converted MS image with PAN image, then convert it to the original dimension to obtain the pan-sharpened images (Tuetal., 2004). MRA method extracts high-frequency features from PAN images and injects them into up-sampled MS images (Shettigara, 1992). Both MRA and CS methods are highly dependent on the registration accuracy of PAN images and MS images, and the mismatch or spatial distortion may deteriorate the visual quality of the fusion data.
Flexibility and learnability are two major advantages of machine learning (Lee & Lee, 2010). Compression perception and dictionary learning have been successfully applied to image resolution reconstruction (Aiazzietal., 2017; Yangetal., 2017). Many convolutional neural network (CNN) structures have been proposed for the super-resolution reconstruction since CNN structure was firstly applied for remote sensing super-resolution in 2014 (Vicinanzaetal., 2015). Masietal. (2016) designed a three-layer convolutional structure network, and without additional data, improved the image quality by adding remote sensing nonlinear radiation fingers in the training set. Lanarasetal. (2018) proposed the DSen2 model based on the idea of the EDSR model, which reconstructed all the bands of the sentinel 2 data to 10 m. Yangetal. (2019) constructed a dual-channel network covering spectral and spatial features respectively, which is called PanNet. Scarpaetal. (2018) established an A-PNN network for super-resolution reconstruction through the residual-LI-fine-tuning optimal combination of loss function, network structure and training strategy in the CNN structure.
In this study, two datasets were created using the multi-spectral image of Jilin-1 spectrum satellite to evaluate the performance achieved by CNN and the influence of PAN data in the resolution reconstruction. A dual-channel structure network with multi-scale modules in space channel and residual block in spectral channel was proposed to improve the ability of spatial channel in feature extraction, and to evaluate the PAN image effect of resolution reconstruction compared with MS dataset and MS+PAN dataset in image quality improvement.
1 Materials and methods
1.1 Materials
Seven images in northeast China were selected as the experimental data, of which four scenes were used as training data, two scenes were used for testing, and one scene was used for prediction. PAN band (B0) and MS (B7-B12) are used in the super-resolution (Table 1), all the data are standard level-1 products with radiative and geometric correction, the signal-to-noise ratio is better than 40 dB, the in-scene orientation accuracy is better than 1 pixel (RMSE).
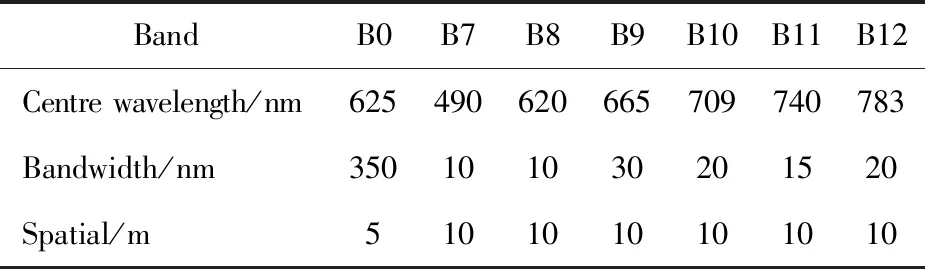
Table 1 Jinlin-1 bands for resolution reconstruction
1.2 Methods
CNN is a fully supervised network that highly counts on ground truth, which makes the obtaining of training and label data significantly important, consi-dering the difficulty of HRMS image acquirements. So the resolution reconstruction was simulated at lower scale in the training process with the original images regarded as label data. In order to improve the authenticity of low-resolution image, Gaussian filtering was performed on the image before down-sampling to remove high-frequency noise in the original image.
High similarity exists between the output images of resolution reconstruction, and the basic modules including convolutional layer and activation function are usually retained to weaken the loss of image texture caused by the original image and the complex network structure. In order to reconstruct the spatial information as well as preserve the spectral information, a dualchannel network was built from both spectral and spatial aspects. Up-sampled LRMS was input to the spectral channel prior to residual module. Convolution modules with different sizes of convolution kernels were added to extract multiple levels of spatial features in PAN images from multiple scales (Fig. 1).
Datasets were composed of 21 000 training images selected from four scene images, the input size of PAN image is 128×128, the input size of MS image reconstructed is 64×64, and each batch has 64 images. The learning rate is set to 0.001, SGD optimizer was chosen to process large amounts of data, and Relu was used as the activation function between the convolutional layers. Since convolution operation in CNN will cause image edge distortion, we guaranteed 20% overlap between adjacent images when cropping the images. So, we only evaluated the nonoverlapping region of the result image during test and prediction.
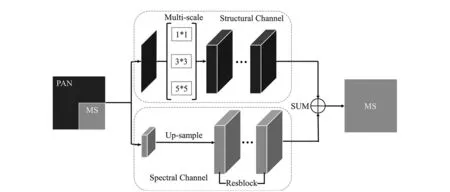
Fig.1 Structure of learning network
Quality of the reconstructed image was evaluated by full-reference and no-reference index, includingERGAS,Q,SAM,Dλ,DsandQNR. The calculation formula is as follows:
ERGAS: Relative synthesis error
(1)

Q: Universal image quality index (Wang & Bovik, 2002)
(2)
SAM: Spectral angle mapper
(3)

QNR: Quality with no-reference index (Alparoneetal., 2008)
QNR(1-Dλ)·(1-Ds)
(4)
Dλ: Spectral Index ofQNR
(5)
Ds: Spatial Index ofQNR
(6)
Wherexis the LRMS image,Xrefers the pan-sharpened image,Pis the PAN image,pis the down-sampled PAN image.
2 Results
The training and testing part were performed at low scale regarding the original image as the ground truth, and the prediction part was performed at original scale. All the experiments were carried out on Dell workstation with an E3 1230 V3 CPU and Quadra m2000 GPU using Python 3.6 and Tensorflow 1.8.0.
2.1 Testing
400 test images were taken to verify the performance of the network, and the average was taken as the final result. The CNN results were compared with the traditional bicubic interpolation and the GS method to evaluate the advantages of the resulting image. Table 2 shows the test results of the reconstruction methods (the value in bold is the index of the best perfor-mance), and the value of the 4 full-reference indices shows that the CNN method performed the best on both datasets, followed by the up-sampling method, and the GS method performed the worst. The values of the three no-reference indices show that the up-sampling method has the same spectral information as the original image with the best performance for the spectral index. CNN performed best for the spatial index and achieved the best performance for QNR index. The MS+PAN dataset performed better than MS dataset for the training of network.
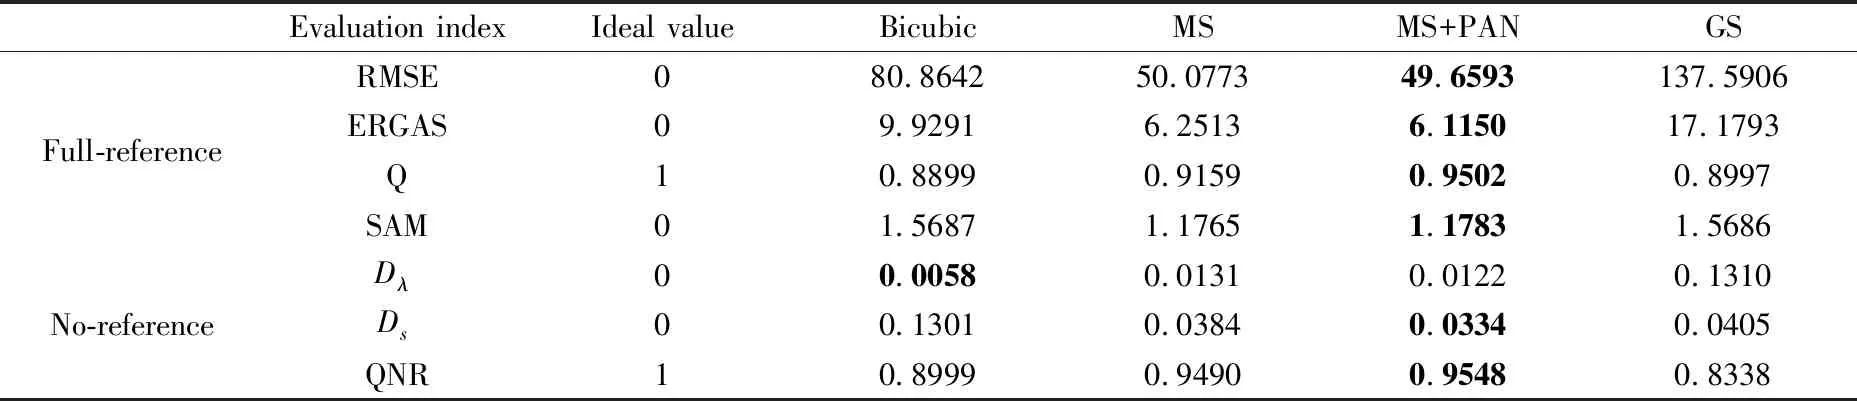
Table 2 Objective performance of reconstruction methods at low scale
2.2 Prediction
An original scale image was selected for prediction to verify that the proposed method can be applied to true images. Each image in Fig.2 is 6.5 km*6.5 km in size, the selected area is located in the northeast of Baicheng City, Jilin Province, China. Since visualization was limited to 3 bands at a time, we picked bands B5, B4 and B3. The result image of the bicubic interpolation is visually the same as the LRMS, which means super-resolution did not improve the spatial information (Fig. 2c). The traditional GS method has good visual performance. As can be seen from the details in Fig. 2f, the spectral difference between buildings and farmland is obviously less than that of LRMS. In CNN method, the two datasets showed same visual effect and both showed better results in space and in spectral.
The quality comparison among the reconstructed images showed that the bicubic interpolation had the highest spectral index, the CNN method achieved the best performance in the spatial and QNR index, and the GS method had the worst performance. The results of MS+PAN dataset performed better than those of MS dataset. However, the bicubic interpolation and the GS method achieved the best performance in spectrum and space respectively, and the CNN method in the two datasets was basically the same but with better results both in space and in spectral.
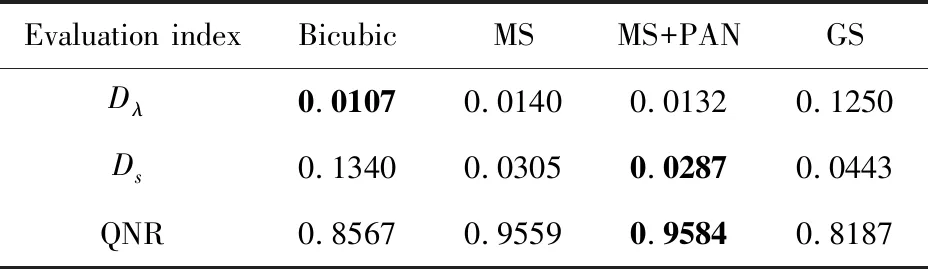
Table 3 Objective performance of reconstruction methods at true scale
3 Discussion
The CNN (Q=0.950 2) has better performance than bicubic interpolation (Q=0.889 9) and GS methods (Q=0.899 7) from the values of the full-reference index. The reason is that the CNN method is a result-driven learning method that updates parameters continually to make the output value closer to the tag value during training. When the network converges,the output image is closer to the label than other me-thods. The comparison with no-reference index indicated that bicubic interpolation performed best in spectral feature and worst in spatial feature, while GS method had the worst performance in spectral feature and tended to perform better in spatial feature than other methods, which can also be seen from the visua-lization figure. This phenomenon may attribute to the unchanged image information in the interpolation of the bicubic method. The GS method completely injects the PAN data into the multispectral image, which makes the spatial information of the result image richer, but it is with spectral distortion resulted from the excessive introduction of PAN data. CNN achieved best QNR index (QNR=0.958 4), although both of the spectral and spatial index were not appeared in the comparison. The result of MS+PAN dataset performs better than those of MS dataset, and the improvement in the spatial component is more obvious.
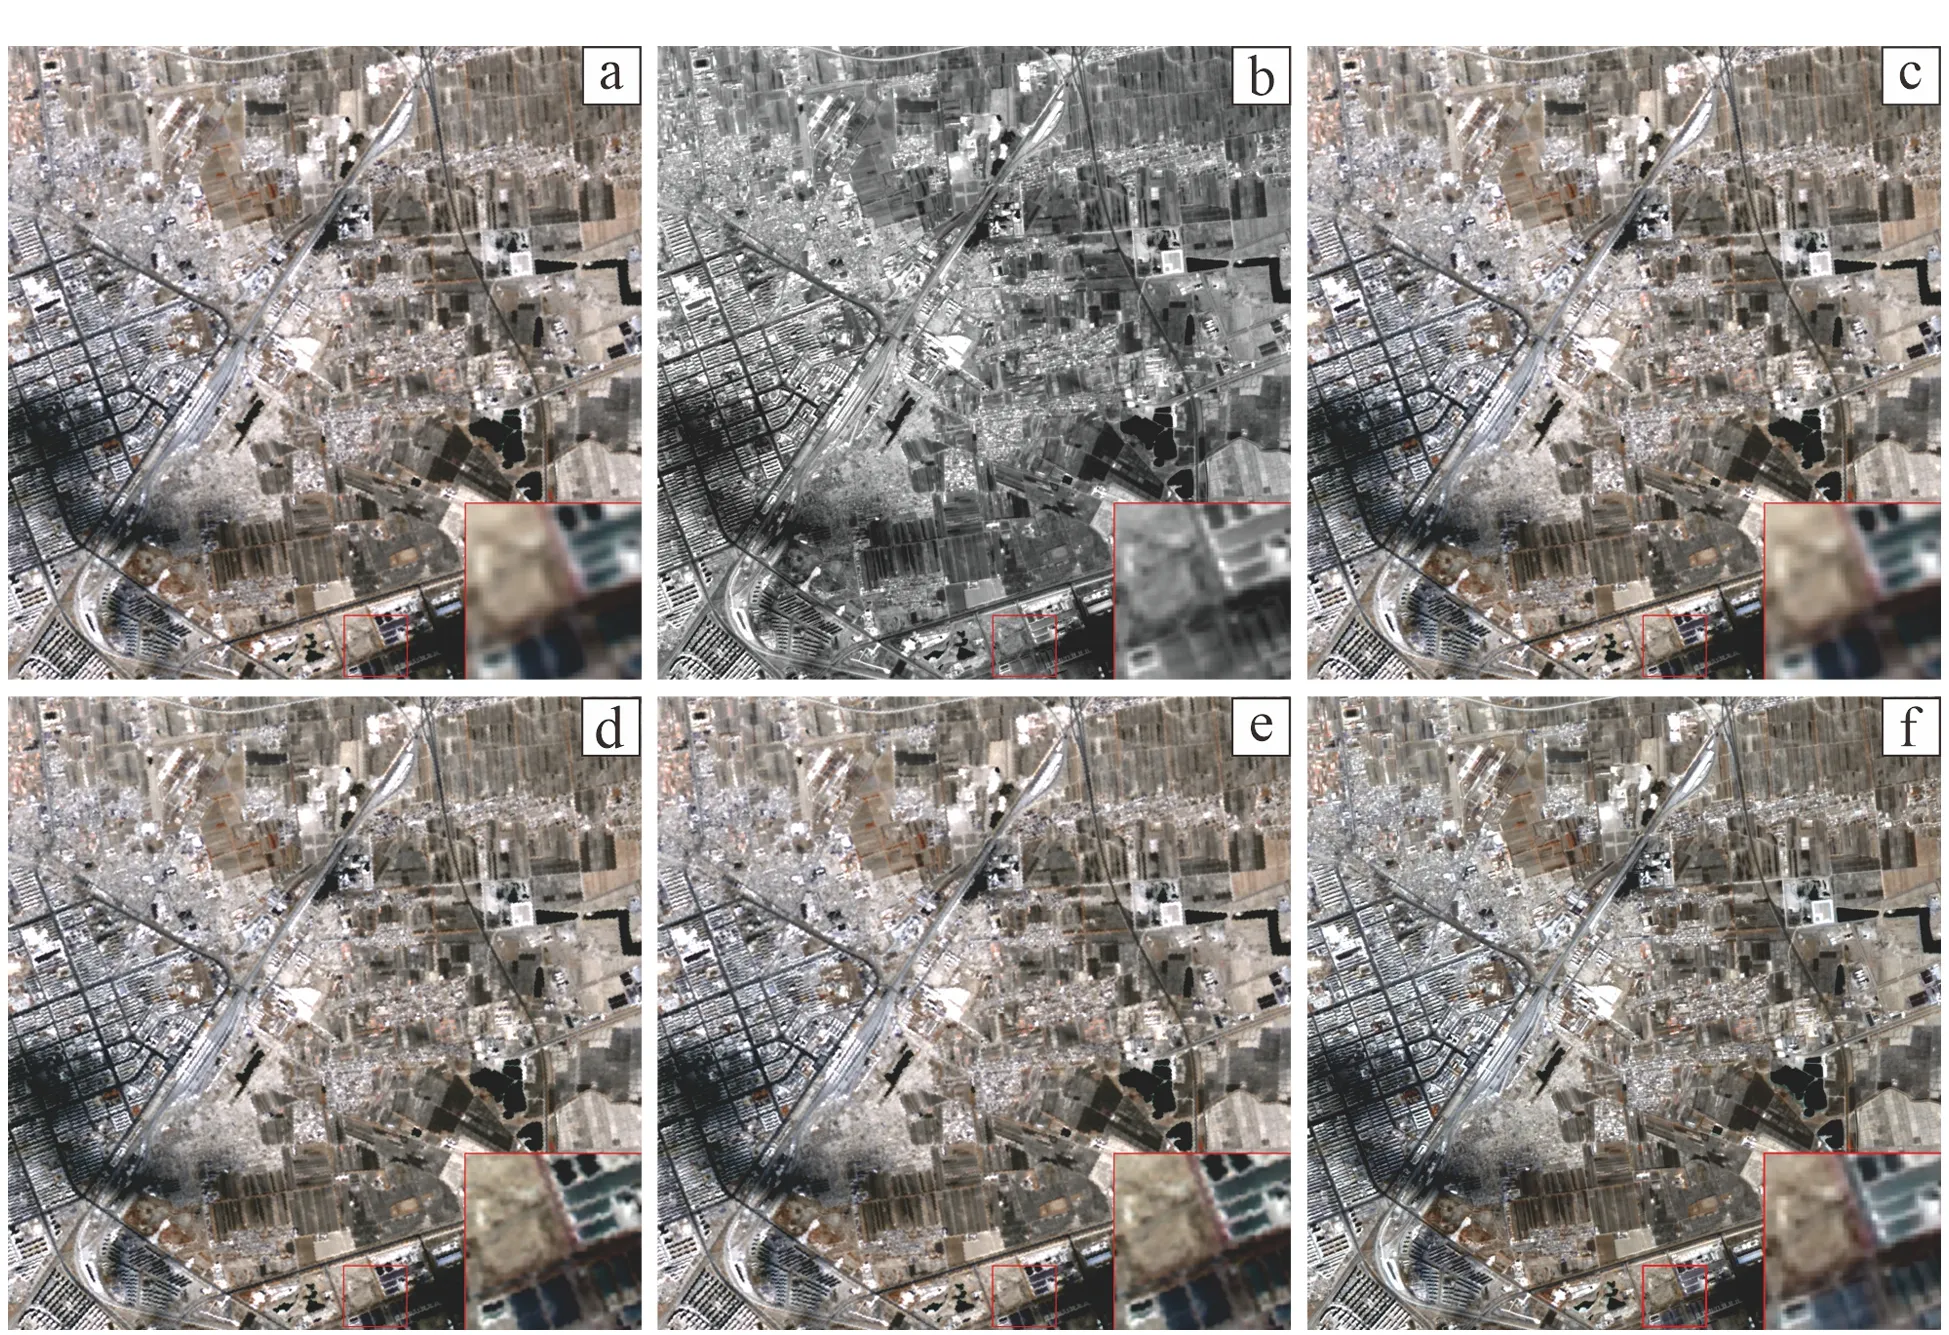
(a) LRMS; (b) PAN; (c) bicubic interpolation; (d) MS dataset; (e) MS+PAN dataset; (f) GS method.Fig.2 Comparison of reconstructed result obtained by different methods
The results from without reference showed that MS+PAN data were superior to MS data, the spatial and spectral components increased by about 6%, and the overall quality was slightly higher than MS data, with QNR between 0.955 9 and 0.958 4. The bicubic polynomial performed best in the spectral component with a quality value of 0.017, and GS performed best in the spatial component with a quality value of 0.044 3. CNN showed similar performance to the two traditional methods in terms of spectrum and spatial composition, and had the best comprehensive quality, with a QNR value of 0.958 4.
In addition, there are some aspects worthy of further study based on this paper. Firstly, this experiment only used limited Jilin-1 spectrum satellite images to make datasets, while other large and multi-source dataset can be applied for more comprehensive comparison. Secondly, more reconstruction network structure can be proposed to make the network extract the features in the PAN image more effectively.
4 Conclusions
This paper took Jilin-1 spectrum satellite images as an example to create MS and MS+PAN datasets, and proposed a dual-channel network with multiscale module and residual block for super-resolution reconstruction which can extract the spatial information effectively while preserving the spectral information. With the comparison to the traditional methods in full-reference and no-reference image quality indices, the difference between CNN and the traditional methods was estimated. The role of PAN images in resolution reconstruction was evaluated by the comparison between the two datasets. The following conclusion can be drawn:
(1) The traditional methods only focus on the spatial (GS method) or spectral (bicubic interpolation) components. CNN method has a better per-formance comparing with the traditional methods, the overall quality of the images is the best. CNN’s advantage lies in its ability to retain both spectral and spatial components,
(2) The high frequency information of PAN data corresponding to multispectral images can be extracted by CNN methods to improve the image quality of the super-resolution reconstruction.
杂志排行

Global Geology的其它文章
- A voxel-based fine-scale 3D landscape pattern analysis using laser scanner point clouds
- Application of topography fast marching method in landslide
- Subsurface target recognition in Utopia Planitia of Mars by Tianwen-1 FP-SPR simulation
- Structural characteristics and hydrocarbon accumulation in Bashituo area, Tarim Basin
- Characteristics and sources of ore-forming fluids of South Narimalahei copper polymetallic deposit in East Kunlun, Qinghai
- U-Pb-Hf isotopes and petrogenesis of Late Jurassic akakitic quartz monzodiorite in Xingcheng area, western Liaoning Province