Estimation of the Scale of Artificial Reef Sets on the Basis of Underwater 3D Reconstruction
2021-08-28TANGYanliZHANGZuhaoandWANGXinxin
TANG Yanli, ZHANG Zuhao, and WANG Xinxin
Estimation of the Scale of Artificial Reef Sets on the Basis of Underwater 3D Reconstruction
TANG Yanli, ZHANG Zuhao, and WANG Xinxin*
,,266003,
The creation of three-dimensional models from an unorganized set of points is an active research area in computer graphics. One of the purposes of this study is to explore the 3D reconstruction of a cube-type artificial reef (CTAR) set by linear structured light and binocular stereo vision technology in an underwater environment. The experimental setup is composed of two ca- meras in a stereo vision configuration. The alpha shapes method can be used to construct a surface that most closely reflects the arti- ficial reef set described by the points. A parameter study is conducted to assess the scales of the set (., usable volume, surface area, projected area, height, and base diameter) on the basis of 3D reconstruction. Experimental results show that the quality of 3D recon- struction in an underwater environment is acceptable for estimating the scale size of the CTAR set. According to the measurement of the scale sizing of the CTAR set, the relationships between the parameters of the CTAR set and the number of CTAR modules were determined. Moreover, the usable volume of the CTAR set can be estimated depending on the basis of the number of CTAR modules.
cube-type artificial reef; structured light; binocular stereo vision; three-dimensional reconstruction; alpha shapes method
1 Introduction
As an important and popular resource enhancement tech- nique (Brickhill., 2005; Firth., 2016), artificial reefs (ARs) can create new habitats and food resources for marine life and breathe life into the ocean by concentra- ting fishes and increasing the natural production of bio- logical resources (Bohnsack and Sutherland, 1985; Polo- vina and Sakai, 1989; Pickering and Whitmarsh, 1997; Sea- man and Jensen, 2000; Boswell., 2010). From 1962 to the beginning of the 1990s, the United States and Japan were the main centers of AR research with the main goal to improve coastal fisheries (Lima., 2019). Japanese scientists have proved that specifically designed shallow- water reefs can improve the survival and growth of juve- nile fish (Sheehy, 1979). In 2004, 12% of the continental shelf of Japan held 2×10⁷m3of different types of ARs, particularly metal structures. In the United States, Florida is the site of many ARs and has one of the most active AR programs. Subsequently, an increasing number of countries (especially China, Australia, Italy, Brazil, and the United Kingdom) have begun to focus on AR programs, such as a perspective on the future of ARs in Europe (Jensen, 2002), AR design for Korean coastal waters (Kim., 1994), the present status of ARs in Thailand (Kheaw-wongjan and Kim, 2012), and the development of con- crete ARs using industrial waste in China (Huang.,2016). Since 2008, thirty million cubic meters of artificial reefs have been deployed in Shandong and Guangdong pro- vinces in China. By 2025, relevant departments of the Chi- nese government will deploy more than 5×10⁷m3of arti- ficial reefs in the Yellow Sea, the South Sea and the East Sea. The area of artificial reef zones will reach 1100km2.
Millions of cubic meters of ARs are constructed world- wide for fishery or resource enhancement, and the deploy- ment of ARs will be a complex and controversial social issue (Sutton, 2007). The scales and purposes of Ars vary widely, (., small structures by individuals in artisanal fishing communities, complex systems of heavy modules for commercial seafood production, and experimentally based structures for the restoration of the ecosystem). Le Diréach. (2015) investigated the influence of the size, material, and structure of ARs in attracting fish, and they found that the mean size and density of the target species mostly tended to increase with the size or volume of ARs. Baine (2001) reviewed 249 papers on ARs, and found that 36 papers (14%) noted the importance of design com- plexity and the configuration, size, volume and area of the reef.
To facilitate the management of ARs, these man-made structures have been classified into scales by module, set, group, and complexity (Grove and Sonu, 1983), as shown in Fig.1. The combination of architectural complexity, mo- dule design and the layout of modules on the bottom is considered to be the key to AR effectiveness (Sherman, 2002). ARs can be placed in selected areas of the marine environment through AR deployment models, such as the intensively stacked deployment model, flatly concentrated deployment model, and flatly distributed deployment mo- del (Yoon., 2016). Among a series of deployments, the sizes, shapes, and volumes of ARs vary from deploy- ment to deployment. In more complex reefs, the greater di- versity in habitat resources allows colonization to proceed over a long period of time, resulting in great species rich- ness, density and biomass (Charbonnel., 2000). Jor- dan. (2005) suggest that AR sets composed of se- veral small reefs will have greater abundance than larger ones with equal volume because a greater density of fish can exist on smaller reefs than larger reefs. Large AR units comprise vast undivided empty chambers. Nevertheless, ARsets can offer numerous, relatively small interconnectedchambers and an extended substratum area (Charbonnel., 2000). The scale of an AR set, which is measured with respect to its volume, height, attachment area, and base diameter, is another component that has received attention due to its influence on fish assemblage structure. The three- dimensional reconstruction method allows for accurate mea- surements of the volume, surface area and other morpho- metric measurements of 3D objects (Cookson., 1993; Baillard., 1999; Zisserman., 1999; Chittaro, 2002;Williams., 2010). Therefore, it is important to de- velop a strategy to estimate the spatial scale of the cubic type AR (CTAR) set through a 3D reconstruction of the set using the alpha shape method. CTARs have a simple shape, good workability, and low cost, as shown in Fig.2. Moreover, CTARs are suitable for fisheries and the protection of migratory fish due to the relatively large void at each surface (Kim., 2014). Several modules can be stacked to establish an AR set. The intervals among neigh- boring reefs offer small organisms places to hide, forage for food, and reproduce (Seaman and Lindberg, 2009). The stacked CTAR set is also suitable for use in combination with other types of ARs. For example, the AR project in the Haizhou Bay of China combined a CTAR set with sun- ken ships. First, the direct effect of the water flow on the vessels’ reefs is weakened to extend the service life of the ARs; Second, the complement and combination of them can occupy a large sea space, which can increase the effect range of ARs.
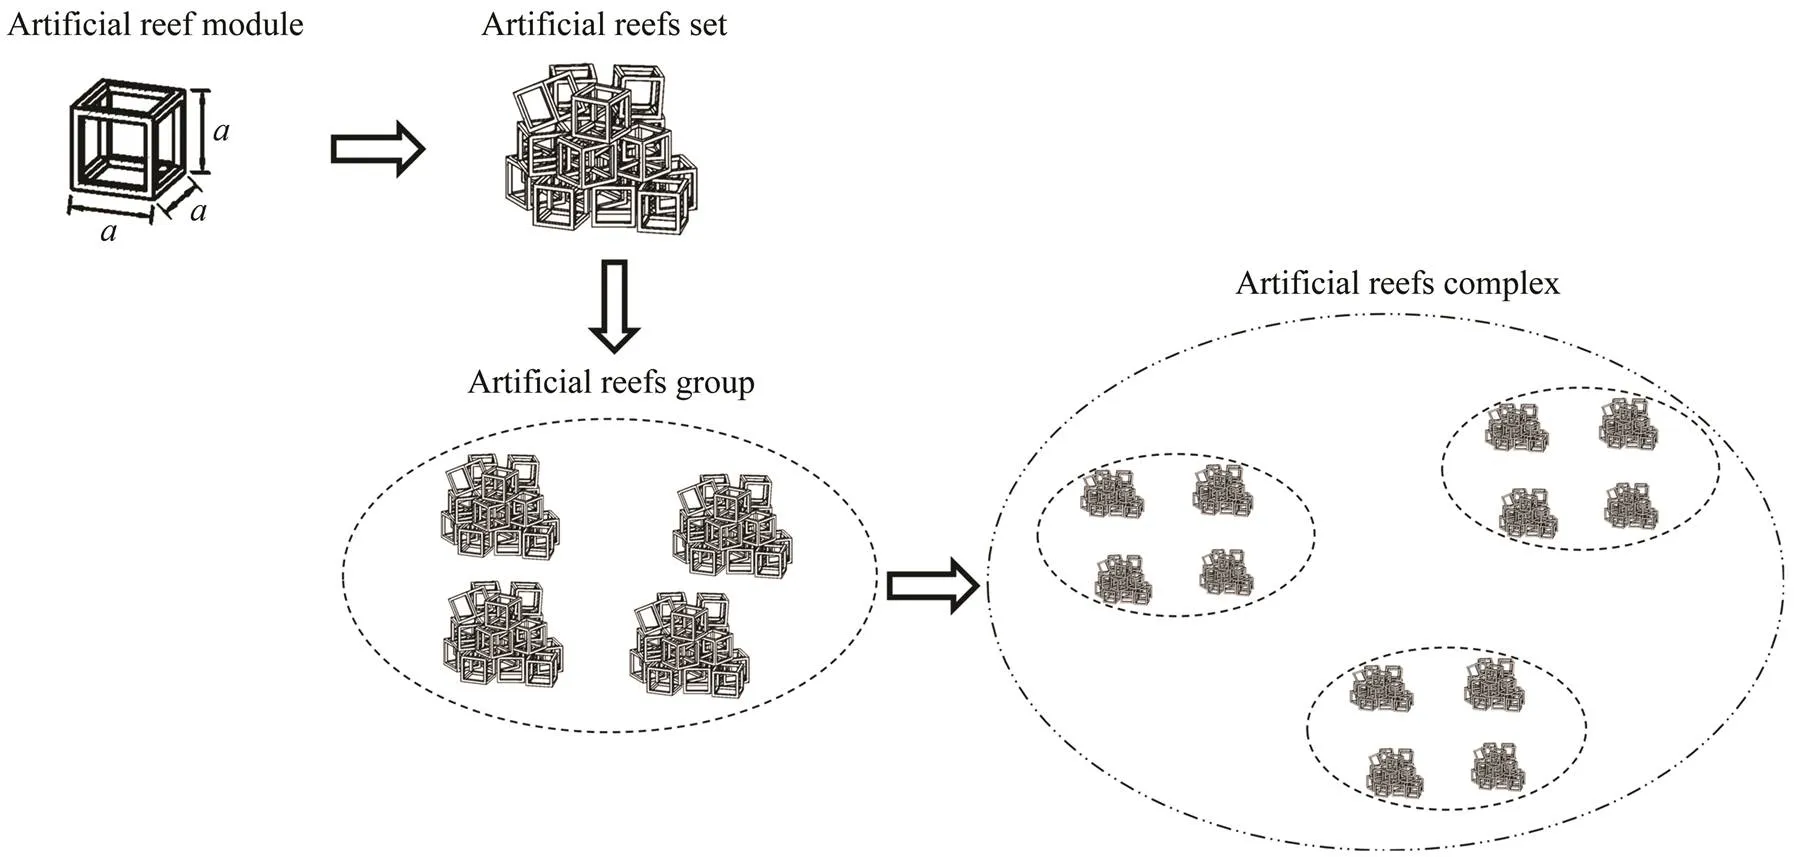
Fig.1 Artificial reef classifications.

Fig.2 CTAR module and a regular reef set consisting of eight CTAR modules.
A few studies have investigated the scale of an AR set or other deployments. Numerous studies on the ecological effects of ARs on the surrounding environments and the interaction with marine species have been conducted (Po- lovina and Sakai, 1989; Pickering and Whitmarsh, 1997; Pickering., 1998; Kim., 2008; Boswell., 2010; Le Diréach., 2015). These studies show that the fish attracted to AR zones vary from reef to reef depending on their age, size, and structure. As the ARs are three-dimen- sional structures, the richness and biomass data are re- ferred to the volume of artificial reefs rather than the sur- face area. Thus, the volume of the AR set, especially its irregular geometry must be investigated. Calculating the volume of one single reef module is easy. However, reef sets composed of hundreds of small reef modules can offer numerous small, interconnected chambers and substratum areas. In this case, the calculation of the reef set volume depends not only on the shape of the reef sets but also on the interconnected chambers.
In terms of the estimation of the scale sizing of the AR set, field measurements, water tank experiments and nu- merical analytical methods are the main ways to investi- gate the size, volume, height and surface area of an AR set. Yoon. (2016) proposed three coefficients to pre- dict the total loss of ARs, the effective usable volume, and the burial volume of the current physical states of the nine CTAR sets that were constructed between 1987 and 2002. However, in addition to the high costs of field investigations and the limitations of marine environmental conditions, the general method of surface structure surveyingusing multibeam scanning is hard to be employed to un- derstand ARs and the underwater structure of the seabed in detail. To reduce measurement costs, a low-cost predic- tion method must be developed. Bruno. (2011) con- ducted tests under different turbidity conditions to prove that the 3D reconstruction quality is acceptable, even with high turbidity values. Our research aims to set up an expe- riment to explore the 3D reconstruction of a CTAR set by using linear structured light and binocular stereo vision te- chnology in an underwater environment. The experimen- tal setup is composed of a video projector and two cam- eras in a stereo vision configuration. The alpha shape me- thod (Edelsbrunner., 1983; Edelsbrunner and Mucke, 1994) is used to construct a surface that most closely re- flects the CTAR set described by the point clouds. Then, on the basis of these 3D reconstruction models, a parame- ter study is conducted to assess the scale sizing of a CTARset (., usable volume, surface area, projected area, height, and base diameter) by using the alpha shape method.
2 Materials and Methods
2.1 CTAR Set Model
In this study, a CTAR set comprised multiple single mo- dules ranging from 20 to 200 modules. As shown in Fig.2, the usable volume (V,m) of the single module is3. Ac- cording to the definition of the usable volume of an AR set (V,s) by Yoon. (2016),V,sof eight CTAR mo- dules without any interval between them is 83, which equalsn×V,m(nis the number of CTAR modules). In general, an AR set is irregular with some intervals, and thus,V,sis larger thann×V,m(see Fig.3). Therefore, the relation between the actual usable volume of a CTAR set and the number of CTAR modules must be understood. One purpose of this research is to use the alpha shape me- thod to measure the scale sizing of a CTAR set (., us- able volumeV,s, heightH, surface areaA(the plane area enclosed by bold lines), projected areaA,p, and base di- ameterD. Finally, based on these parameters, we can de- termine the relationship between the parameters and the number of CTAR modules.
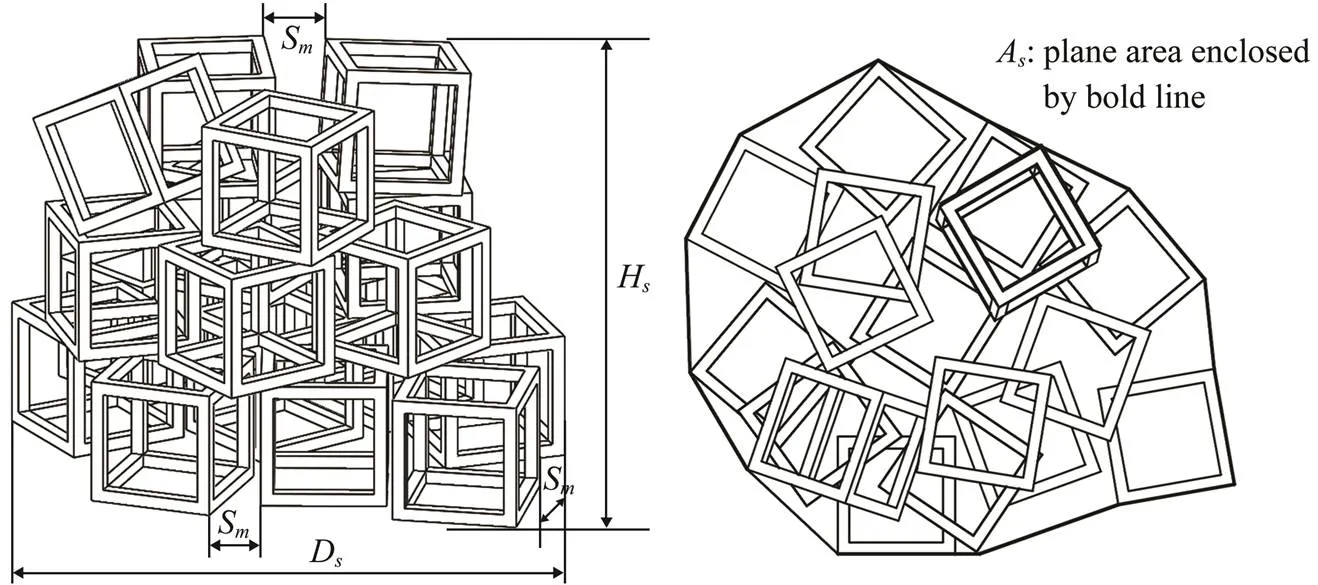
Fig.3 Irregular CTAR set consisting of multiple CTAR modules with some intervals, Sm. As is the plane area enclosed by bold lines for the bottom layer reefs in the artificial reef set.
2.2 CTAR Stacking Experiment
2.2.1 Stacking experiment setup
In this study, a CTAR (1.0m×1.0m×1.0m) was used as the prototype model. The geometric scale of the AR stacking experiment is 1:20 (=20), the dimension of the CTAR model is 50mm×50mm×50mm. The CTAR stack-ing experiments were conducted in a water tank at the Fishery Engineering Hydrodynamics Laboratory located at the Ocean University of China. The water tank is 4.0m×1.2m×1.2m (length×width×water depth), as shown in Fig.4. Considering the sandy bottom of the sea, a pallet co-vered with sand was placed at the bottom of the water tank, 1m from the surface of the water.
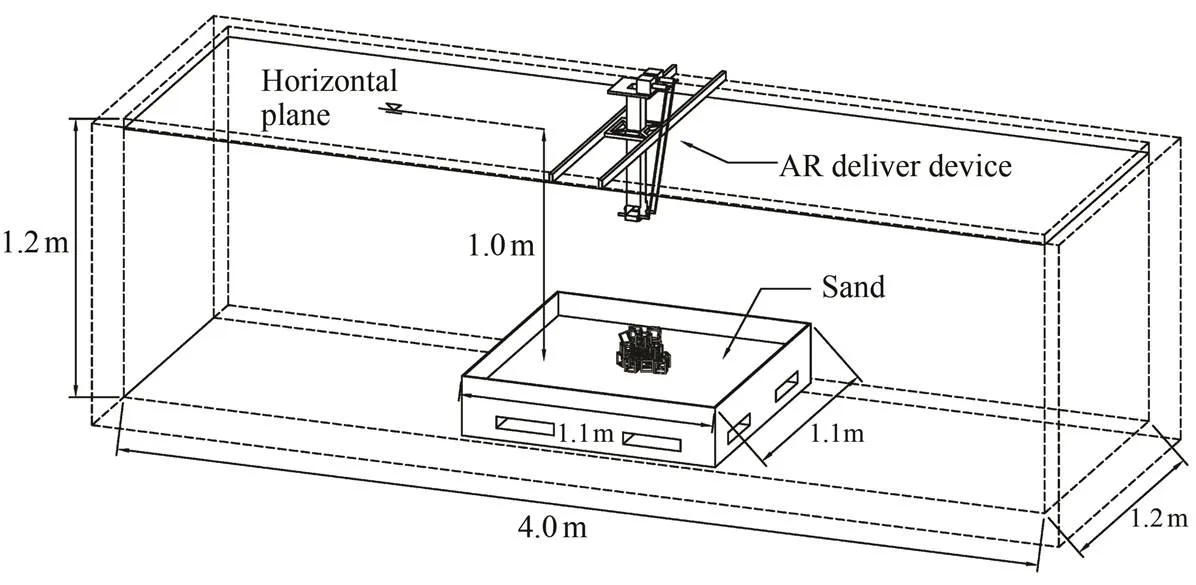
Fig.4 CTAR stacking experiment in the water tank.
2.2.2 Criterion of the stacking experiment
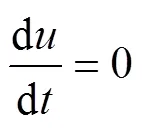

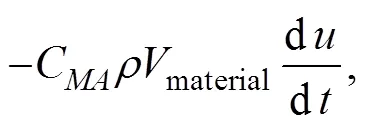
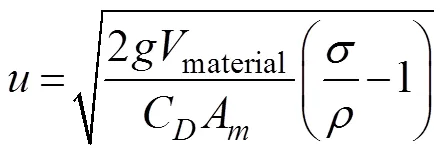
whereis the movement speed of a CTAR model in free- fall, ms−1;is the density of the water, kgm−3;is the den- sity of the CTAR material;is the gravity acceleration,=9.8ms−2;Cis the drag coefficient of a CTAR,C=2.0;Cis the add-mass coefficient,C1.0;Ais the pro- jected area of a CTAR model; andmaterialis the volume of the material comprising a single AR module.


where subscript 1 denotes the CTAR physical model (1.0m×1.0m×1.0m), and subscript 2 denotes the CTAR ex- perimental model (50mm×50mm×50mm).1=0.36m2,2=9×10⁻⁴m2,1=1030kgm−3,2=999.1kgm−3,1,material=0.136m3, and2,material=1.3×10⁻⁵m3.
The CTAR physical model was made of reinforced con- crete; thus1=2350–2600kgm−3. In accordance with Eq. (3), the CTAR experimental model was made of an alu- minum alloy; thus,2=2673–2991kgm−3. The surface of the CTAR was painted to prevent reflection.
2.3 3D Reconstruction of the CTAR Set
In the next subsections, the experimental setup and con- ditions of the present investigation are described. The ex- perimental setup used two cameras to achieve stereo vision and a linear laser transmitter as a source of vertically structured light.
2.3.1 Design of the measurement system
The main goal of the measurement system setup was to obtain the 3D point clouds, which are datasets that repre- sent the,, andgeometric coordinates of the points on the surface of a CTAR set. As shown in Fig.5, the mea- surement system consists of the following two parts:
1) a binocular stereo vision scanning system based on the linear structured light, including a linear laser trans- mitter, binocular cameras, waterproof steering gear, control- ler and filters;
2) a computer control system for manipulating the scan- ning equipment and reading and analyzing the image data.
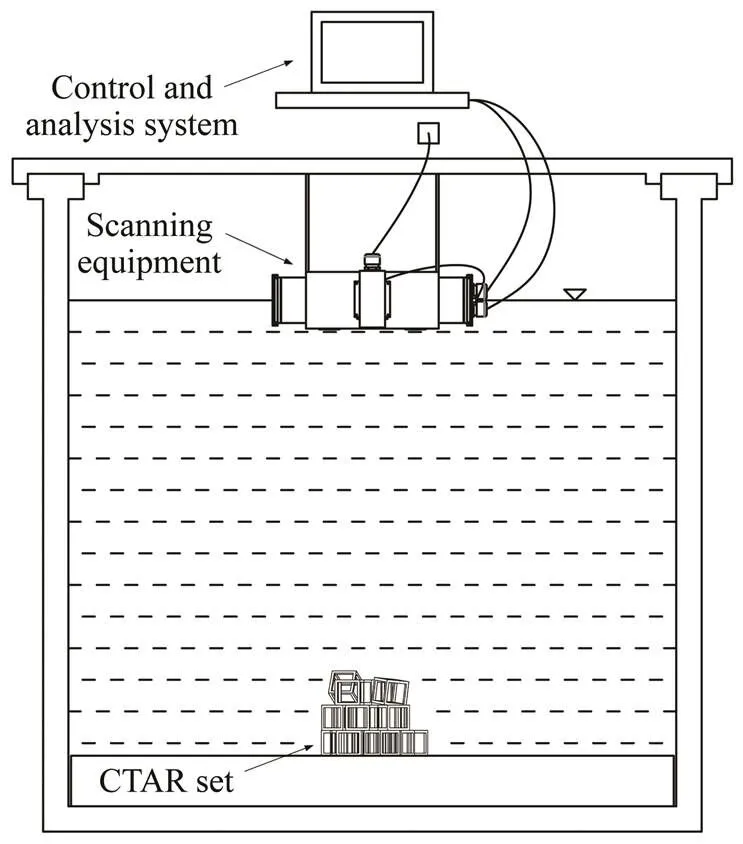
Fig.5 Sketch of the measuring system.

Fig.6 Schematic of two cameras and a linear laser transmitter.
To enhance the linear laser contrast and measurement accuracy, the water tank was covered by a black-out cloth to reduce the influence of ambient light as much as possi- ble. Fig.6 presents a schematic of the scanning equipment. The wavelength and power of the linear laser depend on the characteristics of underwater imaging. In this experiment, the linear laser used 85mW of power and a wavelength of 520nm to generate the green linear light. A pair of cameras was used to capture the CTAR set images. The two digital cameras with a 90˚ FOV measure 1/3 inch sen-sors with a resolution of 2560×960 pixels and a focal lengthof 3.6mm. The laser transmitter was driven by a Hitec HS- 5086WP waterproof servo. The board was connected to the computer control system with a USB cable, and Arduino UNO was programmed using the Arduino Software (IDE). The program for controlling the scanning system and cal- culating the three-dimensional coordinates by capturing the images was written using OpenCV 3.4 with C++. OpenCV focuses mainly on real-time image processing.
2.3.2 Three-dimensional reconstruction technique
The 3D reconstruction technique used in this study is based on the combination of stereopsis (or binocular vi-sion) and structured light. The use of structured light makes the matching of the correspondent points in the stereo pairs more effective.
Calibration is an essential step to improve the accuracy of the adopted 3D reconstruction technique. Bruno.(2011) had proven that the air calibration model could work properly in underwater conditions. Although underwater conditions have greater distortion due to the refraction ef- fects, the air calibration model can also compensate for the distortion induced by the presence of water. Therefore, we did not compare the results of calibrations performed in the air with those obtained in underwater conditions. In this experiment, we used a 25mm×25mm checkerboard (12×9 squares) to perform the calibration in the water tank. Thesystem collected 109 image pairs of the checkerboard fromdifferent positions. The images used for calibration were pro- cessed using the camera calibration toolbox in MATLAB to estimate the calibration parameters. For each image pair, the positions of the corner points of the checkerboard pat- tern were identified by clicking on the images. The cali- bration procedure written for MATLAB was used to com- pute the location of these points in the images to determine the intrinsic parameters of each camera. The intrinsic para- meters were used to correct the optical distortion resulting from the camera lenses in the individual images. The chec- kerboard pattern allowed the software to pinpoint the ex- act corner locations automatically on the basis of the co- lor contrast of the square boundaries. The checkerboard pat-tern was required to be identified in the same order in each of the synchronous image pairs to match the analo- gous corner points correctly. In Fig.7, we show the distor- tion images (a, b) and calibration images (c, d) of the chec- kerboard pattern for the left and right cameras, respec- tively. Figs.7a and b respectively show the left and right original calibration images collected by the binocular ca- mera. As shown in the figures, distortion exists in the ca- libration board and other objects in the image. Figs.7c and d respectively show the left and right two images calibrated and corrected by binocular camera.
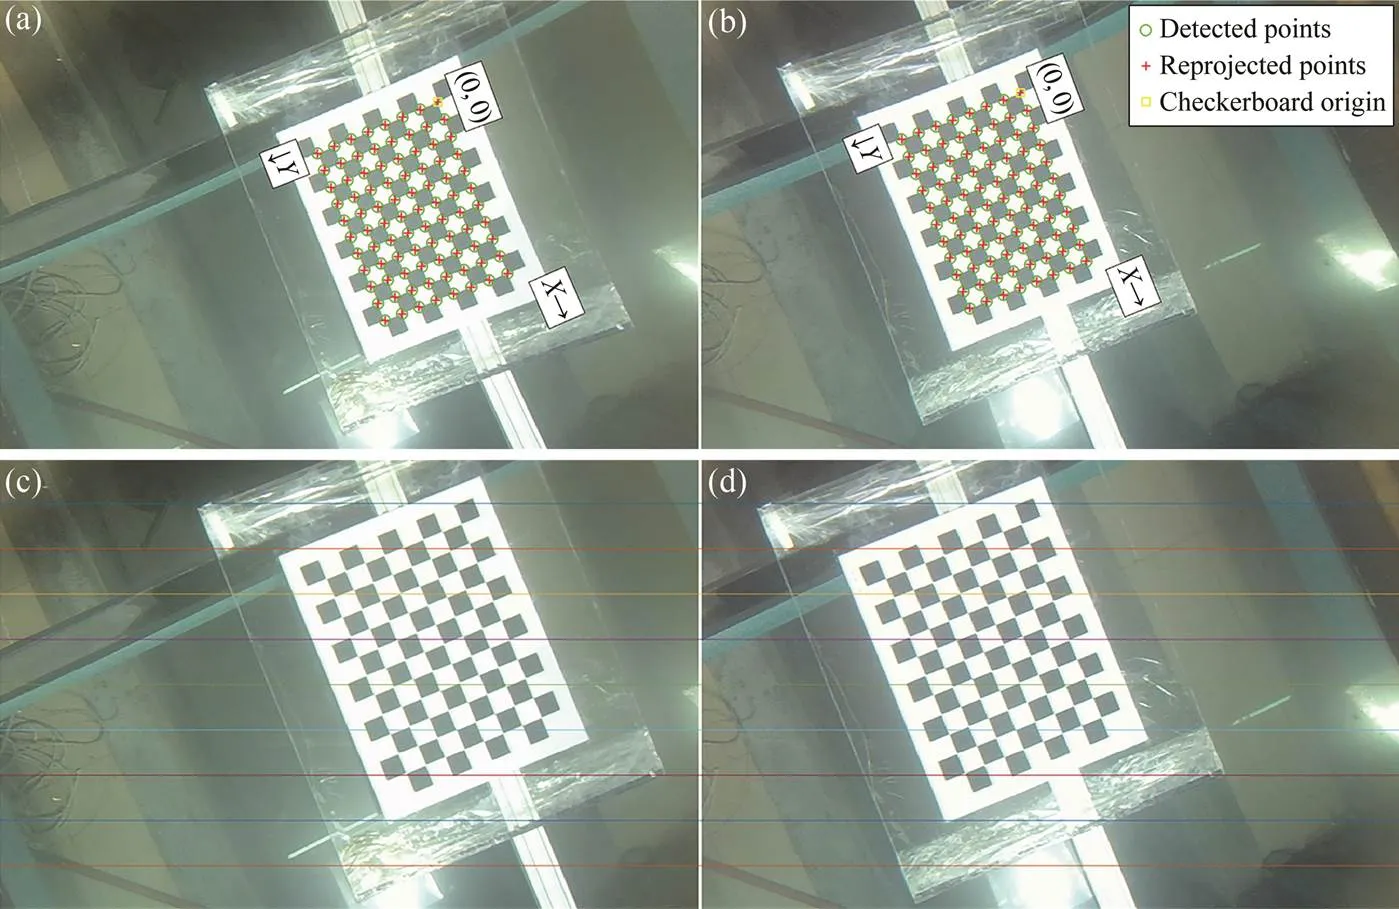
Fig.7 Checkerboard pattern used to calibrate and test the still frame stereo camera systems. (a) and (b) are the distortion images of the checkerboard pattern of the left and right cameras, respectively; (c) and (d) are the calibration images of the checkerboard pattern of the left and right cameras, respectively.
2.3.3 Alpha shape method
Through the linear structured light and the binocular ste- reo vision technology, we can obtain a set S of points in 3D of a CTAR set, we hope to obtain something like ‘theshape formed by these points’. This notion is vague, and many possible interpretations, including the alpha shape, may exist. Alpha shapes can be used for shape reconstruc- tion from a dense unorganized set of data points. Indeed, an alpha shape is demarcated by a frontier, which is a li- near approximation of the original shape (Bernardini, 1997).
The alpha shape method can be used to construct a sur- face that most closely reflects the object described by the points. Alpha shapes are generalizations of a convex hull of a finite set of points. Given a finite point set S, and a real parameter alpha (), the alpha shape of S is a poly- tope that is neither necessarily convex nor necessarily con- nected (see Fig.8). The set of all real numbersleads to a family of shapes capturing the intuitive notion of ‘crude’versus ‘fine’ shape of a point set (Edelsbrunner., 1983;Edelsbrunner and Mucke, 1994). Alpha shapes are sub- graphs of the closest or furthest point Delaunay triangula- tion.
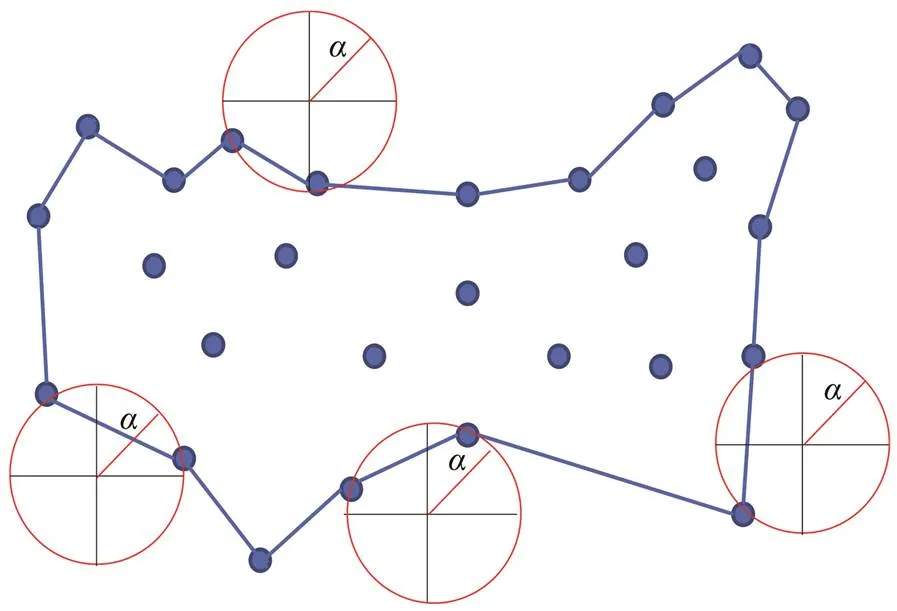
Fig.8 Alpha shape example in 2D.
The fundamental ideas of alpha-shapes are as follows:
1) A discriminant radius R, which determines the fine ness of the boundary, is set for CTAR sets (the smaller the finer).
2) For an unorganized set of points from the CTAR set, a circle with radius R is drawn through any two points, P1 and P2 (excluding the case that the distance between two points is 2R). If no other data points exist in any circle, then points P1 and P2 are considered boundary points, and the lineL1P2is the boundary line segment.
3) Fordata points,×(−1)/2 line segments, which will be judged and solved one by one, exist between them.
2.3.3.1 Shapes of CTAR sets depending on the-value

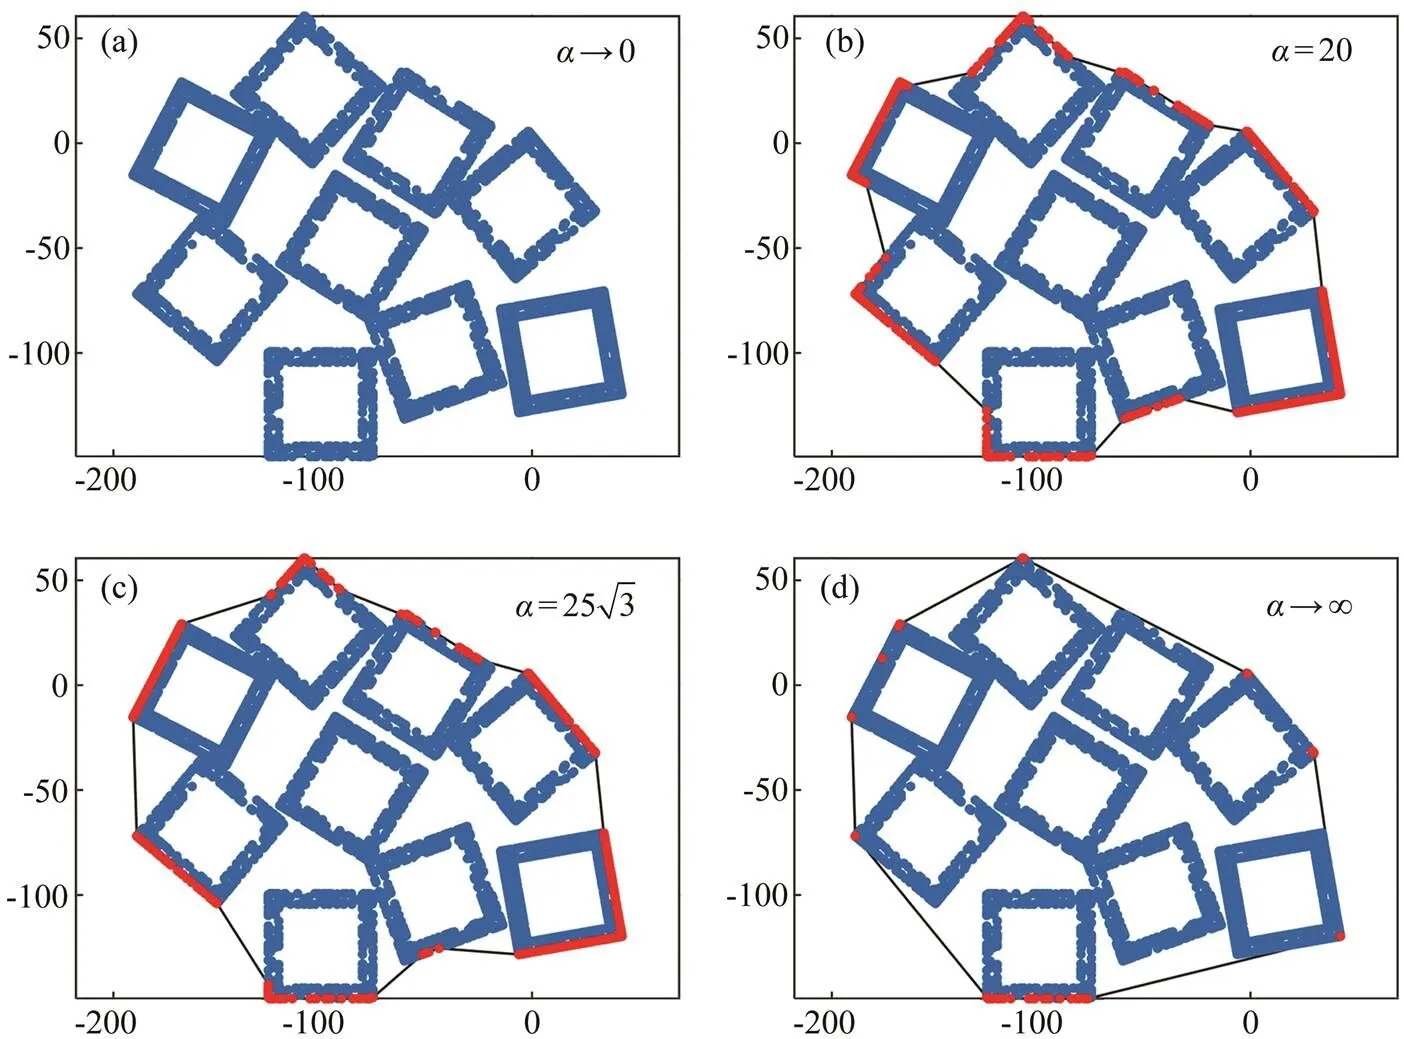
Fig.9 Alpha shapes of S for different alpha values, α.
2.3.3.2 Point cloud processing
2.3.3.3 3D measurement of the scale sizing of the CTAR set

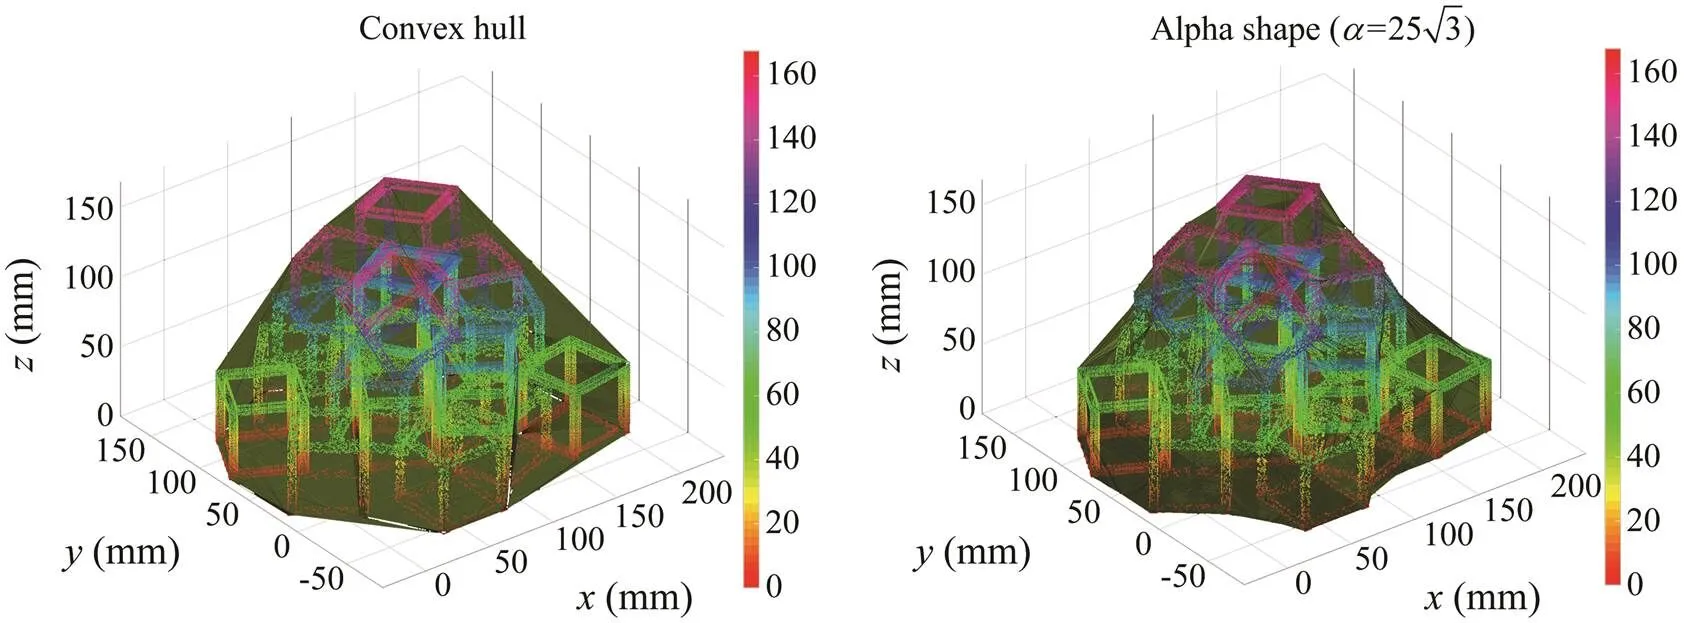
Fig.10 Convex hull of the CTAR set for different alpha values, and.
2.3.3.4 Calculation method of the scale sizing of the CTAR set
A 3D reconstruction method allows for accurate mea- surements of the volume, surface area, and other morpho- metric measurements of 3D objects. In this section, the parameters on the basis of the 3D reconstruction model of the CTAR set to estimate the scale sizing of the CTAR sets(., usable volumeV,s, surface areaA, projected areaA,p, heightHand base diameterD. For example, in Fig.2, for the single CTAR module and a regular CTAR set (eight modules), we can easily obtain the parameters of the CTAR module and CTAR set, as shown in Table 1.

Table 1 Parameters of the regular CTAR sets

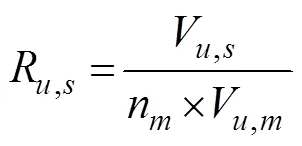
Similarly, the other parameters can be obtained by mea- suring the 3D reconstruction model of the CTAR set. In addition, the relationship between these parameters and the number of CTAR modules can be expressed as follows,
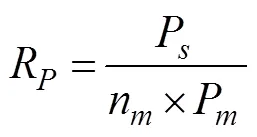
wherecan be any one of the scale parameters of the CTAR set. The subscriptdenotes the set, anddenotes a single module.
3 Results
During the stacking experiments in the water tank, we conducted at least 30 replicate tests for each group to ob- tain a precise shape of the CTAR set. Table 2 presents the valid experiment times for each group.

Table 2 Replicated test numbers
3.1 Image Calibration
During the image acquisition process of the stacking ex- periment of the CTARs, the numerous repetition characte- ristics affect image registration. Therefore, we established the measurement system by combining the binocular vi- sion system with the linear structured light along the- direction to find the corresponding points of the left and right images. In Fig.11, (a) and (b)are the pictures taken by the right and left cameras, respectively; (a') and (b') are the pictures after stereo calibration and correction. Mean- while, an adaptive weighted centroid algorithm was used to calculate the position of the light strip center. Fig.12 pre- sents the image of the CTAR set processed by using sub- pixel technology, in which the point data of the bottom were contained.
在《汽车英语》课堂中,任务是有意义的,并和真实的世界相关。所有的任务都是基于汽车行业特定工作岗位而设定的。通过系列任务的完成,学生能对今后所要从事的具体工作有一个较为明晰的概念,并大致了解如何用目标语言来应对各类工作情况,以期掌握企业所最为期望和重视的综合技能。

Fig.11 Original images and calibrated images with detect- ed subpixel peaks. (a) and (b)are the pictures taken by the right and left cameras, respectively; (a') and(b') are the pic- tures after stereo calibration and correction.

Fig.12 Scanning images of the AR set after the subpixel pro- cess.
3.2 Parameters of the Scale Sizing of the CTAR Sets


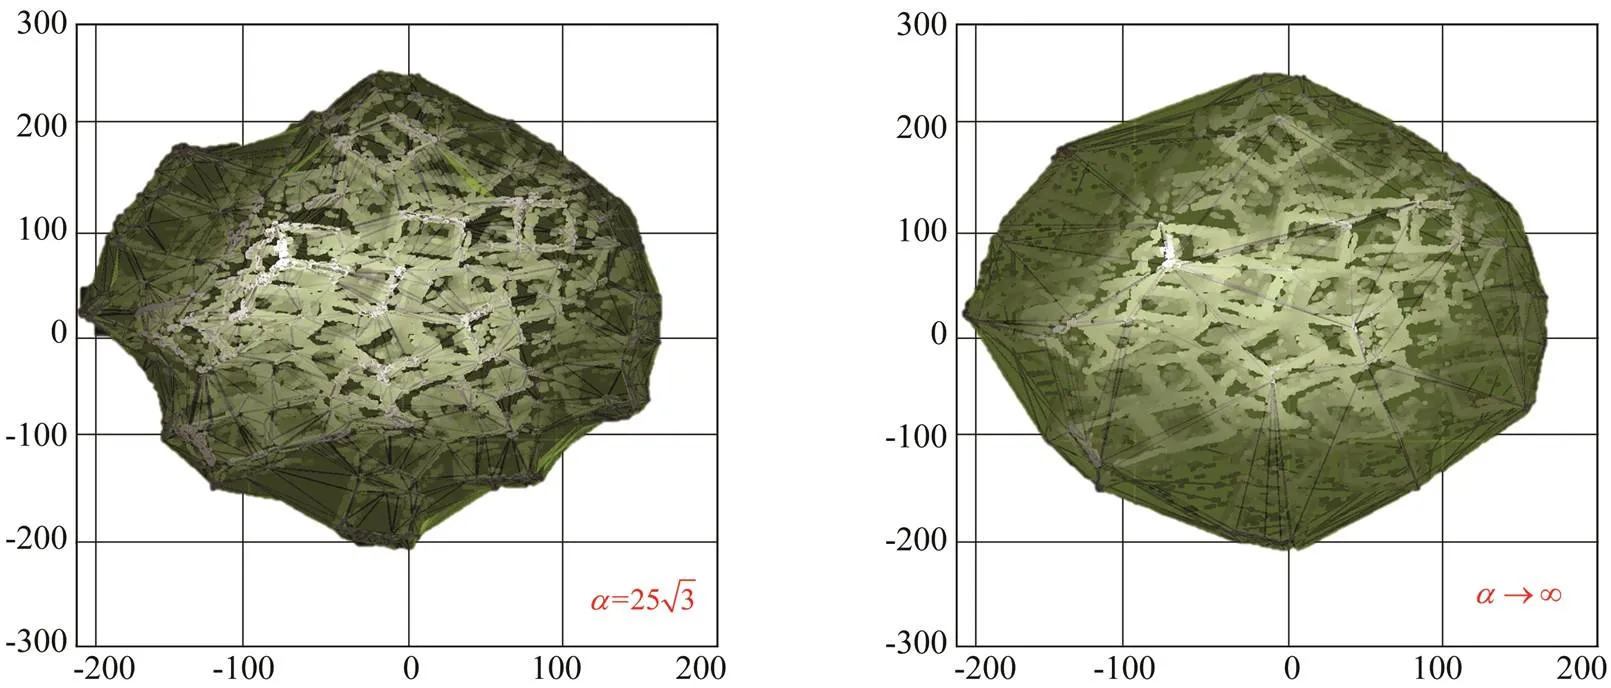
Fig.13 Alpha shape models with and α∞.
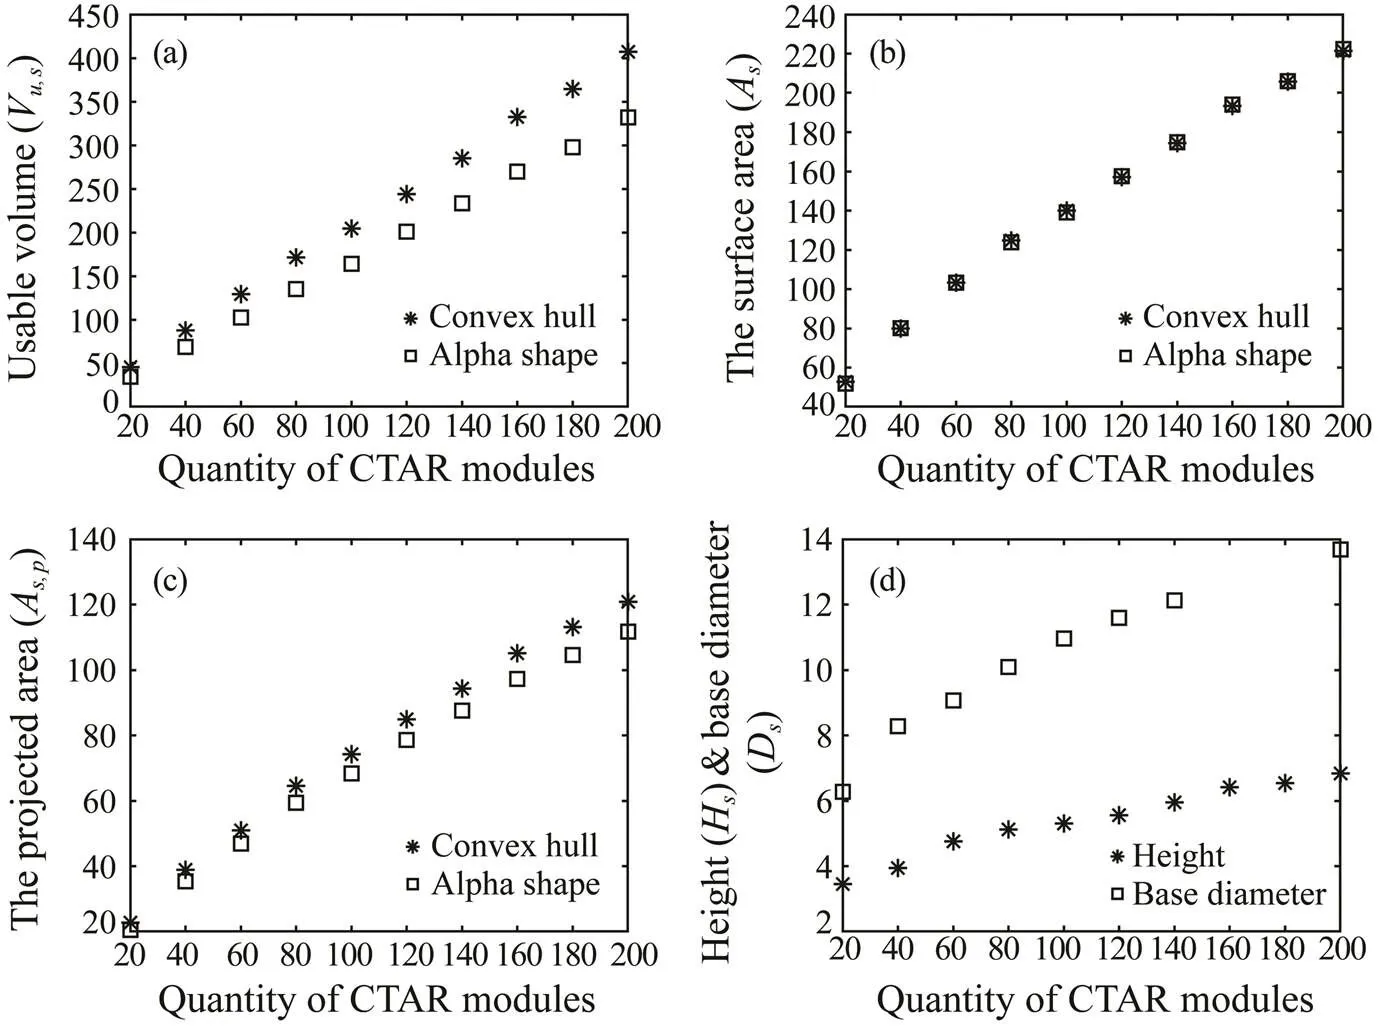
Fig.14 Mean values of the scale parameters of the CTAR sets varying the number of CTAR modules.
Through regression analysis of the numerical results by using MATLAB and SPSS software, the corresponding re- gression equations of the relationship of the parameters and the number of CTAR modules were obtained (Table 3).

Table 3 Regression equations of the scale parameters and quantity of the CTAR modules
3.3 Coefficient of the Scale Sizing of the CTAR Sets

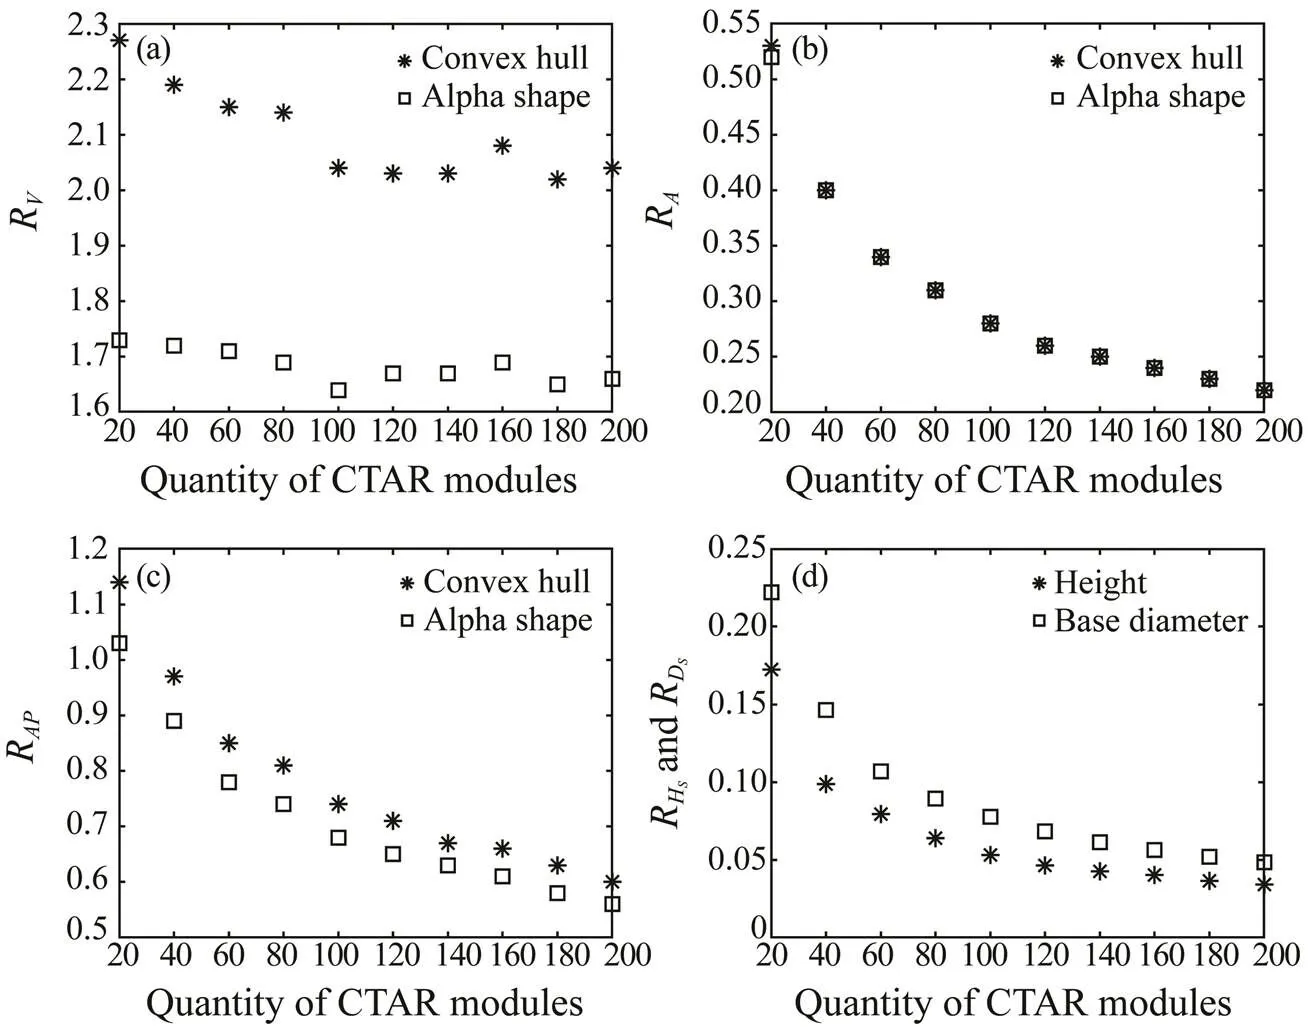
Fig.15 Mean values of the scale parameters of the CTAR set varying the number of the CTAR.
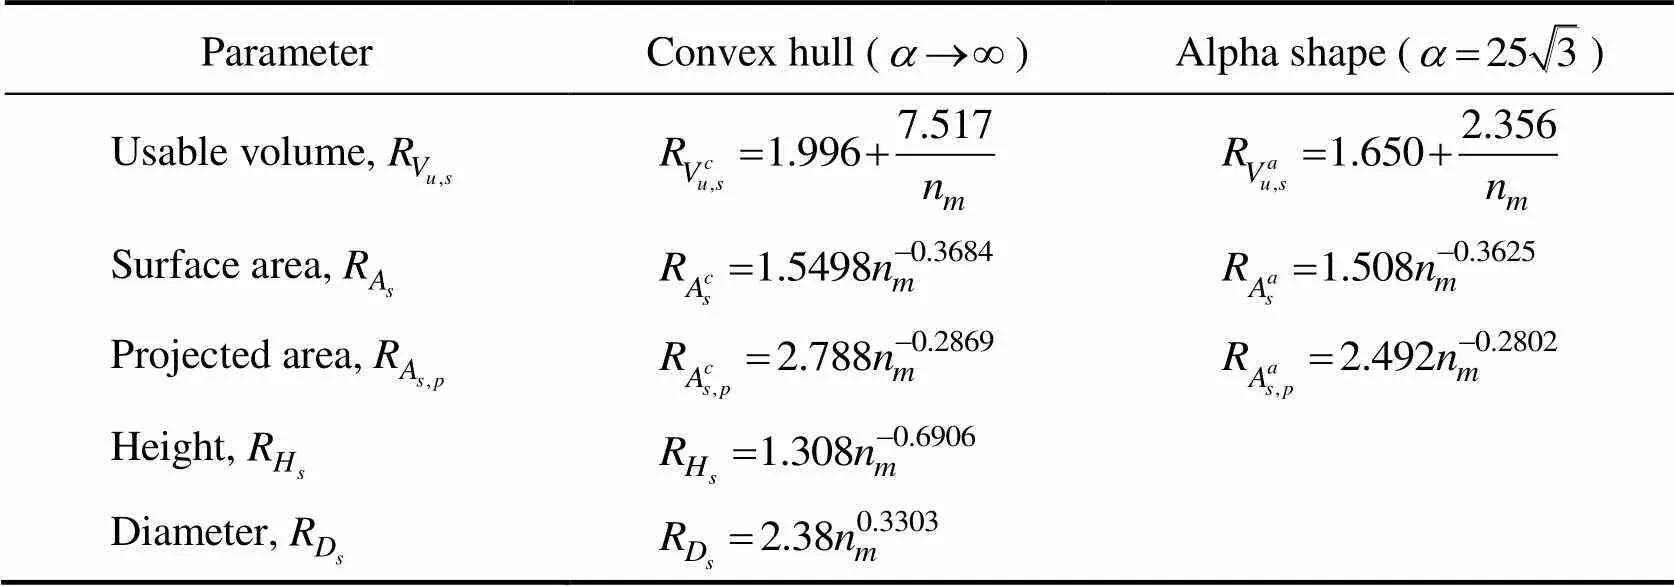
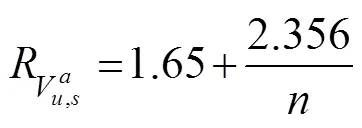
Table 4 Coefficients of the scale parameters of the CTAR set

Fig.16 Distribution of the coefficient of the usable volume under different alpha values. (a), coefficients of the Vu,sfor the convex hull model; (b), coefficient of the Vu,s for the alpha shape model.
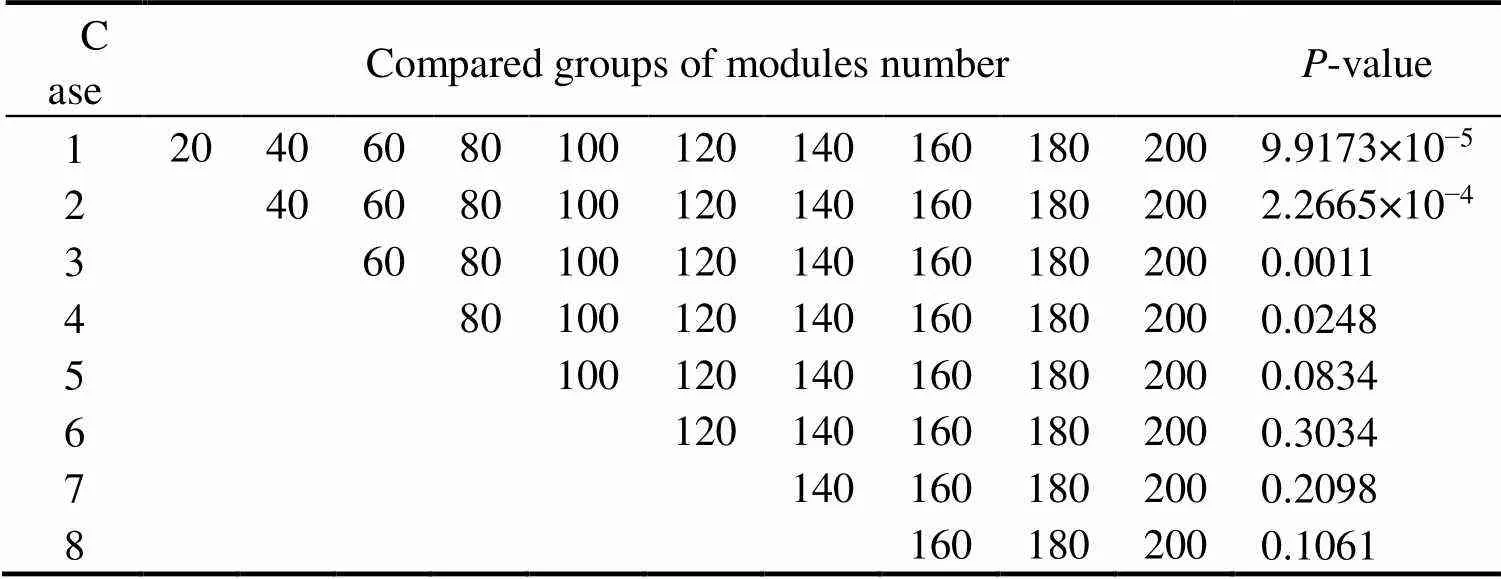
Table 5 Comparison of groups of module numbers for distribution difference tests
3.4 Prediction of the Number of CTAR Modules in the Bottom Layer


Whenn=20, the calculated number of modules in the bottom layer was consistent with the result of the water tank test. For the CTAR set composed of 100 modules, the bottom layer has 40.97% of the total modules. The re- sult is consistent with the marine investigation data, which resulted in 40% (Yoon., 2016). Therefore, we con- clude that Eq. (7) can accurately predict the number of modules in the bottom layer for different CTAR sets. Ta- ble 6 presents the number of modules in the bottom layer for different CTAR sets.
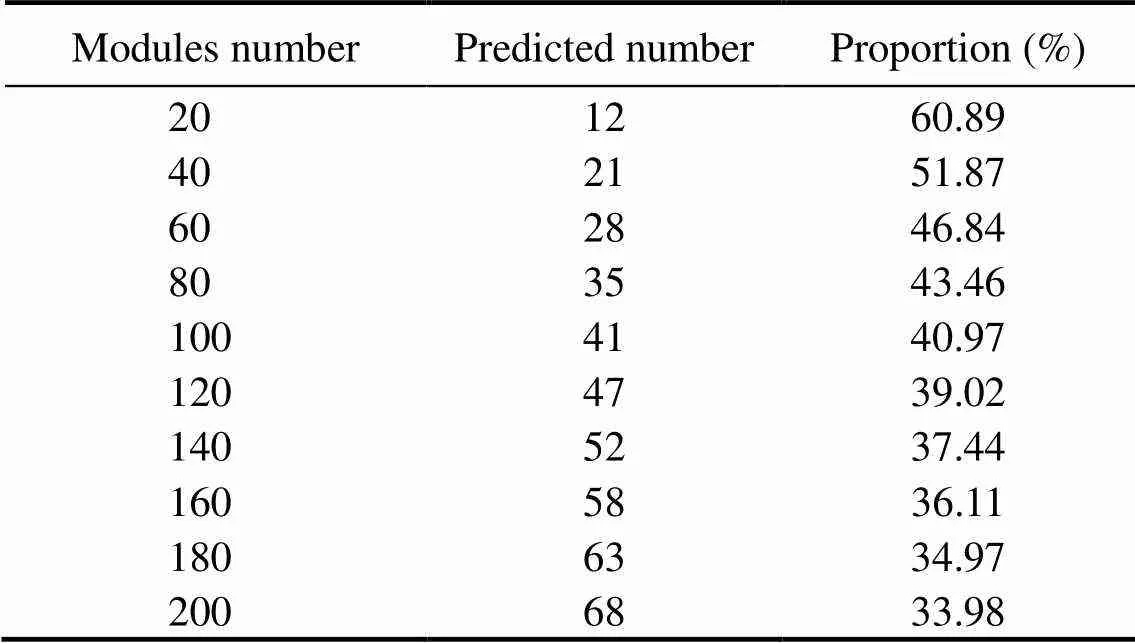
Table 6 Prediction of the module number for the bottom layer of the CTAR set
4 Discussion

The design and selection of AR modules greatly affect the performance of AR deployment. Studies on the effect of AR stacking are still in the early stage in China. From the relationship between the scale of the CTAR set and the number of CTAR modules, the following opinions are sug- gested for the construction and management of AR sites: First, in the construction stage of AR deployment, the pre- dictive scale parameters of the AR set can help relevant go- vernment departments in determining how many AR mo- dules should be added to establish an AR set. Second, the prediction also helps the government select a proper site to maximize the biological effect of the ARs, such as species attraction and ecosystem restoration.
5 Conclusions
This research successfully set up an experiment to ex- plore the three-dimensional reconstruction of a CTAR set by combining structured light and binocular stereo vision technology in an underwater environment. The developed 3D reconstruction method allows us to measure the usable volumeV,s, surface area (A), projected area (A,p), height (H), and base diameter (D) of the CTAR set composed of 20 to 200 CTAR modules. Second, the prediction also helps the government select a proper site to maximize the biological effect of the ARs, such as species attraction and ecosystem restoration.
Acknowledgements
This research was supported by the National Key R&D Program of China (No. 2019YFD0901302) and the National Natural Science Foundation of China (No. 31802349).
Baillard, C., Schmid, C., Zisserman, A., and Fitzgibbon, A., 1999. Automatic line matching and 3D reconstruction of buildings from multiple views.. Munich, Germany, 69-80.
Baine, M., 2001. Artificial reefs: A review of their design, ap- plication, management and performance., 44 (3-4): 241-259.
Bernardini, F., 1997. Sampling and reconstructing manifolds us- ing alpha-shapes. Purdue University. Report number: 97-013.
Bohnsack, J., and Sutherland, D., 1985. Artificial reef research: A review with recommendations for future priorities., 37: 11-39.
Boswell, K. M., Wells, R. J. D., Cowan, J. J. H., and Wilson, C. A., 2010. Biomass, density, and size distributions of fishes asso- ciated with a large-scale artificial reef complex in the Gulf of Mexico., 86 (4): 879-889.
Brickhill, M. J., Lee, S. Y., and Connolly, R. M., 2005. Fishes as- sociated with artificial reefs: Attributing changes to attraction or production using novel approaches., 67: 53-71.
Bruno, F., Bianco, G., Muzzupappa, M., Barone, S., and Ration- ales, A. V., 2011. Experimentation of structured light and ste- reo vision for underwater 3D reconstruction., 66 (4): 508-518.
Chan, Y., and Walmsley, R. P., 1997. Learning and understanding the Kruskal-Wallis one-way analysis-of-variance-by-ranks test for differences among three or more independent groups., 77 (12): 1755-1762.
Charbonnel, E., Francour, P., Harmelin, J. G., Ody, D., and Bachet, F., 2000. Effects of artificial reef design on associated fish as- semblages in the Côte Bleue Marine Park (Mediterranean Sea, France). In:. Jensen, A.,., eds.,Springer, Dordrecht, 365-377.
Chittaro, P., 2002. Species-area relationships for coral reef fish assemblages of St. Croix, US Virgin Islands., 233: 253-261.
Cookson, M. J., Davies, C. J., Entwistle, A., and Whimster, W. F., 1993. The microanatomy of the alveolar duct of the human lungimaged by confocal microscopy and visualized with computer- based 3D reconstruction., 17 (3): 201-210.
Edelsbrunner, H., and Mucke, E. P., 1994. 3-dimensional alpha- shapes., 13 (1): 43-72.
Edelsbrunner, H., Kirkpatrick, D., and Seidel, R., 1983. On the shape of a set of points in the plane., 29: 551-559.
Firth, L. B., Knights, A. M., and Bridger, D., 2016. Ocean sprawl: Challenges and opportunities for biodiversity management in a changing world., 54: 189- 262.
Grove, R. S., and Sonu, C. J., 1983. Review of Japanese fishing reef technology. Southern California Edison Company, Rose- mead, CA 91770, Technical Report. 83-RD-137: P112.
Huang, X., Wang, Z., Liu, Y., Hu, W., and Ni, W., 2016. On the use of blast furnace slag and steel slag in the preparation of green artificial reef concrete., 112: 241-246.
Jensen, A., 2002. Artificial reefs of Europe: Perspective and fu- ture., 59: 3-13.
Jordan, L. K. B., Gilliam, D. S., and Spieler, R. E., 2005. Reef fish assemblage structure affected by small-scale spacing and size variations of artificial patch reefs., 326 (2): 170-186.
Kheawwongjan, A., and Kim, D. S., 2012. Present status and pro- spects of artificial reefs in Thailand., 57: 21-33.
Kim, C. G., Lee, J. W., and Park, J. S., 1994. Artificial reef designsfor Korean coastal waters., 55: 858- 866.
Kim, D., Woo, J., Na, W. B., and Yoon, H. S., 2014. Flow and struc-tural response characteristics of a box-type artificial reef., 26 (3): 113-119.
Kim, H. S., Kim, C. G., Na, W. B., and Kim, J. K., 2008. Chemi- cal degradation characteristics of reinforced concrete reefs in South Korea., 35 (8-9): 738-748.
Le Diréach, L., Astruch, P., Bonhomme, D., Bonhomme, P., Fourt, M., Rouanet, E.,., 2015. Comparative assessment of the deployment of 6 artificial reef types in Marseille Prado Bay (France) from a five-year seasonal survey of fish fauna.. Caen, France.
Lima, J. S., Zalmon, I. R., and Love, M., 2019. Overview and trends of ecological and socioeconomic research on artificial reefs., 145: 81-96.
Pickering, H., and Whitmarsh, D., 1997. Artificial reefs and fish-eries exploitation a review of the ‘attraction versus production’ debate, the influence of design and its significance for policy, 31: 39-59.
Pickering, H., Whitmarsh, D., and Jensen, A., 1998. Artificial reefs as a tool to aid rehabilitation of coastal ecosystems: Investiga- ting the potential., 37: 505-514.
Polovina, J. J., and Sakai, I., 1989. Impacts of artificial reefs on fishery production in Shimamaki, Japan., 44: 997-1003.
Seaman, J., and Jensen, A., 2000. Purposes and practices of arti- ficial reef evaluation. In:. CRC Press, New York, 1-19.
Seaman, W., and Lindberg, W. J., 2009. Artificial reefs. In:. 2nd edition. Steele, J. H., ed., Aca- demic Press, San Diego, 226-233.
Sheehy, D., 1979. Fisheries development: Japan.. Winter 1979.
Sherman, R., 2002. Artificial reef design: Void space, complexity,and attractants., 59: S196- S200.
Sui, J., Zheng, Z., Chang, Z., and Yu, Z., 2016. Dynamics analy- sis on the deployment of a frame-type artificial reef., 43: 74-79 (in Chinese with English abstract).
Sutton, S. G. B., and Sally, L., 2007. Socio-economic aspects of artificial reefs: Considerations for the Great Barrier Reef Ma- rine Park., 50 (10): 829-846.
Wallace, D. L., 2012. Simplified beta-approximations to the Kru- skal-Wallis H test., 54 (285): 225-230.
Williams, K., Rooper, C., and Towler, R., 2010. Use of stereo ca-mera systems for assessment of rockfish abundance in untrawl- able areas and for recording pollock behavior during midwa- ter trawls.–, 108: 352-362.
Yoon, H. S., Kim, D., and Na, W. B., 2016. Estimation of effec- tive usable and burial volumes of artificial reefs and the pre- diction of cost-effective management., 120: 135-147.
Zisserman, A., Fitzgibbon, A., and Cross, G., 1999. VHS to VRML: 3D graphical models from video sequences.. Florence, Italy, 51-57.
. E-mail: wxinxin@ouc.edu.cn
September 3, 2020;
October 9, 2020;
February 9, 2021
© Ocean University of China, Science Press and Springer-Verlag GmbH Germany 2021
(Edited by Qiu Yantao)
猜你喜欢
杂志排行
Journal of Ocean University of China的其它文章
- Numerical Modelling for Dynamic Instability Process of Submarine Soft Clay Slopes Under Seismic Loading
- DcNet: Dilated Convolutional Neural Networks for Side-Scan Sonar Image Semantic Segmentation
- Bleaching with the Mixed Adsorbents of Activated Earth and Activated Alumina to Reduce Color and Oxidation Products of Anchovy Oil
- The Brown Algae Saccharina japonica and Sargassum horneri Exhibit Species-Specific Responses to Synergistic Stress of Ocean Acidification and Eutrophication
- Effects of Dietary Protein and Lipid Levels on Growth Performance, Muscle Composition, Immunity Index and Biochemical Index of the Greenfin Horse-Faced Filefish (Thamnaconus septentrionalis) Juvenile
- Transcriptome Analysis Provides New Insights into Host Response to Hepatopancreatic Necrosis Disease in the Black Tiger Shrimp Penaeus monodon
