Ni-Fe合金泡沫的制备及电解水析氧性能研究
2021-07-29杨肖萌李作鹏武美霞刘佳丽马彦青
杨肖萌 ,李作鹏,* ,秦 君 ,武美霞 ,刘佳丽 ,郭 永 ,马彦青 ,冯 锋,*
(1. 山西大同大学化学与化工学院,山西 大同 037009;2. 天津大学纳米颗粒和纳米系统国际研究中心,天津 300072)
With the rapid growth of sustainable energy such as wind and solar power, it becomes more and more important to utilize renewable energy more efficiently and stably. Electrochemical splitting water into hydrogen driven by renewable wind and solar energy provides an environmentally-friendly, carbon free and sustainable pathway to meet the ever-increasing energy demand[1-3]. However, since the anode oxygen evolution reaction (OER) involves four consecutive proton coupling electron transfer reactions and oxygen-oxygen bond formation processes, the reaction is slow and needs higher positive voltage, which greatly hinders large-scale water electrolysis[4-6]. Hence, the crucial challenge is how to reduce the overpotential of OER,and figuring out this issue by employing catalyst is a feasible approach. So far, the state-of-the-art OER catalyst both in alkaline and acidic solutions is IrO2,which is located on the top of the volcano plot due to its excellent activity and stability. However, IrO2still suffers a considerable OER overpotential, meanwhile,the wide utilization of IrO2is hindered by its high cost and rare abundance on the earth[7-9]. Therefore, it is highly desirable to design cost-effective catalysts for water splitting by using non-noble metals.
Up to now, various low-cost alternatives have been investigated to catalyze OER, including metal oxides[10-12], hydroxides[13,14], chalcogenides[15,16],phosphate[17]and perovskites[18,19]. However, further improvement is needed in terms of activity, stability and cost. Recently, 3d-transition metal (oxy)hydroxides have received tremendous attention due to many advantages such as earth abundance, low-cost and high catalytic activity[13,14,20]. Among these catalysts, Fe-doped Ni (oxy)hydroxides are the most active electrocatalysts known for the oxygen evolution reaction in alkaline electrolytes, more efficient than pure NiOOH or Ni(OH)2[21]. However, the poor electrical conductivity of these materials has seriously led to the higher overpotential when applying to the commercial electrochemical splitting water. Meanwhile, the problem of long term stability urgently need to be solved. In order to improve the intrinsic conductivity of electrocatalysts, NiFe alloy catalysts for OER were developed. For example, some groups developed FeNi alloy nanosphere embedded in carbon materials or nitrogen-doped nanocarbon hybrid catalysts with highly active and low-cost for oxygen evolution reaction. Lyu et al[22]reported that FeNi3@NC is more catalytically active than the same system covered by three N-doped carbon layers from density functional theory (DFT) calculations. Ma et al[23]synthesized FeNi/NiFe2O4@NC hollow microcubes from bimetal MOFs which exhibited excellent electrocatalytic performances toward OER in alkaline media. Although the NiFe alloy/carbon materials composite catalysts exhibit excellent electrocatalytic performance toward OER, it is inevitable that an binder will be used to construct electrode, which may deteriorate conductivity and stability of the fabricated electrode, further affect the catalytic activity of electrocatalysts, especially for industrial applications. In this work, we developed a synthetic strategy of NiFe alloy foam for OER, which was much more convenient for water splitting in alkaline media for industrial applications due to the absence of binders and any complex electrode preparation processes.
1 Experimental
1.1 Preparation of NiFe alloy foam
The Ni-Fe alloy foam was prepared via coelectrodeposition method and removal of template method according to the literature[30]. As shown in Figure 1, the polyurethane sponge (2 mm thick) used as the electrodeposition template was firstly purified with a 0.1 mol/L KMnO4and 0.1 mol/L H2SO4, respectively.Then it was immersed in a reducing solution of 0.5 mol/L oxalic acid for 30 min, finally washed with deionized water for three times. Electroless plating was used to treat the conductive sponge. The composition of the applied plating solution was NiSO4·6H2O (25 g/L),Na4P2O7·10H2O (50 g/L), NaH2PO2·H2O (25 g/L), and water with a pH value of 10.0-11.0. The plating reaction was conducted at 30 °C for 30 min. Electrodeposition of Ni-Fe alloy on treated organic foam was conducted with constant current electrolysis (~400 A/m2). The specific composition of the applied plating electrolyte solution was FeSO4·7H2O + NiSO4·6H2O (300 g/L),NaCl (8 g/L), H3BO3(30 g/L), Na2SO4(60 g/L) and MgSO4(50 g/L). The pH value of the plating solution was 5.0-5.5, and the plating temperature was 25 °C.The Ni∶Fe ratio of Ni-Fe alloy can be adjusted according to the change of FeSO4·7H2O and NiSO4·6H2O. After electroplating for 1.0-2.0 h, a bright and metallic porous Ni-Fe alloy was obtained. Then, the porous Ni-Fe alloy was placed in an air oven at 600 ℃ for 4 min to remove the organic foam. Then the product was subjected to the reductive sintering at 850 °C for 40 min under a reductive atmosphere of NH3.
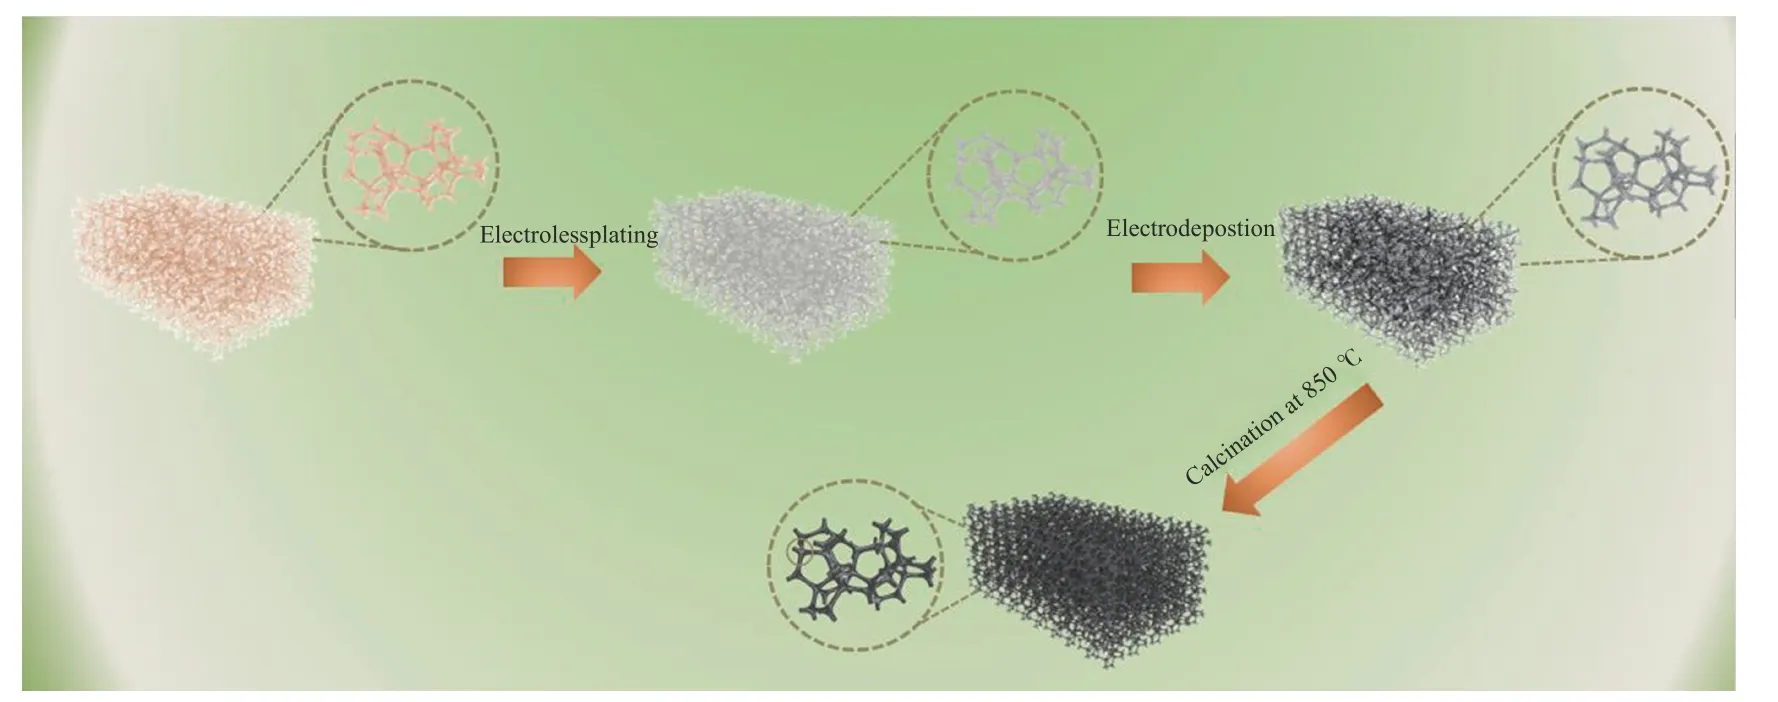
Figure 1 Synthesis process for NiFe alloy foam
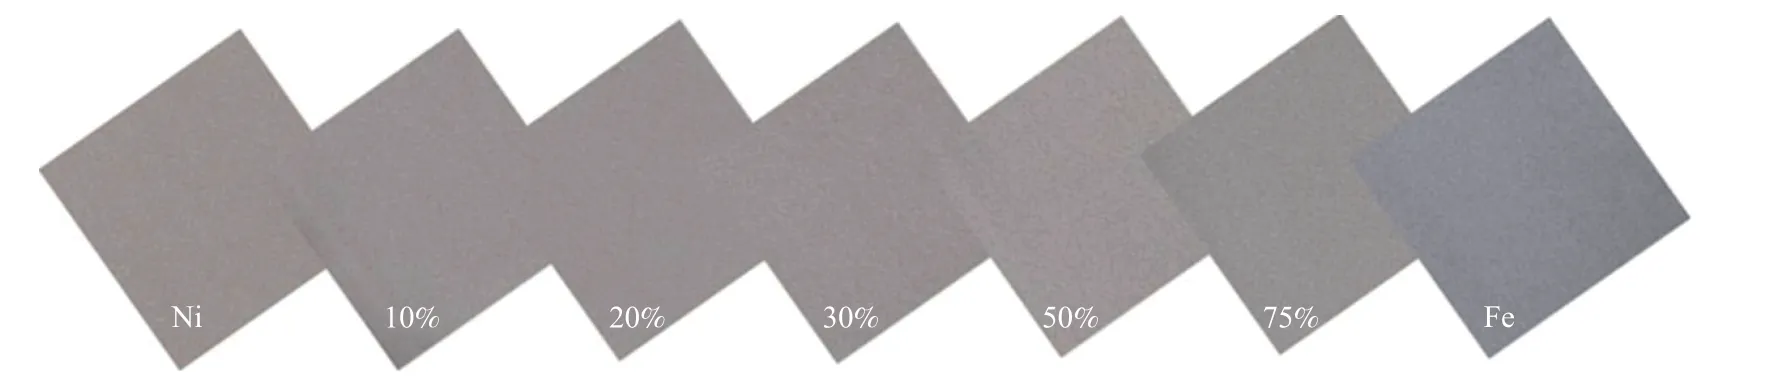
Figure 2 Morphology of Ni-Fe alloy foam with different Fe content
1.2 Physical measurements
The morphology and elemental mapping of the prepared samples were observed by scanning electron microscopy (SEM) (TESCAN MAIA3, Czekh) coupled with energy-dispersive X-ray spectroscopy (EDX),which was operated at an accelerating voltage of 3.0 kV.The compositions of the as-prepared samples were analyzed by inductively coupled plasma analysis (ICP Varian 720). X-ray powder diffraction (XRD) was performed using a Bruker D8-advance X-ray diffractometer with graphite-monochromatized CuKα radiation.
1.3 Electrochemical measurements
Electrochemical measurements were performed on a CHI760E electrochemical workstation (CH Instruments, Inc., Shanghai) in a standard three-electrode system, using NiFe alloy foam (0.25 cm2) as working electrode. Before the OER performance test, the electrode was soaked in 0.5 mol/L HCl solution for 5 min, then rinsed with deionized water, and dried. A Pt foil electrode (1 cm2) and an Ag/AgCl electrode were served as the counter and reference electrode,respectively. In all measurements, the Ag/AgCl reference electrode was calibrated with respect to reversible hydrogen electrode (RHE) according toE(RHE)=E(Ag/AgCl)+0.204+0.059pHin 1.0 mol/L KOH. The overpotential (η) was calculated byE(RHE)-1.23V. Linear sweep voltammetry (LSV)measurements were conducted in the electrolyte at scan rate of 5 mV/s.I-tcurve was recorded at +0.443V (vsRHE) for 4000 min. Electrochemical impedance spectroscopy (EIS) measurements were performed on Zahner electrochemical workstation (Cimps-2, Germany)by applying an AC voltage of 10 mV amplitude in a frequency range from 0.01 Hz to 100 kHz at 1.50 V (vsRHE).
2 Results and discussion
All samples were firstly compared in appearance.As shown in Figure 2, the prepared Ni-Fe alloy foam showed gray color and metallic luster, and the color of samples gradually turned dark with the increase of Fe content from 0 to 100%.
The influence of different Fe content on morphology is further investigated by SEM. Figure 3(a)shows the surface microstructure of pure nickel foam,which is relatively smooth and no impurities, and seems to be somewhat different to that of NiFe alloy foam. Figure 3(b)-(f) display the detailed morphology characteristics of Ni-Fe alloy foam with various Fe content at higher magnification. It is noteworthy that Fe content has great impact on the morphology of NiFe alloy foam. As shown in Figure 3(b)-(c), SEM micrographs of NiFe alloy foam with low Fe content(20% and 30%) exhibit much uneven and crude surface opening to the environment, which is like rolling hills in the range from 200 nm to 1 μm. Meanwhile, crude surface is believed to provide an increased specific surface area, which plays a key role to improve electrocatalytic properties. When elevating Fe content,the crude surface disappears, as seen in Figure 3(d)-(e). Comparing with pure Ni or NiFe alloy foam, the surface of pure Fe foam has quiet difference morphology, which is very rough and irregular, and a large part of the surface shows many cracks,resembling the shape of burned charcoal, indicating that the crystallinity of pure Fe is very low, as shown in Figure 3(f). Figure 3(a′)-(f′) display 3d cross-linked skeleton of NiFe alloy foam at a lower magnification,which is expected to allow the efficient contact between catalysts and electrolyte and facilitate the easy release of generated O2gas during OER activity.Especially for the Figure 3(b)-(c) of NiFe alloy foam with low Fe content, crude and uniform surface clearly increases the working area, which can further elevate the catalytic activity for OER.
The morphology of Ni-Fe alloy foam with 30% Fe content is further analyzed concretely by SEM with different magnification illustrated in Figure 4(a)-(c).There are some fine particles in Figure 4(a)-(b)decorated on the surface of the three-dimensional reticulated structure (Figure 4(c)), which can be attributed to the aggregation of Ni-Fe deposition. In addition, the composition of the certain point on Ni-Fe alloy foam is demonstrated by EDS displayed in Figure 4(e)-(g), and two elements, Ni and Fe, are detected in EDS spectrum. Meanwhile, it is clear that the ratio of Ni/Fe trends to be consistent in randomly selected spectrum 1 and spectrum 2, indicating that the Fe and Ni elements of the sample are uniformly distributed on the surface. This result can also be confirmed by element mapping. It can be seen from Figure 4(d) that Fe is distributed loosely on polyurethane sponge while nickel is distributed closely. The reason is that the content of Ni in the NiFe alloy is 70%, which is twice than the iron content. Therefore, the distribution of Ni and Fe elements on the entire structure is relatively uniform. For oxygen element, because the exposed area of corners of the structure is relatively large compared with other places, part of Ni and Fe elements are oxidized during the pretreatment, resulting in a dense distribution of oxygen element here.
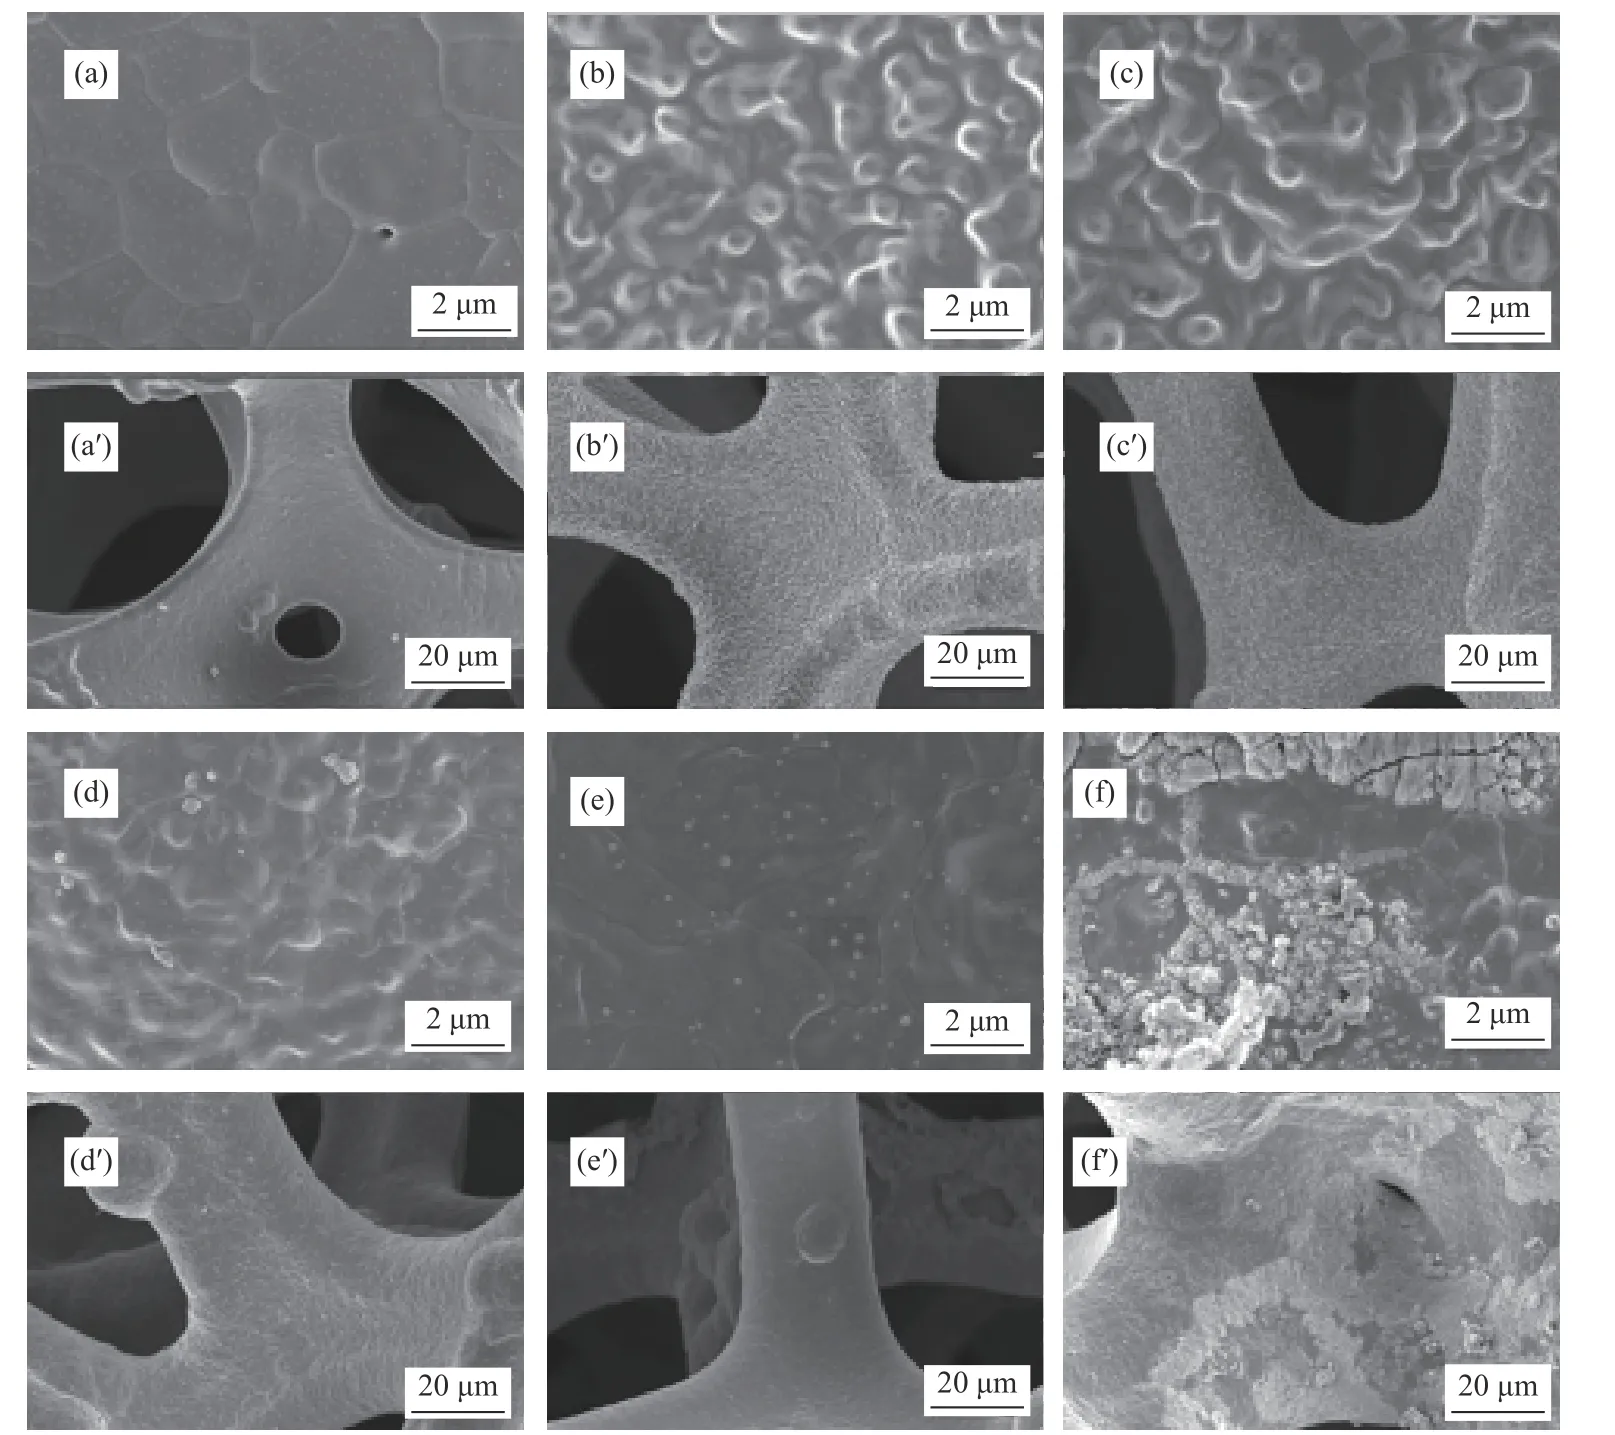
Figure 3 Scanning electron microscopy (SEM) micrograph for pure Ni and NiFe alloy foam with different Fe content (20%, 30%, 50%, 75%, 100%) at different magnification (2 μm and 20 μm)
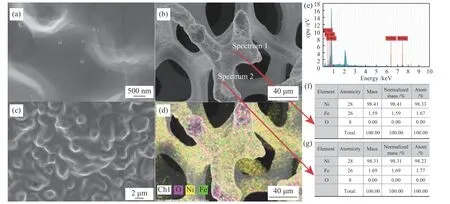
Figure 4 SEM((a)-(c)), mapping (d) and EDS((e)-(g)) for NiFe alloy foam with 30% Fe content
XRD contributed to analyzing all samples to obtain related information and thereby confirm the crystalline phases. As shown in Figure 5, there are two distinct diffraction peaks in pure iron, one of which at 44.7° is intense, the other at 64.9° is weak,corresponding to (110) and (200) crystal planes of Iron,respectively. Otherwise, no Fe peak appears on the catalysts with different Fe content , suggesting that Fe has been alloyed with Ni. There are three obviously sharp diffraction peaks located at 44.5°, 51.8°and 76.4°for NiFe alloy foam, corresponding to (111), (200) and(220) crystal planes of the face-centered cubic (fcc)phase of Ni3Fe, which is in agreement with SEM mapping, and further confirms the formation of Ni3Fe in NiFe alloy foam[24,31]. Further, it is observed that as Fe content increases from 10% to 75%, intensity of(111), (220) and (200) decreases, indicating that the crystallinity decreases[25].
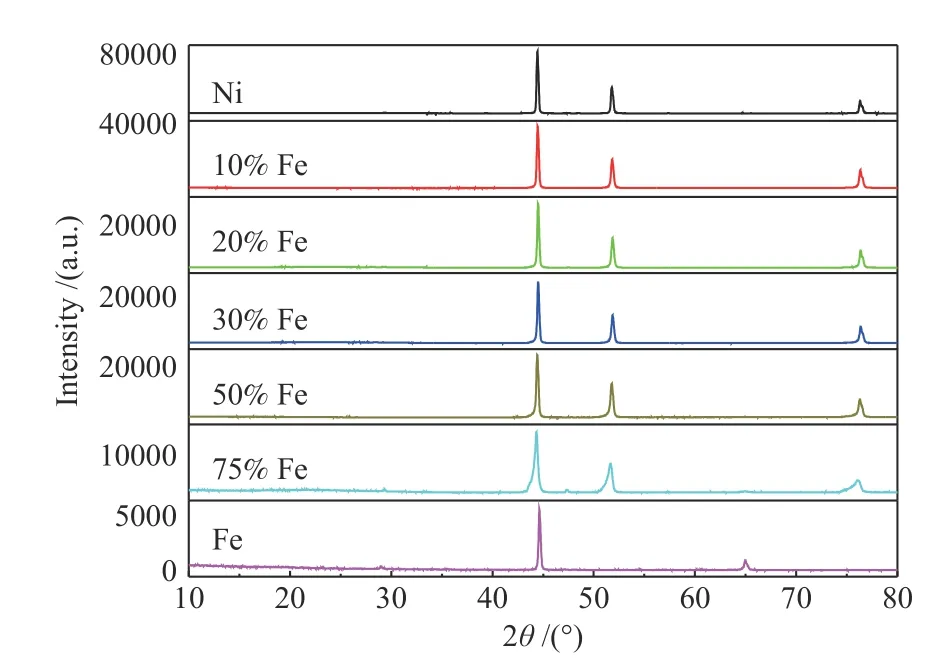
Figure 5 XRD patterns of Ni-Fe alloy foam with different Fe content
The electrocatalytic performance of all the catalysts was evaluated in 1 mol/L NaOH aqueous solution with a three-electrode system. Figure 6(a)shows the LSV curves of the NiFe alloys without any treatment. It is observed that except pure Fe, all catalysts shows an oxidation peak at around (1.35-1.45) V, by which we speculate that the Ni-Fe alloy may be oxidized during reaction, which means that the Ni-Fe alloy is one of the actual active sites of OER[23,26]. When the current density is 10 mA/cm2, the corresponding overpotentials of pure Ni, pure Fe, Ni-Fe alloy with 10%, 20%, 30%, 50%, 75% Fe are 450, 493, 395, 407,405, 400, and 560 mV, respectively. It can be seen that the NiFe alloy catalyst with 10% Fe content exhibits the highest catalytic activity. This result shows that the incorporating Fe has a positive impact on improving the electrocatalytic OER performance. The Tafel plots derived from LSV curves are exhibited in Figure 6(b),and the corresponding Tafel slopes are 217.03, 142.26 114.55, 121.06, 139.96, 126.88, and 137.03 mV/decade,respectively. The slope value of the Ni-Fe alloy with 10% Fe content (114.55 mV/decade) is slightly lower than that of the other catalysts, demonstrating an effective catalytic kinetics for OER[27]. In order to further improve their catalytic performance, the NiFe alloys were pre-treated with 0.5 mol/L hydrochloric acid. The LSV curves of the pre-treated NiFe alloys are shown in Figure 6(c). When the current density is 10 mA/cm2, the corresponding overpotentials of pure Ni, pure Fe, 10%, 20%, 30%, 50%, 75% are 446, 400,325, 339, 292, 505, and 348 mV, respectively. It can be seen that the catalyst with 30% Fe content exhibits the highest catalytic activity by comparison. Meanwhile,the OER activity of the catalyst with 30% Fe content pre-treated with hydrochloric acid is much higher than that of the catalyst with 10% Fe content without any pretreatment, indicating that a certain concentration of hydrochloric acid plays a very important role in improving the electrocatalytic performance of the NiFe alloy. In the past, we also used other dilute acid such as sulfuric acid and nitric acid as treatment reagent for Ni-Fe alloy, but they are failed to improve the electrocatalytic performance. It can be conjectured that some complex containing Cl-could be formed on the NiFe alloys, which can reduce the overpotential of the ORE. The corresponding Tafel slopes of the NiFe alloys are 334.18, 187, 137.07, 187.98, 126.12, 155.63,and 159.87 mV/decade, respectively. It can be clearly seen that the NiFe alloy with 30% Fe content has the lowest Tafel slope (126.12 mV/decade), indicating the favorable OER kinetics[28], and this result is in agreement with the result of LSV curves.
The CV curves (Figure 7(a)) of NiFe alloy foam with 30% Fe content were recorded at different scan rates in non-faradic region. The electrochemical active surface area of the sample is directly proportional to the double layer capacitance (CdI)[29]. Combining the slope calculated from the linear relationship (Figure 7(b)), CdIof NiFe alloy foam with 30% Fe content is highest,indicating that Ni-Fe alloy foam with 30% Fe content has a higher surface roughness, so more active sites are exposed and the electrocatalytic activity is enhanced.As shown in Figure 7(c), EIS of NiFe alloy foam with different Fe content was tested to further study the conductivity. The charge transfer (Rct) of NiFe alloy foam with 30% Fe (1.08 Ω·cm2) is the smallest compared with that of other Ni-Fe alloy foam, which can ensure a much faster charge transfer on the interface between the catalyst based electrode and electrolyte, resulting in the favorable electrocatalytic performance. This result can be attributed to the appropriate Fe-doping, which can change the carrier concentration and thus is beneficial to improving conductivity[29]. Finally, the stability of the catalyst is very important for practical application of water splitting,and evaluated by amperometric I-t test in 1 mol/L NaOH aqueous solution. As displayed in Figure 7(d), within 700 min, the current density remains basically horizontal.Moreover, as the activation time increases, it shows an upward trend, proving that the catalyst has favorable stability. Therefore, NiFe alloy foam with 30% Fe content could be considered as a promising OER catalyst for practical application.
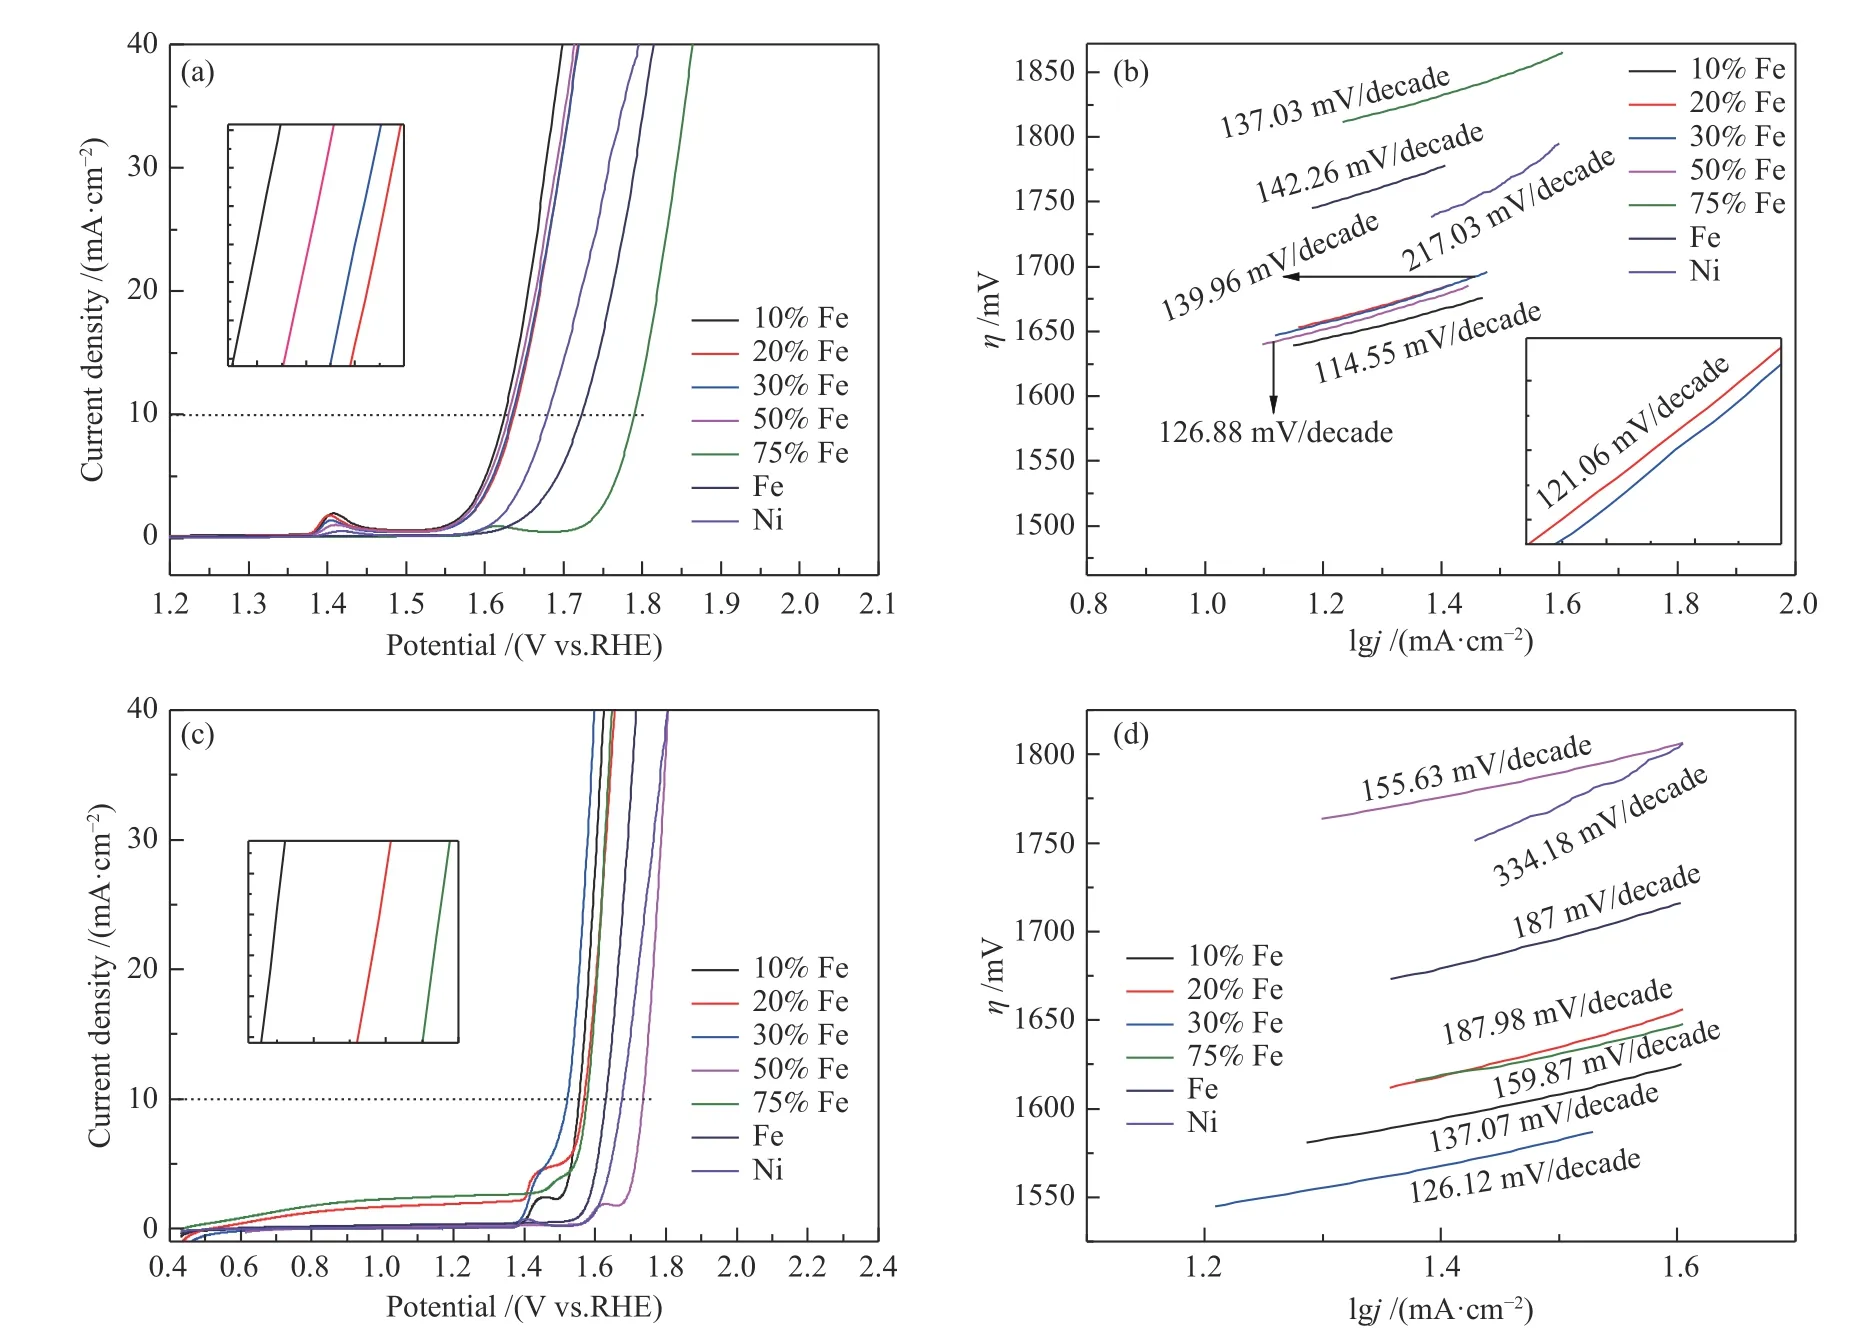
Figure 6 LSV curves ((a), (c)) and their Tafel curves ((b), (d)) of NiFe alloy foam with varied Fe content and pure Ni
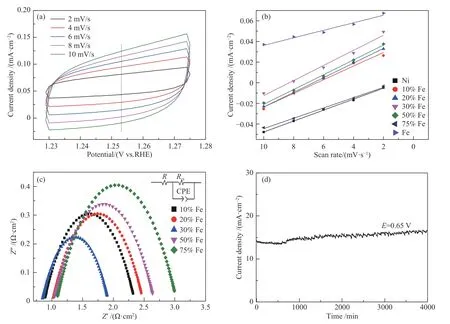
Figure 7 CVs of NiFe alloy foam with 30% Fe content at different scan rate (a); Linear fitting of the capacitance currents versus CVs scan rates (b); EIS of Ni-Fe alloy foam with varied Fe content (c); I-t curves of Ni-Fe alloy foam with 30% Fe content at 0.443V(vs.RHE)(d)
3 Conclusions
In summary, a series of NiFe alloy foams with different Fe content were successfully prepared, and their surface morphology, element content, XRD pattern properties were studied in detail. By optimizing the constitution of the NiFe alloy foams, the best performance with overpotential 292 mV atj=10 mA/cm2and robust durability was achieved. This behaviour may be ascribed to the unique structure with three-dimensional reticulated structure with low Fe content. Meanwhile, EIS spectrum and CdItest show that the NiFe alloy foams with 30% Fe content has excellent electron transfer ability and more active sites,which also prove that it has the best OER performance.Without any complex electrode prepared processes and binders, NiFe alloy foam is much convenient to use as anode of water splitting in alkaline media for industrial applications. Our study could offer an important strategy to fabricate OER electrocatalysts with highly activity, low cost and simple way .
