An entirely new approach based on remote sensing data to calculate the nitrogen nutrition index of winter wheat
2021-07-24ZHAOYuWANGJianwenCHENLipingFUYuanyuanZHUHongchunFENGHaikuanXUXingangLlZhenhai
ZHAO Yu,WANG Jian-wen,CHEN Li-ping,FU Yuan-yuan,ZHU Hong-chun,FENG Hai-kuan,XU Xin-gang,Ll Zhen-hai
1 Key Laboratory of Quantitative Remote Sensing in Ministry of Agriculture and Rural Affairs/Beijing Research Center for Information Technology in Agriculture,Beijing 100097,P.R.China
2 National Engineering Research Center for Information Technology in Agriculture,Beijing 100097,P.R.China
3 College of Geomatics,Shandong University of Science and Technology,Qingdao 266590,P.R.China
Abstract The nitrogen nutrition index (NNI) is a reliable indicator for diagnosing crop nitrogen (N) status.However,there is currently no specific vegetation index for the NNI inversion across multiple growth periods.To overcome the limitations of the traditional direct NNI inversion method (NNIT1) of the vegetation index and traditional indirect NNI inversion method (NNIT2) by inverting intermediate variables including the aboveground dry biomass (AGB) and plant N concentration (PNC),this study proposed a new NNI remote sensing index (NNIRS).A remote-sensing-based critical N dilution curve (Nc_RS) was set up directly from two vegetation indices and then used to calculate NNIRS.Field data including AGB,PNC,and canopy hyperspectral data were collected over four growing seasons (2012–2013 (Exp.1),2013–2014 (Exp.2),2014–2015 (Exp.3),2015–2016 (Exp.4))in Beijing,China.All experimental datasets were cross-validated to each of the NNI models (NNIT1,NNIT2 and NNIRS).The results showed that:(1) the NNIRS models were represented by the standardized leaf area index determining index (sLAIDI)and the red-edge chlorophyll index (CIred edge) in the form of NNIRS=CIred edge/(a×sLAIDIb),where “a” equals 2.06,2.10,2.08 and 2.02 and “b” equals 0.66,0.73,0.67 and 0.62 when the modeling set data came from Exp.1/2/4,Exp.1/2/3,Exp.1/3/4,and Exp.2/3/4,respectively;(2) the NNIRS models achieved better performance than the other two NNI revised methods,and the ranges of R2 and RMSE were 0.50–0.82 and 0.12–0.14,respectively;(3) when the remaining data were used for verification,the NNIRS models also showed good stability,with RMSE values of 0.09,0.18,0.13 and 0.10,respectively.Therefore,it is concluded that the NNIRS method is promising for the remote assessment of crop N status.
Keywords:nitrogen nutrition index (NNI),critical nitrogen dilution curve,standardized leaf area index determining index(sLAIDI),the red-edge chlorophyll index (CIred edge)
1.lntroduction
Nitrogen (N) is the most widely used fertilizer in agricultural production.An excessive application of N fertilizer often causes a series of waste and environmental problems,such as crop lodging,farmland quality degradation and water eutrophication (Huet al.2019;Wuet al.2019).Therefore,accurate N diagnosis and appropriate N management are essential components of green agricultural production and sustainable development.The N nutrition index (NNI) is a reliable method for diagnosing plant N status (Justeset al.1994;Ziadiet al.2010;Abdallahet al.2016).
NNI is obtained by dividing the measured plant N concentration (PNC) by a critical N (Nc) dilution curve.The method for constructing the Ncdilution curve is a major focus in NNI study.In addition to the Ncdilution curve using aboveground dry biomass (AGB) as an independent variable,many other Ncdilution curves with high accuracy have also been constructed based on leaf area index(LAI),leaf biomass,stem biomass or spike biomass as the independent variables according to different objectives (Ata-Ul-Karimet al.2014a,b;Yaoet al.2014;Zhaoet al.2018;Qianget al.2019).Ncdilution curves based on growth stage and biomass are also applied in crop growth models,such as Agricultural Production Systems sIMulator (APSIM) and Crop Environment Resource Synthesis (CERES).Zhaoet al.(2014) found that the Ncdilution curve based on the growth stage is more stable than that based on AGB.Based on different geographic areas,crops and varieties,NNI has been widely used for N diagnosis and yield prediction(Xue and Yang 2008;Ata-Ul-Karimet al.2016).However,agronomic NNI is obtained through destructive-sampling methods that are time-consuming and not practical for use across a large region (Lemaireet al.2008b).Remote sensing measurements are now widely accepted for generating such data during the growing season without the need for destructive sampling (Padillaet al.2015;Xiaet al.2016).Thus,a rapid,real-time method to detect NNI is desirable.
Remote sensing technology has made great progress in monitoring biomass,LAI,PNC,and crop productivity,and it also has excellent potential for NNI prediction.Regarding the prediction of NNI using remote sensing,existing studies can be grouped into two classes according to their error sources.
(i) Traditional direct NNI inversion method (NNIT1)employs a regression model between NNI and a vegetation index.Many studies have been based on different growth periods for NNI remote sensing monitoring and analysis (Xiaet al.2016;Liuet al.2018);however,the general model built for multiple growth periods had lower accuracy.Most of the existing vegetation indices are used to monitor AGB,LAI or PNC,but these indices may not be suitable for monitoring NNI contained two kinds agronomic information (AGB and PNC).The index constructed by Xiaet al.(2016) combined with the N-response vegetation index (RI-VI) has obtained satisfactory results for multi-period inversion of NNI.
However,RI-VI needs a control group with sufficient fertilizer in each growth period,which may not be readily achievable in farmland.It would be more convenient to construct a unified general model for the diagnosis and application of N in large-scale farms if such a model could estimate the vegetation index of the control group in each growth period.However,the research in this field is still lacking.
(ii) Traditional indirect NNI inversion method (NNIT2)was constructed after inverting intermediate variables including the aboveground dry biomass (AGB) and plant N concentration (PNC).Chenet al.(2010a) suggested estimating PNC and AGB in winter wheat by using PNC-related vegetation indices (Nindex) and AGB-related vegetation indices (Bindex),respectively.These estimates were then invoked as inputs to calculate NNI.Ciliaet al.(2014) estimated leaf actual PNC and AGB with modified chlorophyll absorption ratio index/modified triangular vegetation index 2 (MCARI/MTVI2) and MTVI2,respectively,and proved that airborne hyperspectral imagery could be used to detect N-deficient areas in maize crops.Huang
et al.(2015) found that predicting NNI from AGB and PNC,estimated by using satellite remote-sensing data at the panicle initiation stage in rice,is a practical and promising way to diagnose N status,withR2=0.52.The existing approaches for determining NNI based on remote sensing data are all passive inversions,that is,the NNI expression is based on one or more vegetation indices.Unfortunately,in the process of multiple inversion,model error sources may increase,which leads to erroneous results.
Therefore,this study focuses on the development of an NNI remote sensing index (NNIRS),which is a critical component for site-specific N management in agricultural fields.To achieve this goal,the objectives of the present study were to:(i) construct a novel vegetation index,NNIRS,which accurately diagnoses the N status of winter wheat;(ii)compare the capabilities of several established vegetation indices in conjunction with NNIRSfor estimating NNI in wheat under different field test conditions;and (iii) validate the newly developed NNIRSby applying it to actual field data.
2.Materials and methods
2.1.Study sites and experimental designs
Experimental data from four growing seasons,2012–2013,2013–2014,2014–2015,and 2015–2016,were obtained from the National Precision Agriculture Experimental Base of Xiaotangshan town (40°10´31´´–40°11´18´´N,116°26´10´´–116°27´05´´E),Changping District,Beijing,China.The weather conditions of the experimental sites during the four seasons are shown in Fig.1.A detailed description of the experimental design can be found in Liet al.(2018).This study only used normal irrigation management conditions to test the inversion of NNI by Ncand remote sensing.
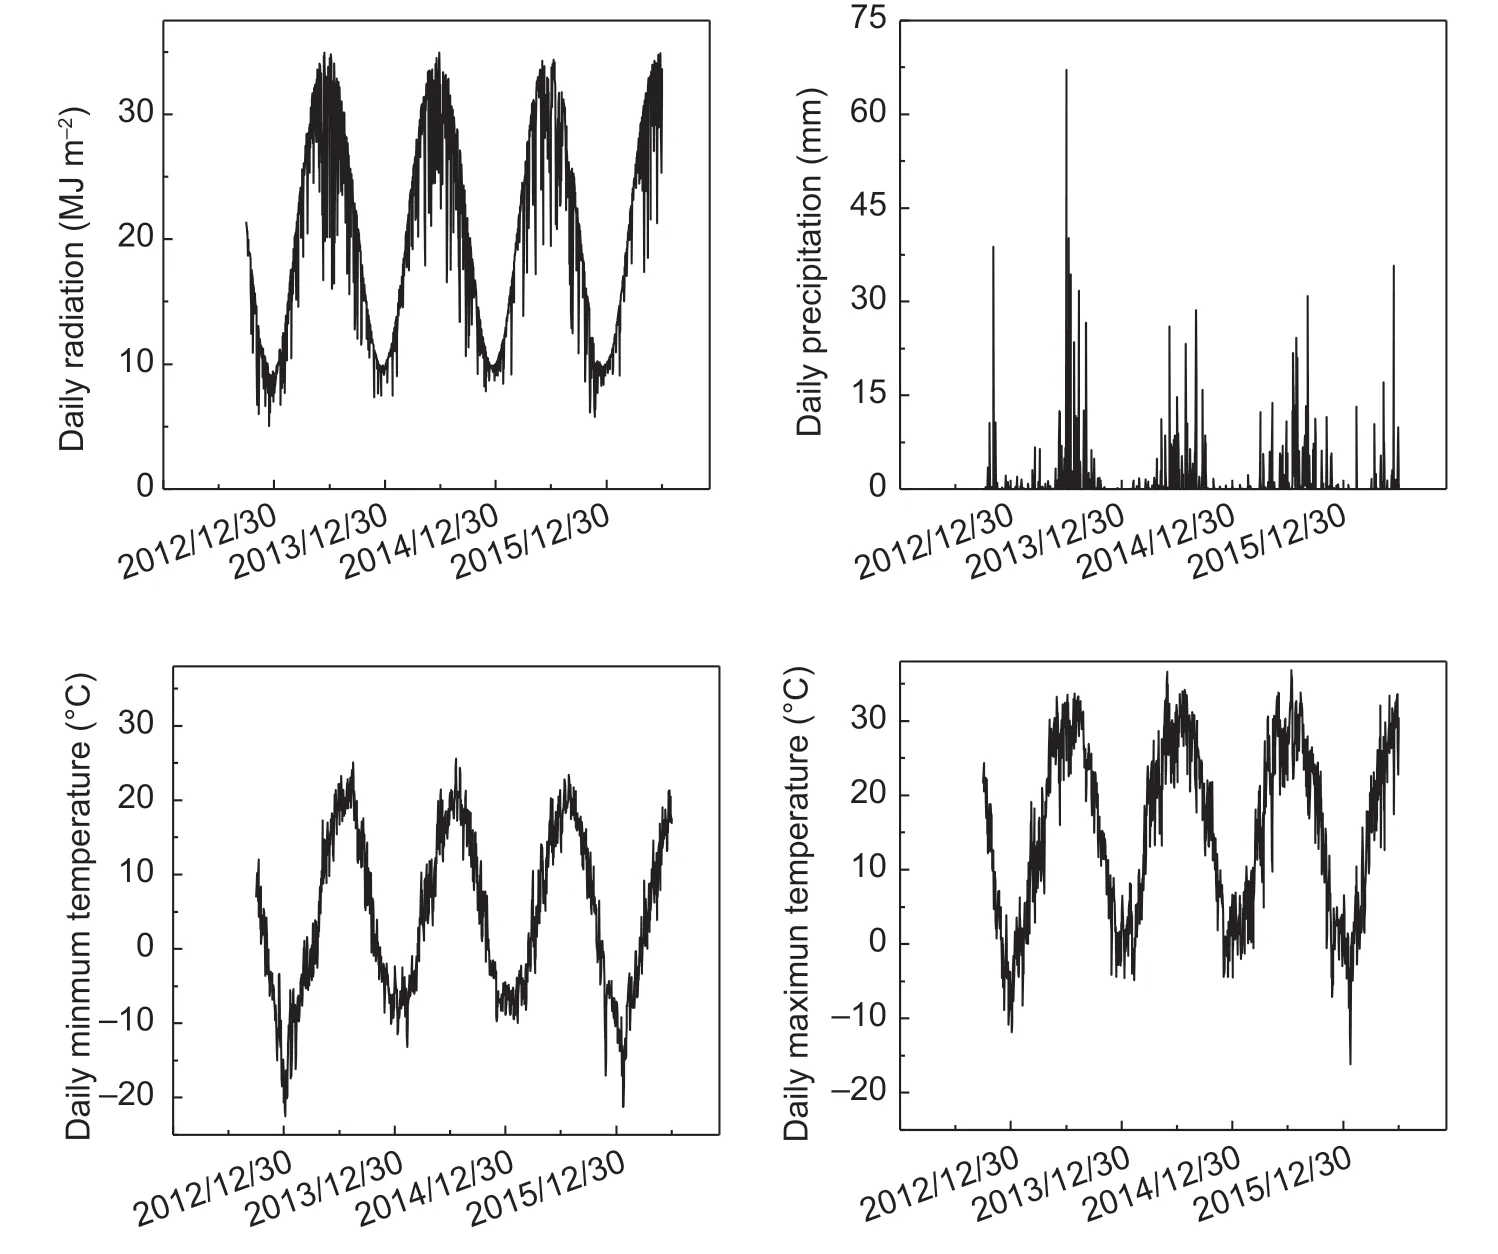
Fig.1 The weather conditions at Xiaotangshan town,Changping District,Beijing,China after sowing.
2.2.Data acquisition
Hyperspectral reflectanceHyperspectral reflectance was measured at the Feeks stage 6 (F6),Feeks stage 8 (F8),and Feeks stage 10.5 (F10.5) during each winter wheat growing season (Large 1954).Hyperspectral reflectance was collected by using an ASD FieldSpec Pro FR spectroradiometer (Analytical Spectral Devices,Boulder,CO,USA) with a sampling interval of 1.4 nm between 350 and 1 050 nm,and 2 nm between 1 050 and 2 500 nm,with a standard filed-of-view of 25°.Measurements were made during cloud-free periods between 10:00 a.m.and 2:00 p.m.to minimize variations in illumination conditions.Before the measurement of canopy reflectance,a white Spectrolon reflectance panel (Labsphere,North Sutton,NH,USA) was used to calibrate the spectral reflectance.The instrument was held at a height of 1.0 m above the canopy and the view nadir and azimuth angles were both 0.One representative sub-plot,1.0 m×1.0 m,was selected to collect hyperspectral data for each plot.To reduce the effects of field conditions,ten scans were acquired and averaged to represent the canopy reflectance of each plot.
Crop biomass and plant N concentrationAt the positions where spectral measurements were taken,aboveground vegetation was harvested immediately by randomly cutting 0.25 m2in each plot,and then 20 representative wheat tillers were randomly selected.All fresh samples were separated into leaves and stems,and then heated to 105°C for 0.5 h to stop metabolism and then cooled to 80°C until a constant weight was obtained.The final AGB was recorded,and then after drying and weighing the fractionated samples were ground to determine PNC by using the micro-Kjeldahl method.PNC was calculated as the ratio of total N accumulation to AGB.The data used in this article are listed in Table 1.
Vegetation indicesThirty vegetation indices correlated with agronomic parameters in previous studies were calculated by using the equations listed in Table 2.

Table 1 List of acquired experiment data in this study1)
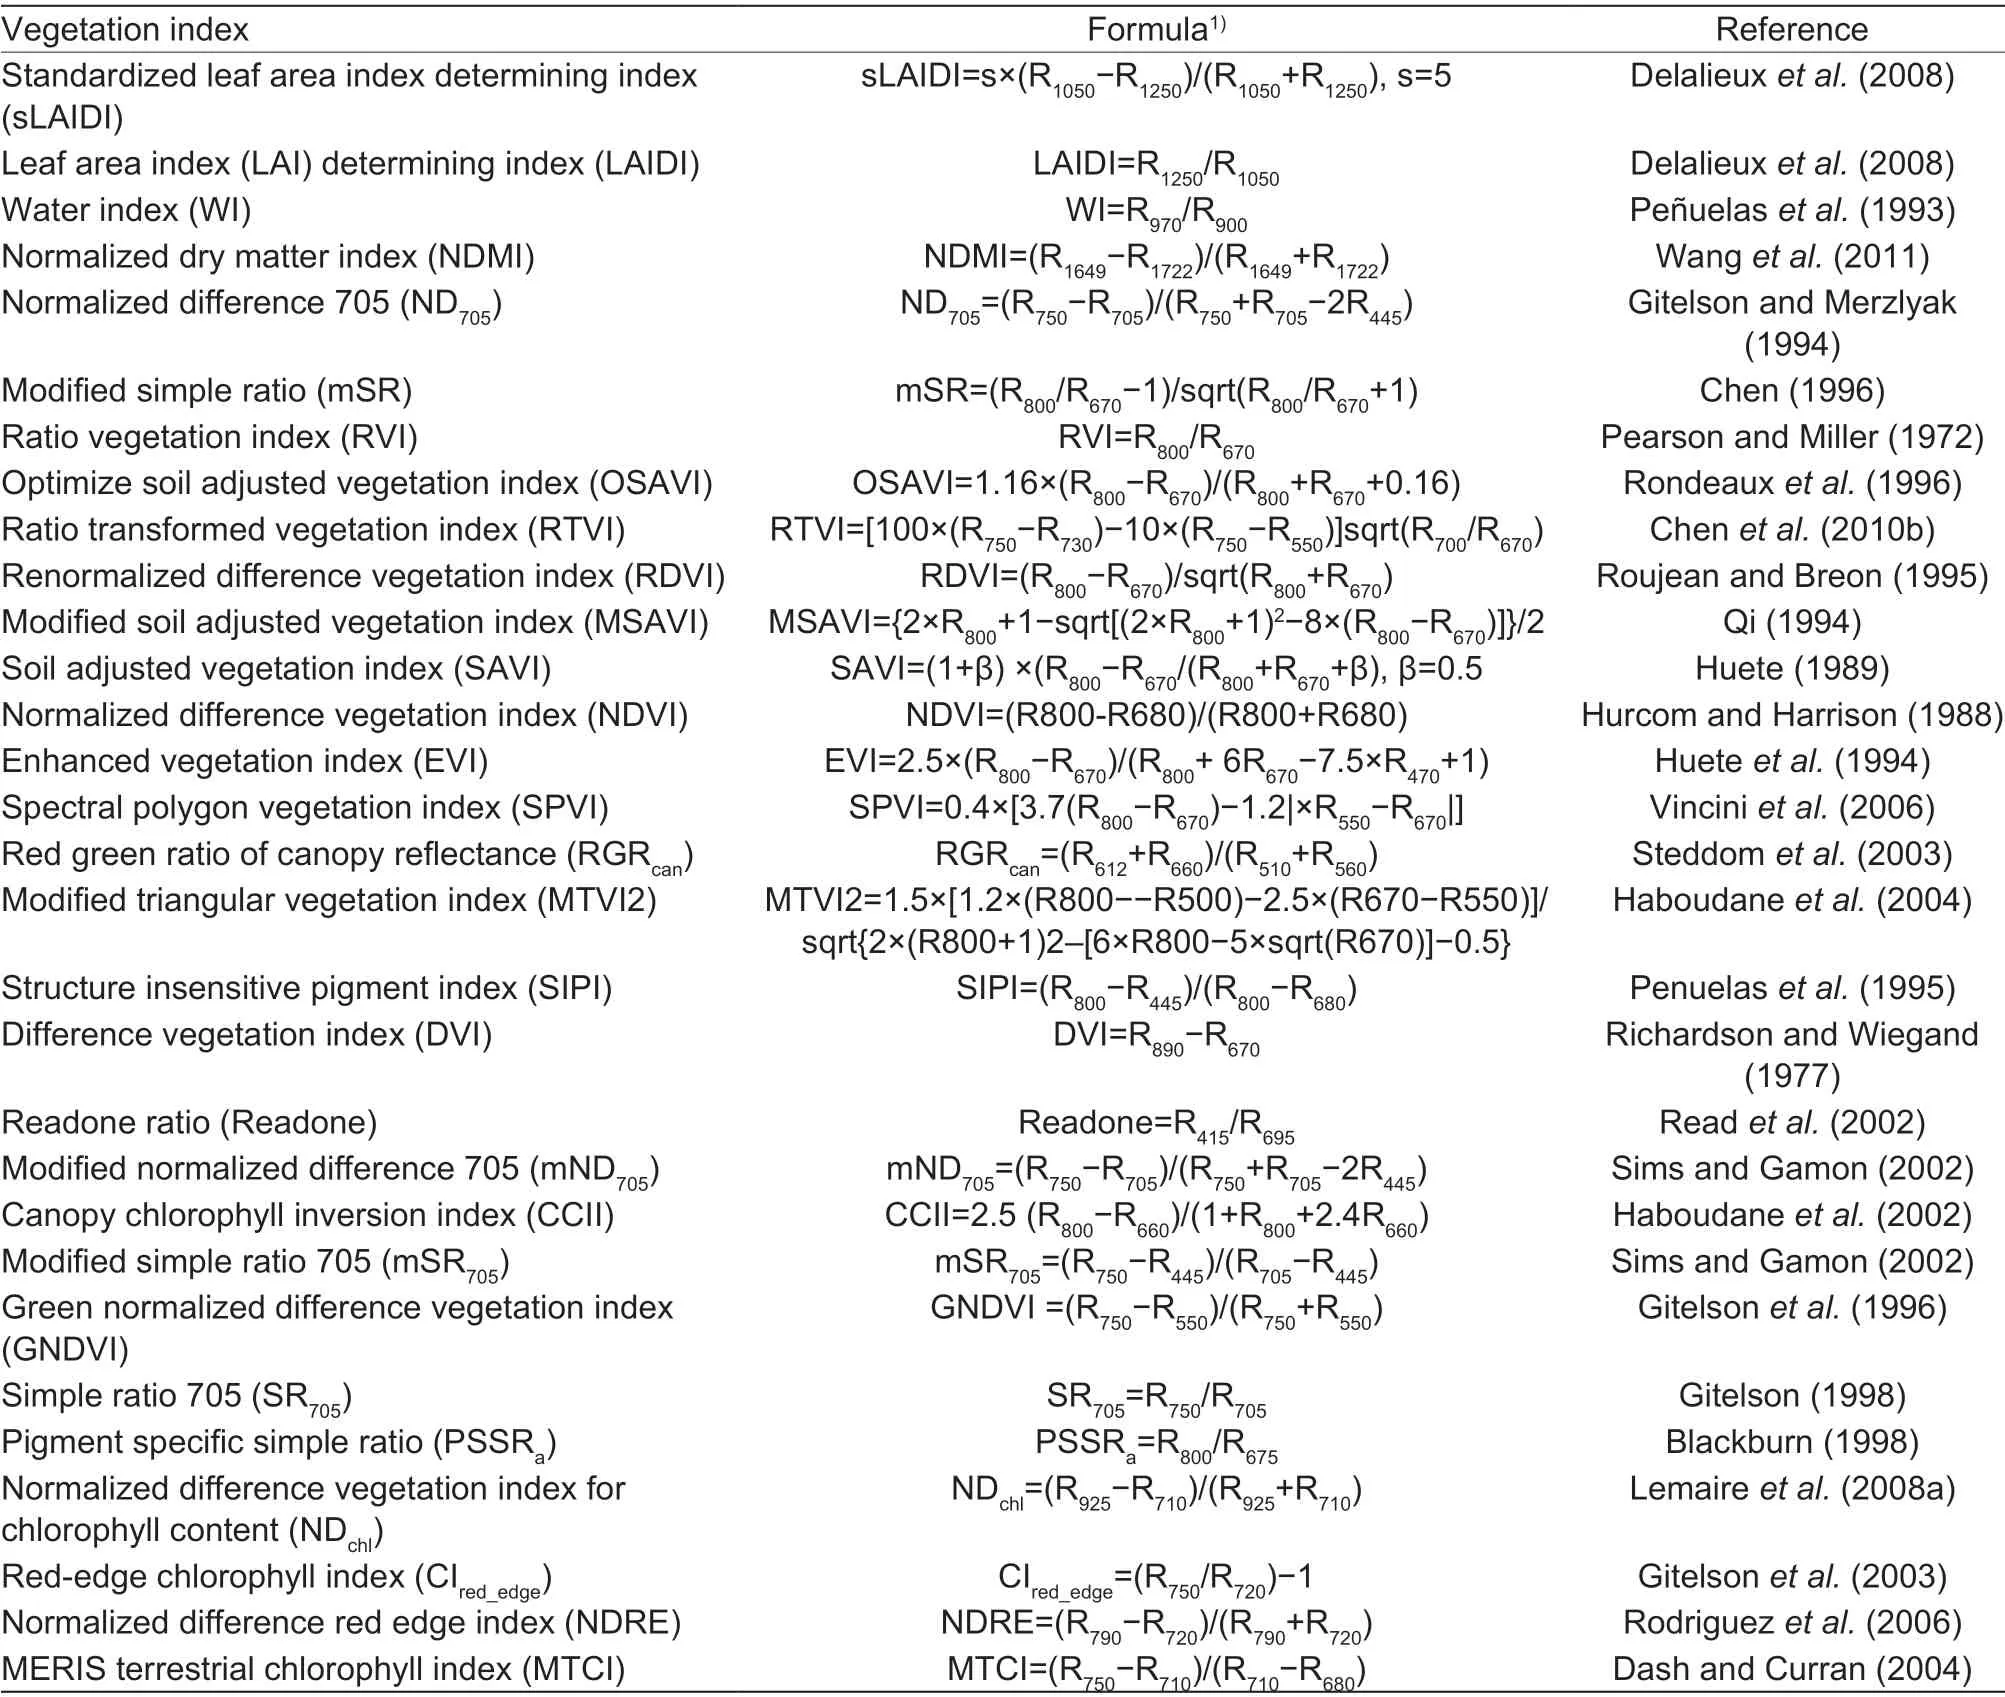
Table 2 List of the selected existing vegetation indices (VIs) that are sensitive to the aboveground dry biomass (AGB) and plant N concentration (PNC)
2.3.Data analysis
NNl remote sensing indexThirty vegetation indices were combined twice to construct the remote-sensing-based critical N dilution curve (Nc_RS),once as Bindexand once as Nindex,and then the NNIRSwas constructed.The best vegetation index combination was selected by choosing the one with the largest regression coefficient,and it was then used to determine NNIRS.The steps to construct the Nc_RSin this study were based on those for constructing the agronomic Ncfrom Justeset al.(1994).The critical point for each sampling datum value was acquired as follows:
(1) Nindexand Bindexcharacterize each N treatment.
(2) The Ncpoint is determined by the intersection of two lines,a straight line and a vertical line.The straight line is the line fitted to the data of N-limited treatment points,and the vertical line is that perpendicular to theX-axis.The perpendicular line gives the maximum Bindex,which is calculated from the average of the non-N-limited treatment points.
(3) The Ncpoints are developed as a power-law function to describe the relationship between Nindexand Bindex:

Where errepresents random error.
(4) NNIRSis obtained from the ratio of Nindexto Nc_RS:

Fig.2 shows the flow charts for the three methods for retrieving NNI by using remote sensing technology.
NNlT1methodThe agronomic NNI of this paper was constructed based on the classical construction method proposed by Justeset al.(1994).Fig.2-A shows the flow chart for monitoring NNI directly with the existing vegetation indices,and the error source only accumulates once.NNIT1is determined by:

Wherefrepresents linear,logarithmic,exponential,or other types of regressions.VI represents vegetation index;errepresents random error.For NNIT1,linear,exponential,logarithmic and idempotent regression methods were tested to select the model with the highest precision for display.
NNlT2 methodFig.2-B shows the flow chart for the NNIT2method,and its construction process is as follows:first,the vegetation indices were used to retrieve AGB and PNC;second,the Ncdilution curve was retrieved;and finally,NNIT2was inversed.The calculation formulas of NNIT2are:
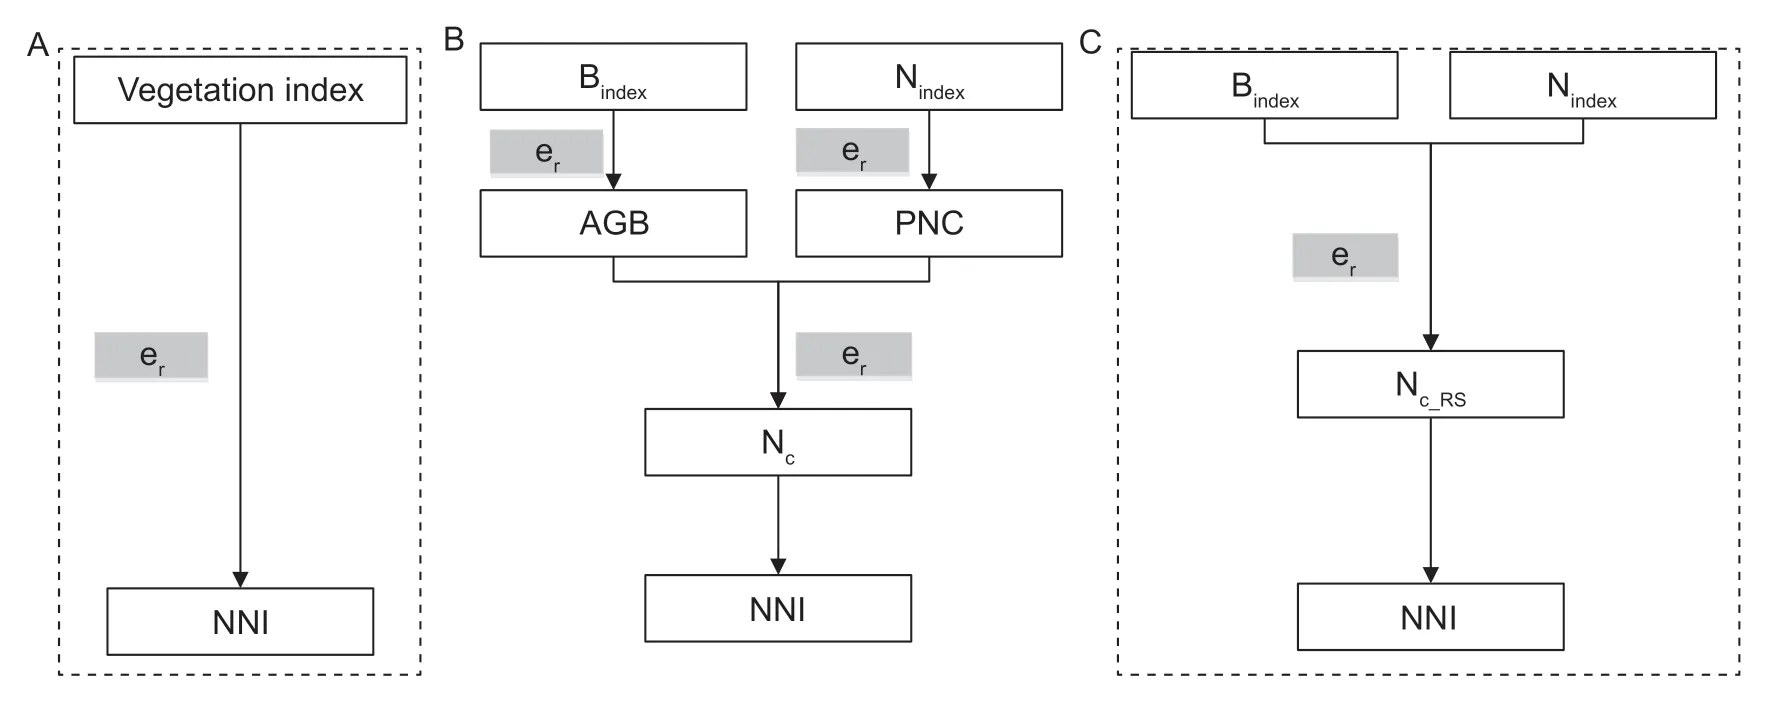
Fig.2 Methods of nitrogen nutrition index (NNI) calculation.A,the direct approach NNI model (NNIT1).B,the indirect approach NNI model (NNIT2).C,the method developed herein (NNIRS).er,random error in the process of constructing NNI;Bindex,aboveground dry biomass-related vegetation index;Nindex,plant N concentration–related vegetation index;Nc_RS,remote-sensing-based critical N dilution curve.

Wherefrepresents linear,logarithmic,exponential or other types of regression.For AGB and PNC,linear,exponential,logarithmic and idempotent regression methods were tested to select the model with the highest precision for display.AGBpand PNCprepresent predicted AGB and PNC using vegetation index,respectively;errepresents random error;and “a1” and “b1” are parameters obtained by calibrating the Ncdilution curve with the predicted AGB using vegetation index.
Statistical analysisIn this study,all varieties under the same treatment were averaged to avoid unintentional errors.The determination of the Ncdilution curve requires identifying the critical data points at which N fertilizer neither limits nor enhances plant growth.Therefore,all AGB and PNC data under different N treatments were subjected to analysis of variance (ANOVA) as implemented by IBM SPSS version 17(IBM Corporation,Armonk,NY,USA).When ANOVA gave a significant value,the least significant difference (LSD,P<0.05) test was implemented.The results were used to classify each treatment as either N-limited or non-N-limited.The procedure developed by Justeset al.(1994) was used for developing the Ncdilution curve.
The Pearson correlation coefficient (r) was used to sort the vegetation indices.The determination coefficient (R2) of the calibration data and the root mean square error (RMSE)were used to assess the accuracy of the relationships between the measured NNI and the three estimates:NNIT1,NNIT2and NNIRS.A higherR2corresponds to a lower RMSE and a more precise and accurate model.The RMSE is given by:

Whereyi,yjandnare the predicted,observed,and number of samples,respectively.
Akaike information criterion (AIC) is based on information theory and can be calculated by applying maximum likelihood theory (Goloboff and Arias 2019).The use of AIC has allowed significant practical and theoretical advances in model selection.While the derivation of the AIC method is challenging to follow,it is easy to calculate.The general equations are:

Where L and K represent log-likelihood and the number of estimated parameters included in different NNI models,respectively.The PI,SSe andnrepresent a circular constant,the residual sum of squares,and the sample number,respectively.The AIC value is closely related to L and K values.Among them,a smaller K value indicates a more concise model,and a more substantial L value indicates a more accurate model.
3.Results
3.1.Measured nitrogen nutrition index
Plant N concentration,aboveground dry biomass and vegetation indices under varied N treatmentsData were obtained from four field experiments,conducted in different years that included different N rates and six wheat cultivars.In general,there was a difference in AGB between the varieties.The AGB was affected by N fertilizer application rates at different growth stages (Table 3).AGB increased gradually with increasing N fertilizer application at any given stage of winter wheat growth.
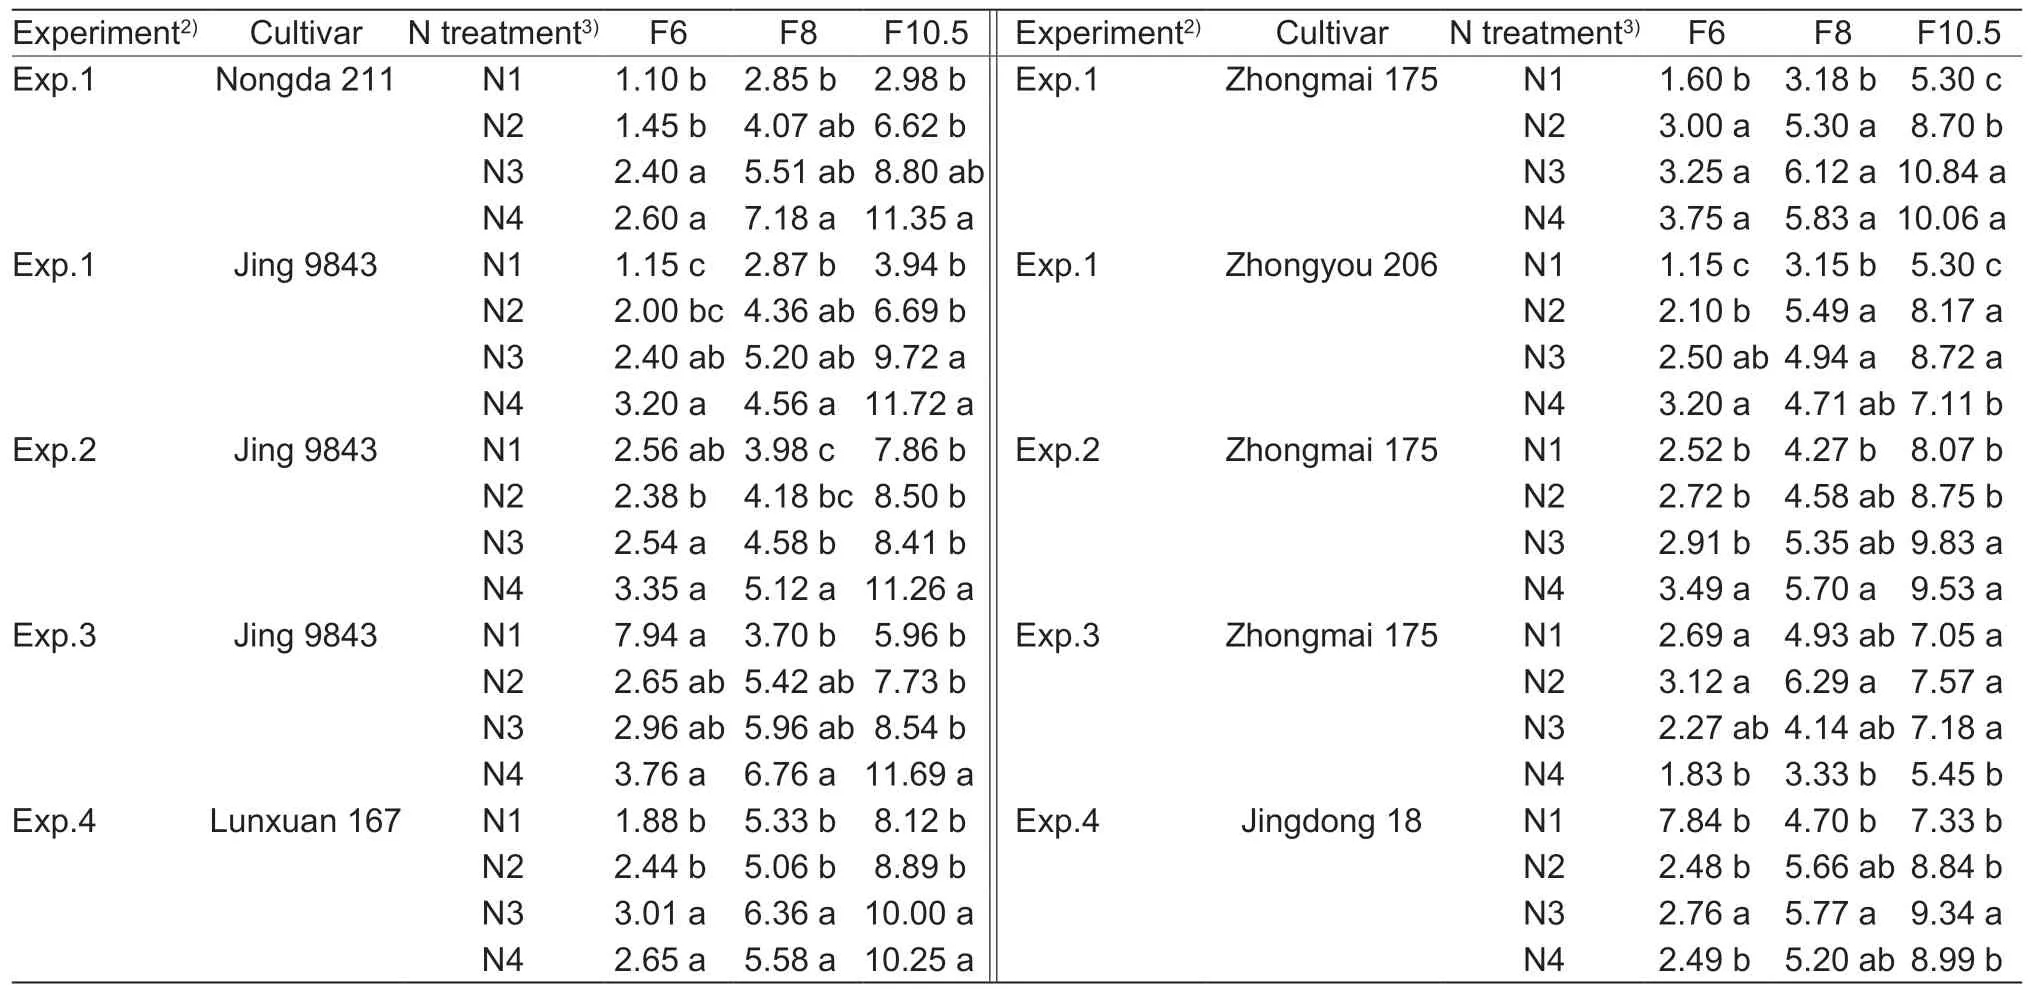
Table 3 Statistical summary of aboveground dry biomass (AGB) (t ha–1) under different N treatments during the F6,F8 and F10.5 stages in winter wheat for the calibration dataset1)
The N application rates had significant effects on vegetation indices (e.g.,sLAIDI and CIrededge) during different growing seasons.sLAIDI and CIrededgeincreased gradually with the increasing rates of N application and ranged from 0.07–1.17 to 0.29–2.56,respectively,depending on the cultivar,sampling date,and season (Fig.3).
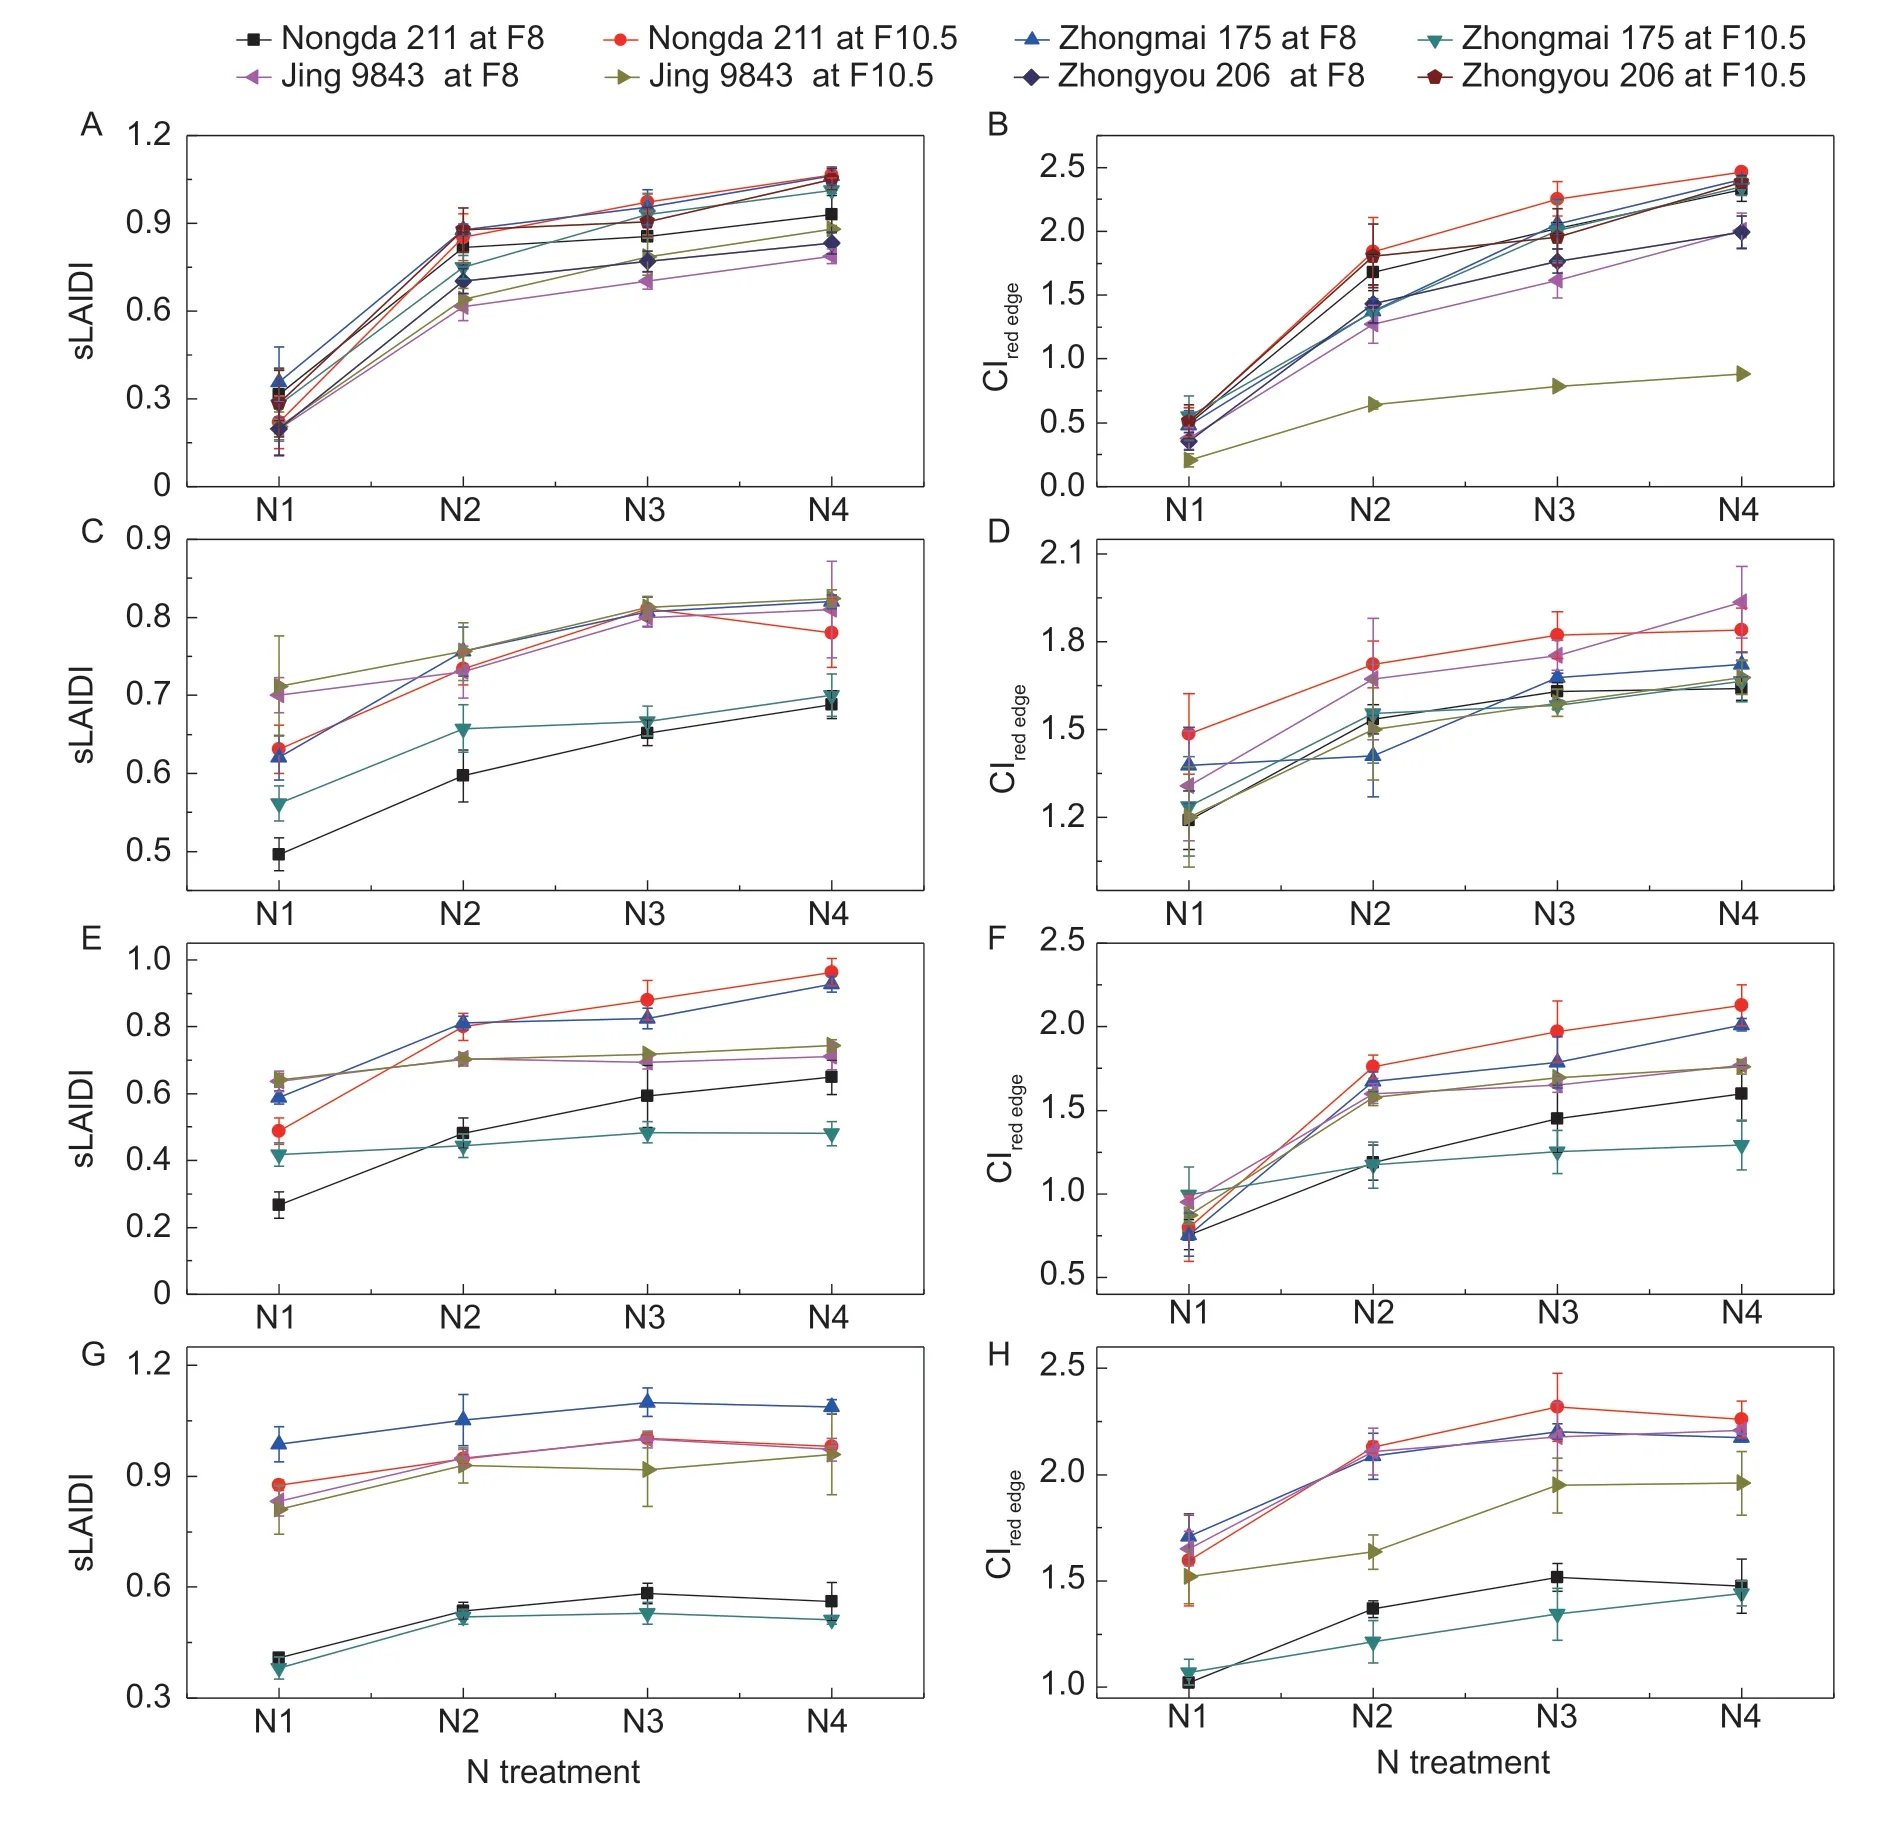
Fig.3 Changes in winter wheat vegetation index with time under different N application rates in the 2012–2013 (A and B),2013-2014 (C and D),2014–2015 (E and F) and 2015–2016 (G and H) seasons.N1,no N treatment;N2,half the amount of local normal N treatment;N3,local normal N treatment;N4,twice the amount as much as normal N treatment.F6,Feeks stage 6;F8,Feeks stage 8;F10.5,Feeks stage 10.5 (Large 1954).
Critical N dilution curveFig.4 shows 30 points selected according to Ncdilution algorithm,among which one Ncpoint during the 2012–2013 growth season was outside the 95%predicted line,so the Ncdilution curve constructed from the remaining 29 data points was used for further analysis.In this study,difference analysis of parameters “a” and “b”corresponding to different varieties was conducted,as shown in Fig.5.There were 28 combinations for variety comparison,among which the combination with no significant difference in parameter “a” accounted for 60.71%,while the proportion of combinations with no significant difference in parameter “b” was 85.71%.To further reduce random errors,the Ncdilution curve in this study was developedwithout considering the effects of cultivars and interannual variations.In Fig.4,the dilution curve was fitted with the following negative power regression equation (n=29):
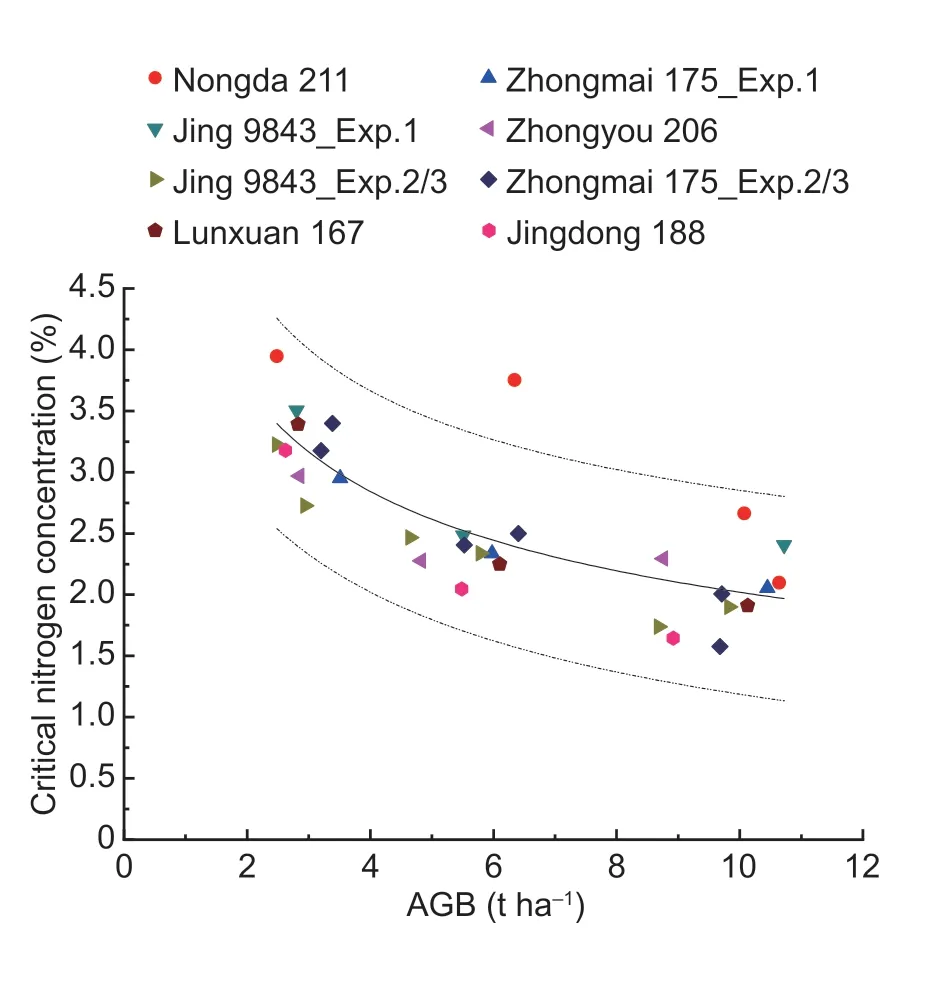
Fig.4 Critical N points and critical N dilution curve obtained by nonlinear fit (n=30).Exp.1,the experiment of 2012–2013;Exp.2/3,the experiment of 2013–2014 and 2014–2015.The dashed lines represent the 95% prediction band.
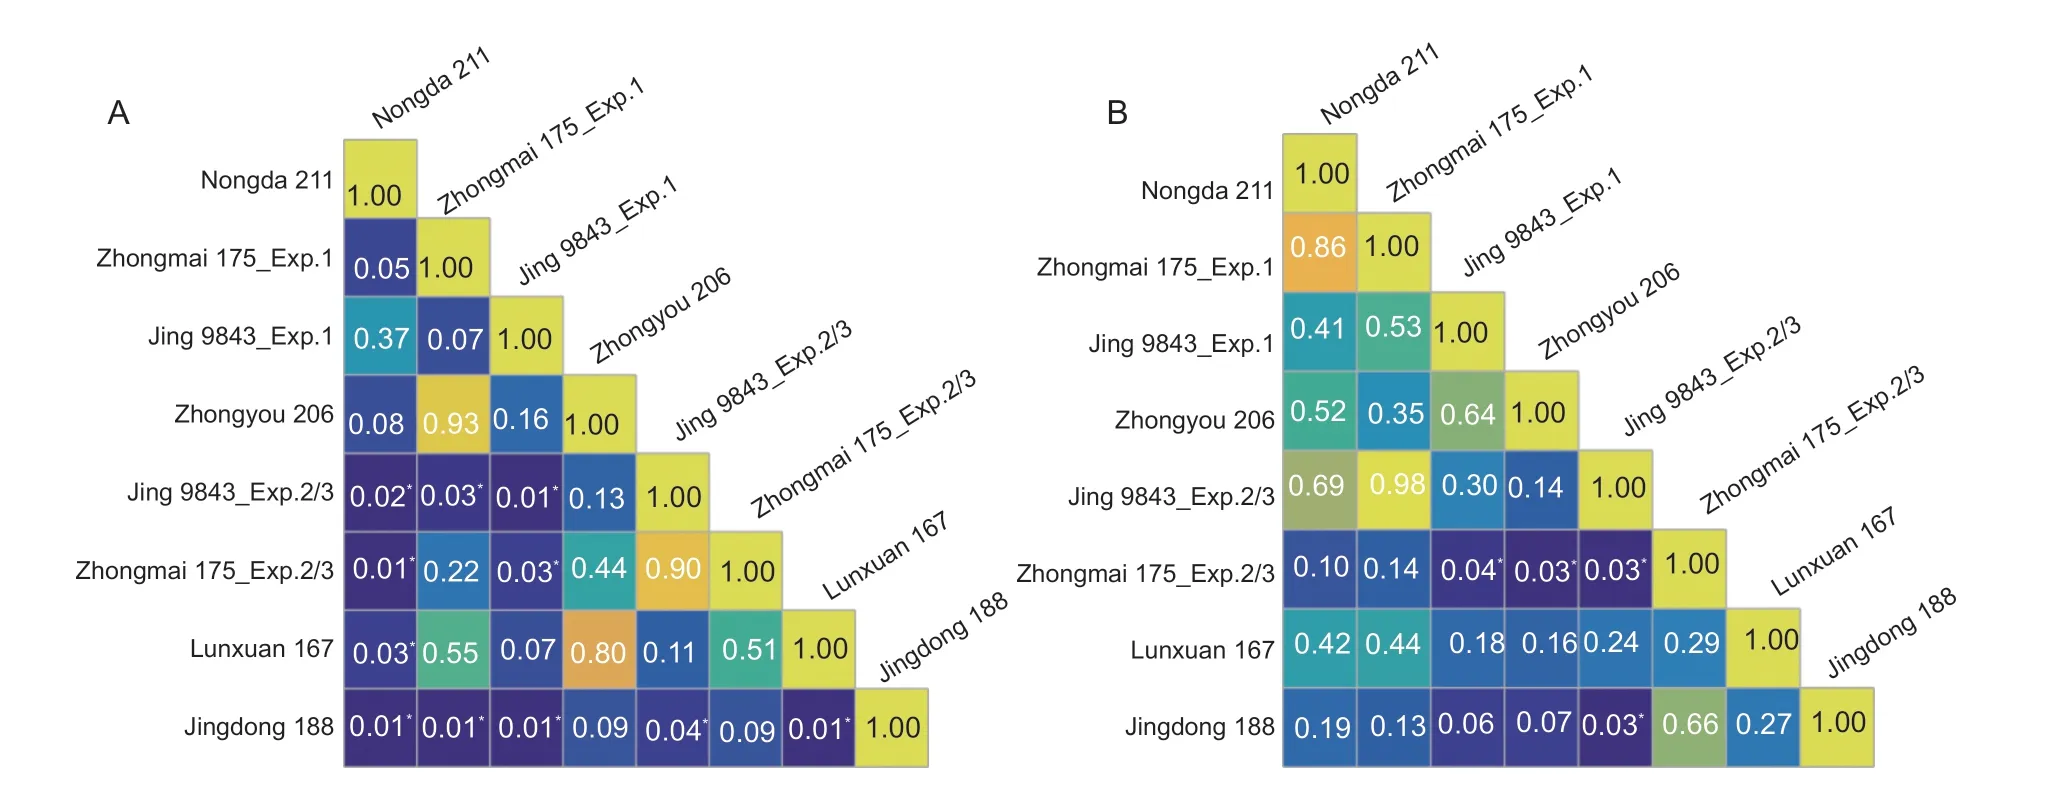
Fig.5 Matrix of significant differences among parameters “a” (A) and “b” (B) of critical N dilution curves obtained separately for the different cultivars.Exp.1,the experiment of 2012–2013;Exp.2/3,the experiment of 2013–2014 and 2014–2015.* indicates significance level of P<0.05.

Where AGB represents the aboveground biomass (t ha−1).
Nitrogen nutrition index model and N diagnosisNNI was estimated only under normal local irrigation conditions.NNI for each treatment was calculated based on the actual PNC and the Ncdilution model,and the statistics for NNI with different rates of N application are illustrated in Fig.6.For winter wheat,NNI increased with increasing N application(N1–N4;Fig.6) and varied between 0.39 and 1.34 during the growing season of 2012–2013 (Fig.6-A),0.58 and 1.27 during 2013–2014 (Fig.6-B),0.63 and 1.19 during 2014–2015 (Fig.6-C),and 0.63 and 1.18 during 2015–2016(Fig.6-D).NNI tended to decrease gradually from the F6 to the F10.5 stages under the same level of N treatment,except for the 2013–2014 growing season (Fig.6-B).However,the results during the 2014–2015 growing season(Fig.6-C) were not evident,with NNI tending to decrease only in the anthesis stage.The change of NNI in different growth stages is related to the application time and release efficiency of fertilizer.This poor relationship makes it difficult to monitor the multi-growth period by remote sensing.A more noticeable difference was seen in the variation in NNI values at different rates of N application.Overall,NNI suggested that the N1 and N2 treatments resulted in significant N deficiencies due to a low N supply.PNC under the N3 treatment was close to Ncdilution curve and the PNC under N4 indicated excessive N.
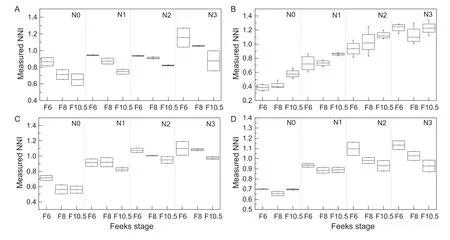
Fig.6 Measured N nutrition index values (NNI) for various rates of N application (N0–N3) for 2012–2013 growing season (A),2013–2014 growing season (B),2014–2015 growing season (C) and the validation dataset (D).F6,Feeks stage 6;F8,Feeks stage 8;F10.5,Feeks stage 10.5 (Large 1954).
3.2.NNlRS model based on vegetation indices
The correlation between NNIRSand measured NNI was calculated to select the Bindexand Nindexthat could be brought together to give the best results.All possible combinations were confirmed to construct NNIRSfor winter wheat (Fig.7).Interestingly,the results showed that the combination of CIrededgeand sLAIDI achieved the best accuracy of all the combinations of vegetation indices in different calibration set combinations.Among the different sets,the first three groups (Nindex-Bindex) were mSR-WI,CIrededge-sLAIDI and CIred edge-WI,withrvalues of 0.85,0.84 and 0.82 during Exp.1/2/4,respectively;CIrededge-sLAIDI,SR705-sLAIDI and SR705-LAIDI,withrvalues of 0.91,0.90 and 0.89 during Exp.1/2/3,respectively;CIrededge-sLAIDI,CIrededge-LAIDI and SR705-LAIDI,withrvalues of 0.83,0.81 and 0.80 during Exp.1/3/4,respectively;and WI-SR705,LAIDI-SR705and CIrededge-sLAIDI,withrvalues of 0.77,0.75 and 0.73 during Exp.2/3/4,respectively.These indices had a strong correlation with LAI and pigmentation.
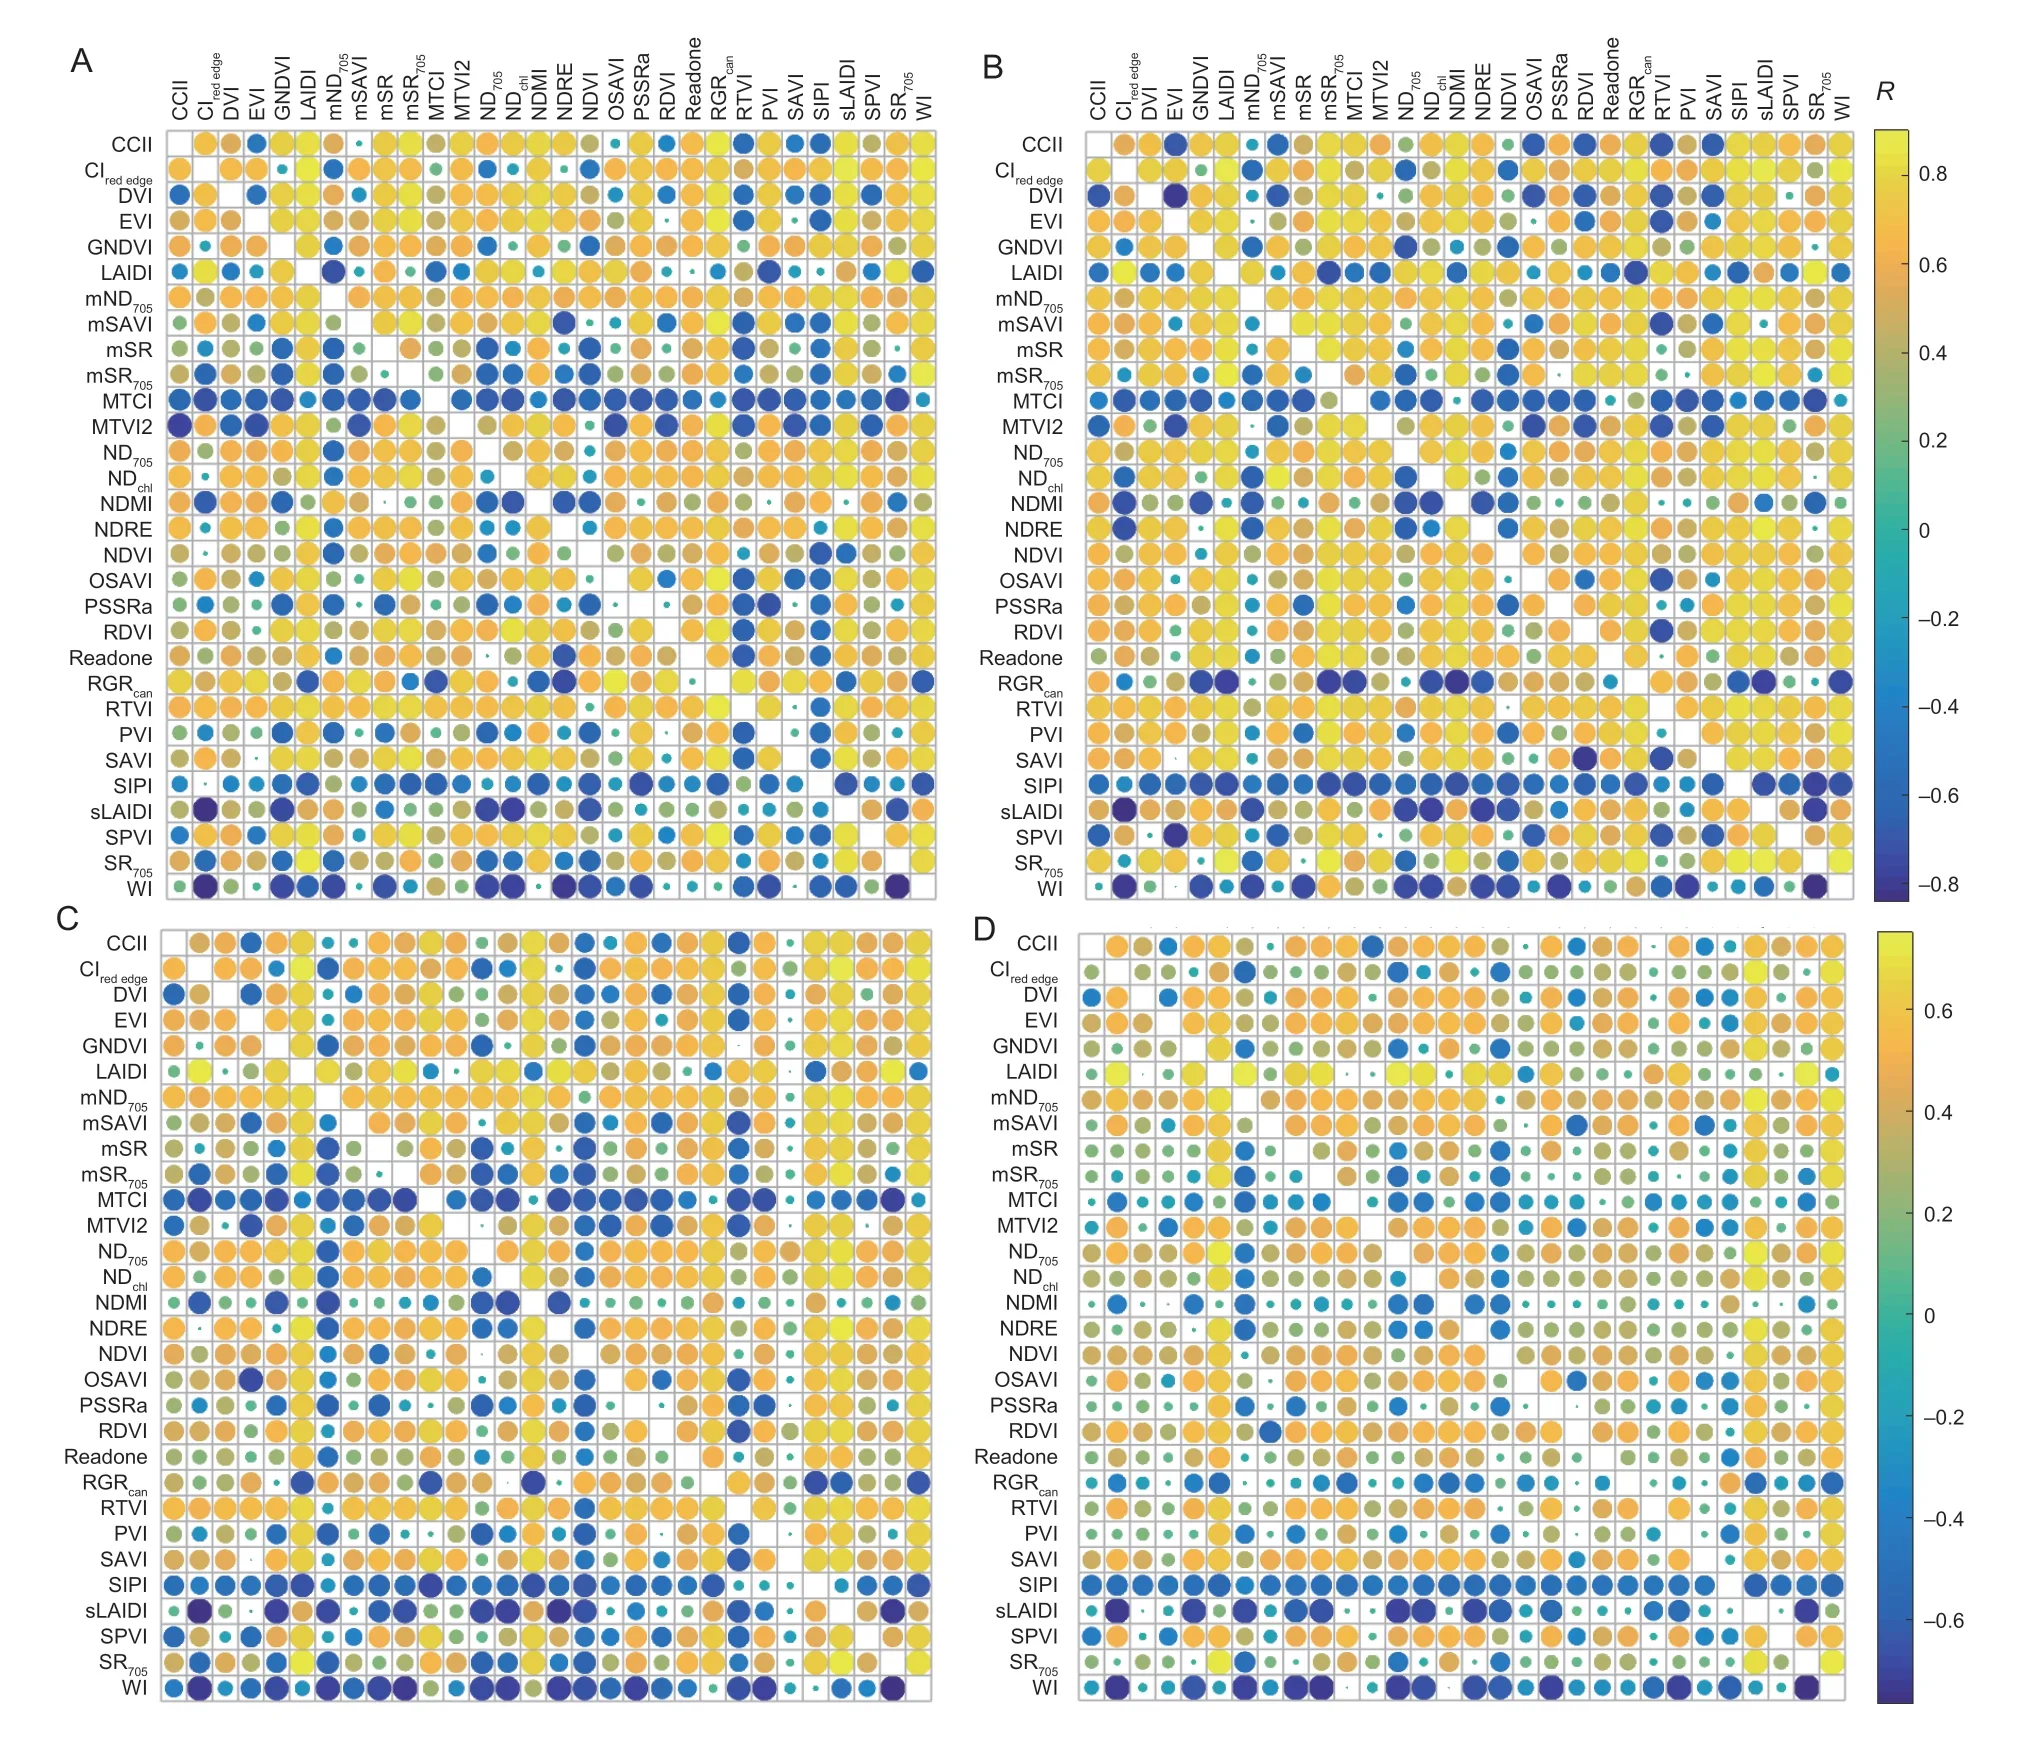
Fig.7 Correlations between all possible nitrogen nutrition index remote sensing index (NNIRS) models based on two-way combinations of vegetation indices and measured NNI,and correlations between vegetation indices and aboveground dry biomass (AGB) and plant N concentration (PNC),respectively.The r represents the correlation coefficient between NNI built using two vegetation indices and measured NNI.The critical values of r corresponding to a significance of 0.05 were 0.22 and 0.23 (Exp.1/2/4 (A),Exp.1/2/3 (B),Exp.1/3/4 (C),n=82) and (Exp.2/3/4 (D)),respectively.Exp.1,Exp.2,Exp.3 and Exp.4 represent the experiments of 2012–2013,2013–2014,2014–2015 and 2015–2016 winter wheat growing seasons,respectively.Bindex,AGB-related vegetation indices;Nindex,PNC-related vegetation indices.
Fig.8 shows that the Nc_RSdilution curve has strong stability,which lays the foundation for the multi-growth period NNI monitoring.The ranges of “a”,“b”,R2and RMSE were 2.02–2.10,0.62–0.73,0.50–0.82 and 0.12–0.14,respectively.In conclusion,the group CIrededge-sLAIDI was selected for constructing NNIRS(Table 4).
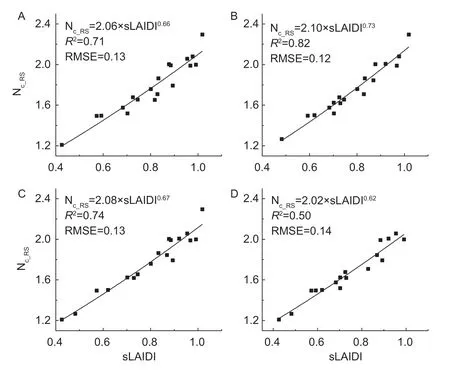
Fig.8 Correlations between standardized leaf area index determining index (sLAIDI) and remote-sensing-based critical N dilution curve (Nc_RS) at Exp.1/2/4 (A),Exp.1/2/3 (B),Exp.1/3/4 (C) and Exp.2/3/4 (D) growing seasons.
3.3.N nutrition index models constructed by the traditional method
NNlT1 modelsThe correlation between vegetation indices and NNI is shown in Table 5.The vegetation indices which had the highest correlation with NNI was OSAVI,CIrededge,EVI,and EVI during Exp.1/2/4,Exp.1/2/3,Exp.1/3/4 and Exp.2/3/4,with corresponding correlation coefficients of 0.78,0.84,0.77 and 0.56,respectively.
The NNIT1models were created by using the vegetation indices.After testing linear,exponential,and power models,the best regression model was selected for estimating the measured NNI.NNIT1models were constructed by selecting the vegetation indices (Table 6).The expression forms of NNIT1were NNIT1=0.52×OSAVI0.69,NNIT1=0.71×CIrededge0.55,NNIT1=0.31e1.77×EVI,NNIT1=1.01×EVI+0.28,withR2values of 0.68,0.73,0.64 and 0.33 and RMSE values of 0.13,0.12,0.15 and 0.14 during Exp.1/2/4,Exp.1/2/3,Exp.1/3/4 and Exp.2/3/4,respectively.The range of AIC was 1.18–5.08.The NNIT1model was the simplest (L=2),as it only involved two parameters,and it was found to have relatively high accuracy.
NNlT2 modelsThe relationships between vegetation indices and AGB and PNC were analyzed (Fig.9).The vegetation indices having the highest correlations with AGB were sLAIDI,NDchl,NDchl,and LAIDI during Exp.1/2/4,Exp.1/2/3,Exp.1/3/4 and Exp.2/3/4,with the corresponding correlation coefficients of 0.66,0.56,0.62 and–0.68,respectively.The vegetation indices having the highest correlations with AGB were DVI,PSSRa,SIPI,and sLAIDI during Exp.1/2/4,Exp.1/2/3,Exp.1/3/4 and Exp.2/3/4,with the corresponding correlation coefficients of 0.59,0.48,–0.39 and–0.49,respectively.
NNIT2models were constructed based on predicting AGB and PNC using the selected vegetation indices (Table 7),which obtained the most complex NNI inversion model.All performance values of the NNIT2models were excellent.TheR2values of NNIT1were 0.59,0.27,0.29 and 0.04 during Exp.1/2/4,Exp.1/2/3,Exp.1/3/4,and Exp.2/3/4,respectively.The RMSE values of NNIT2were 0.59,0.27,0.29 and 0.04 during Exp.1/2/4,Exp.1/2/3,Exp.1/3/4 and Exp.2/3/4,respectively.

Table 4 Results of N nutrition index remote sensing index (NNIRS) constructed by sLAIDI and CIred edge1)
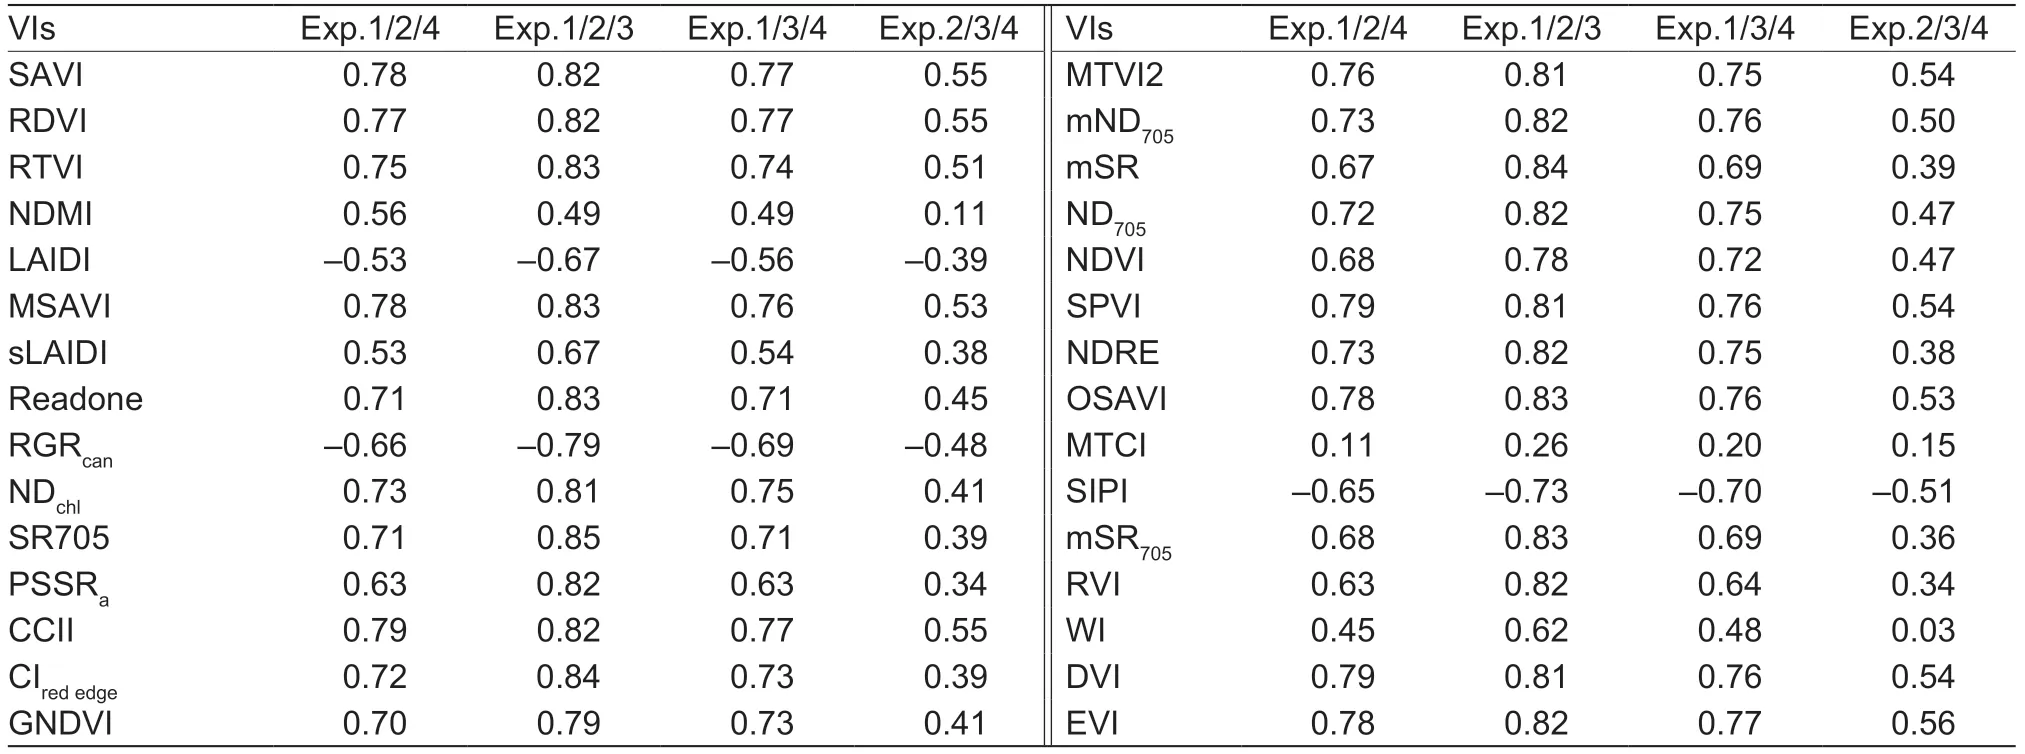
Table 5 Correlations between vegetation indices (VIs) and N nutrition index (NNI)1)

Table 6 Traditional direct NNI inversion (NNIT1) model using calibration sets1)

Table 7 Traditional indirect NNI inversion (NNIT1) model using calibration sets1)
3.4.NNlRS performance compared with the indirect N nutrition index
Fig.10 shows the relationships between the estimated and observed NNI obtained from different models.From the modeling results,the NNIT1models had the highest precision,followed by the NNIRSmodels,while the NNIT2models showed the worst precision.Using the data from the remaining growing season to verify the corresponding NNI models,NNIRSdemonstrated the most stable performance,followed by NNIT2,while NNIT1was the worst in stability.It was especially the case when using the 2012–2013 growing season data to verify the NNIT1model developed by Exp.2/3/4,which had an RMSE of 0.31,and the trend of predicted NNI was contrary to the measured NNI,which indicates almost no generalization between different years.The best NNI estimation was obtained from the NNIRSmodel,withR2values of 0.90,0.57,0.86 and 0.24 and RMSE values of 0.10,0.13,0.09 and 0.18 in 2012–2013,2012–2014,2014–2015 and 2015–2016,respectively.For NNIRS,although the experimental data from 2015–2016 were used to verify the poor results,the accuracy was still better than those of the other two models (Fig.9-J–L).The varieties used in the calibration sets did not include the varieties used in the verification set,so the N absorption and transport rules of different varieties of winter wheat might be different,resulting in poor verification results.In contrast,the potential of the NNIRSmodel was more significant.Overall,the NNIRSmodel developed in this study provided the most accurate estimate of NNI.
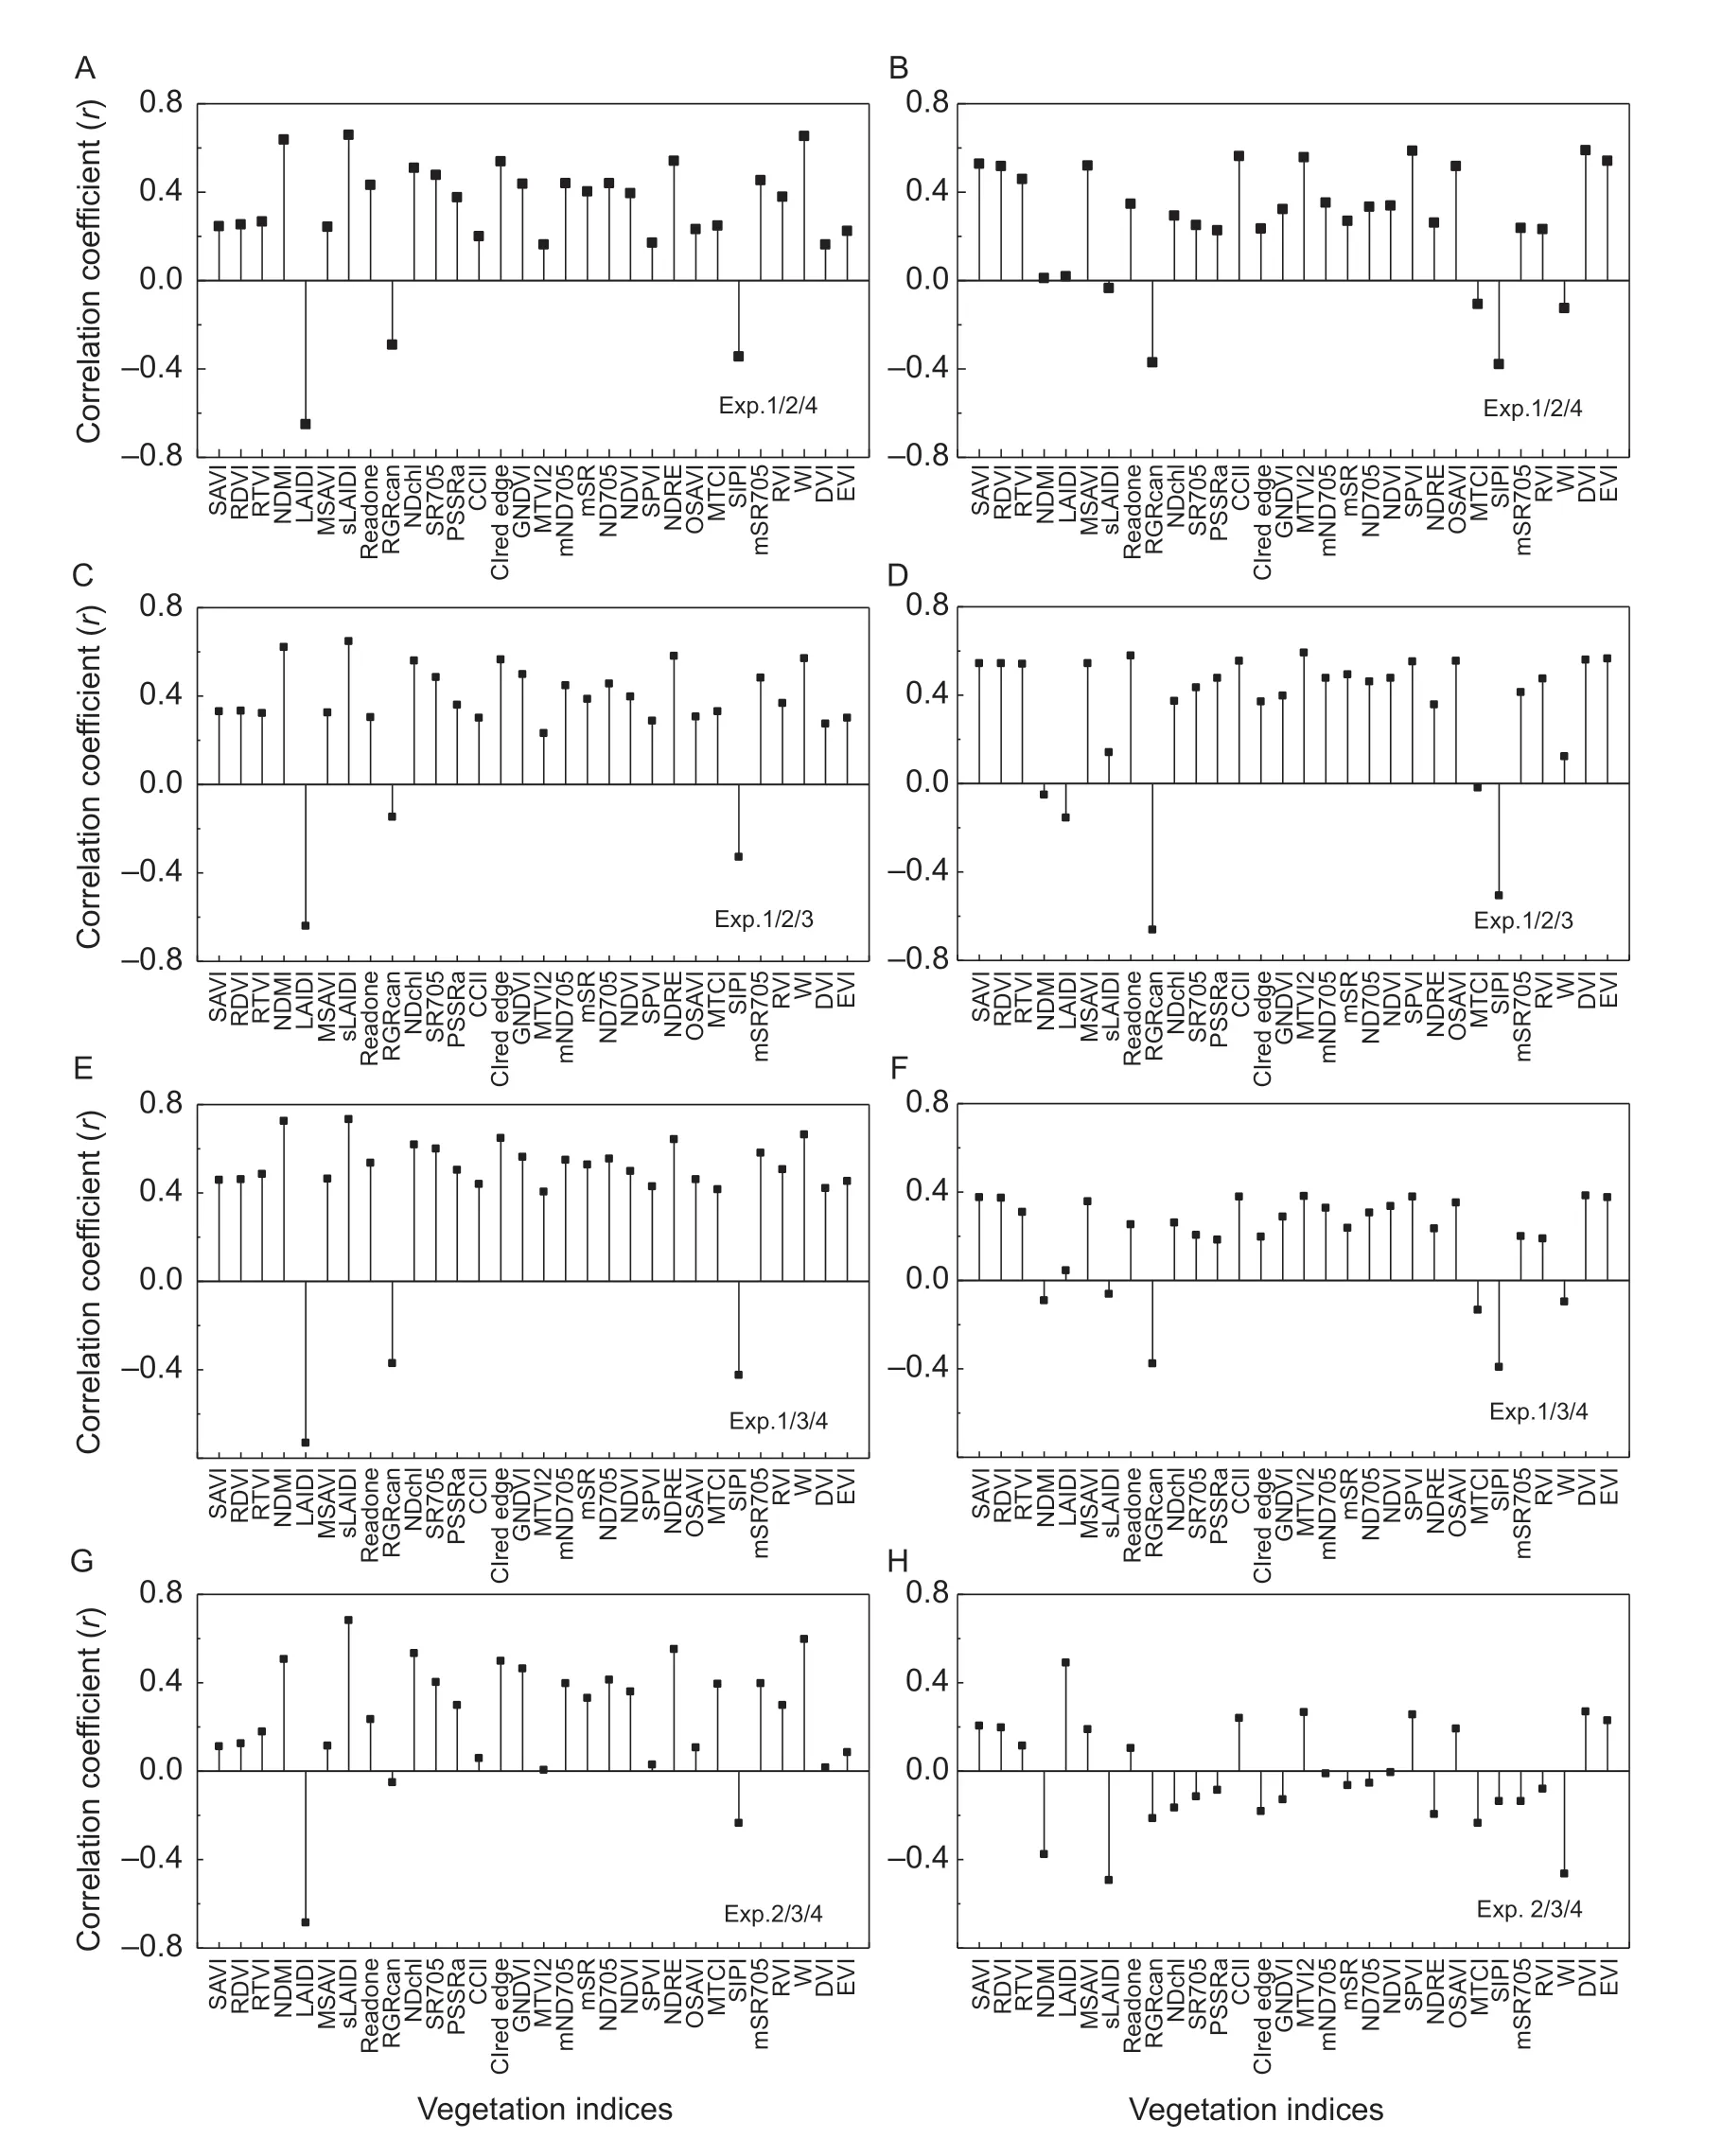
Fig.9 The relationships between vegetation indices and aboveground dry biomass (A,C,E and G) and plant N concentration (B,D,F and H).Exp.1/2/4,the experiments of 2012–2013,2013–2014 and 2015–2016;Exp.1/2/3,the experiments of 2012–2013,2013–2014 and 2014–2015;Exp.1/3/4,the experiments of 2012–2013,2014–2015 and 2015–2016;Exp.2/3/4,the experiments of 2013–2014,2014–2015 and 2015–2016.
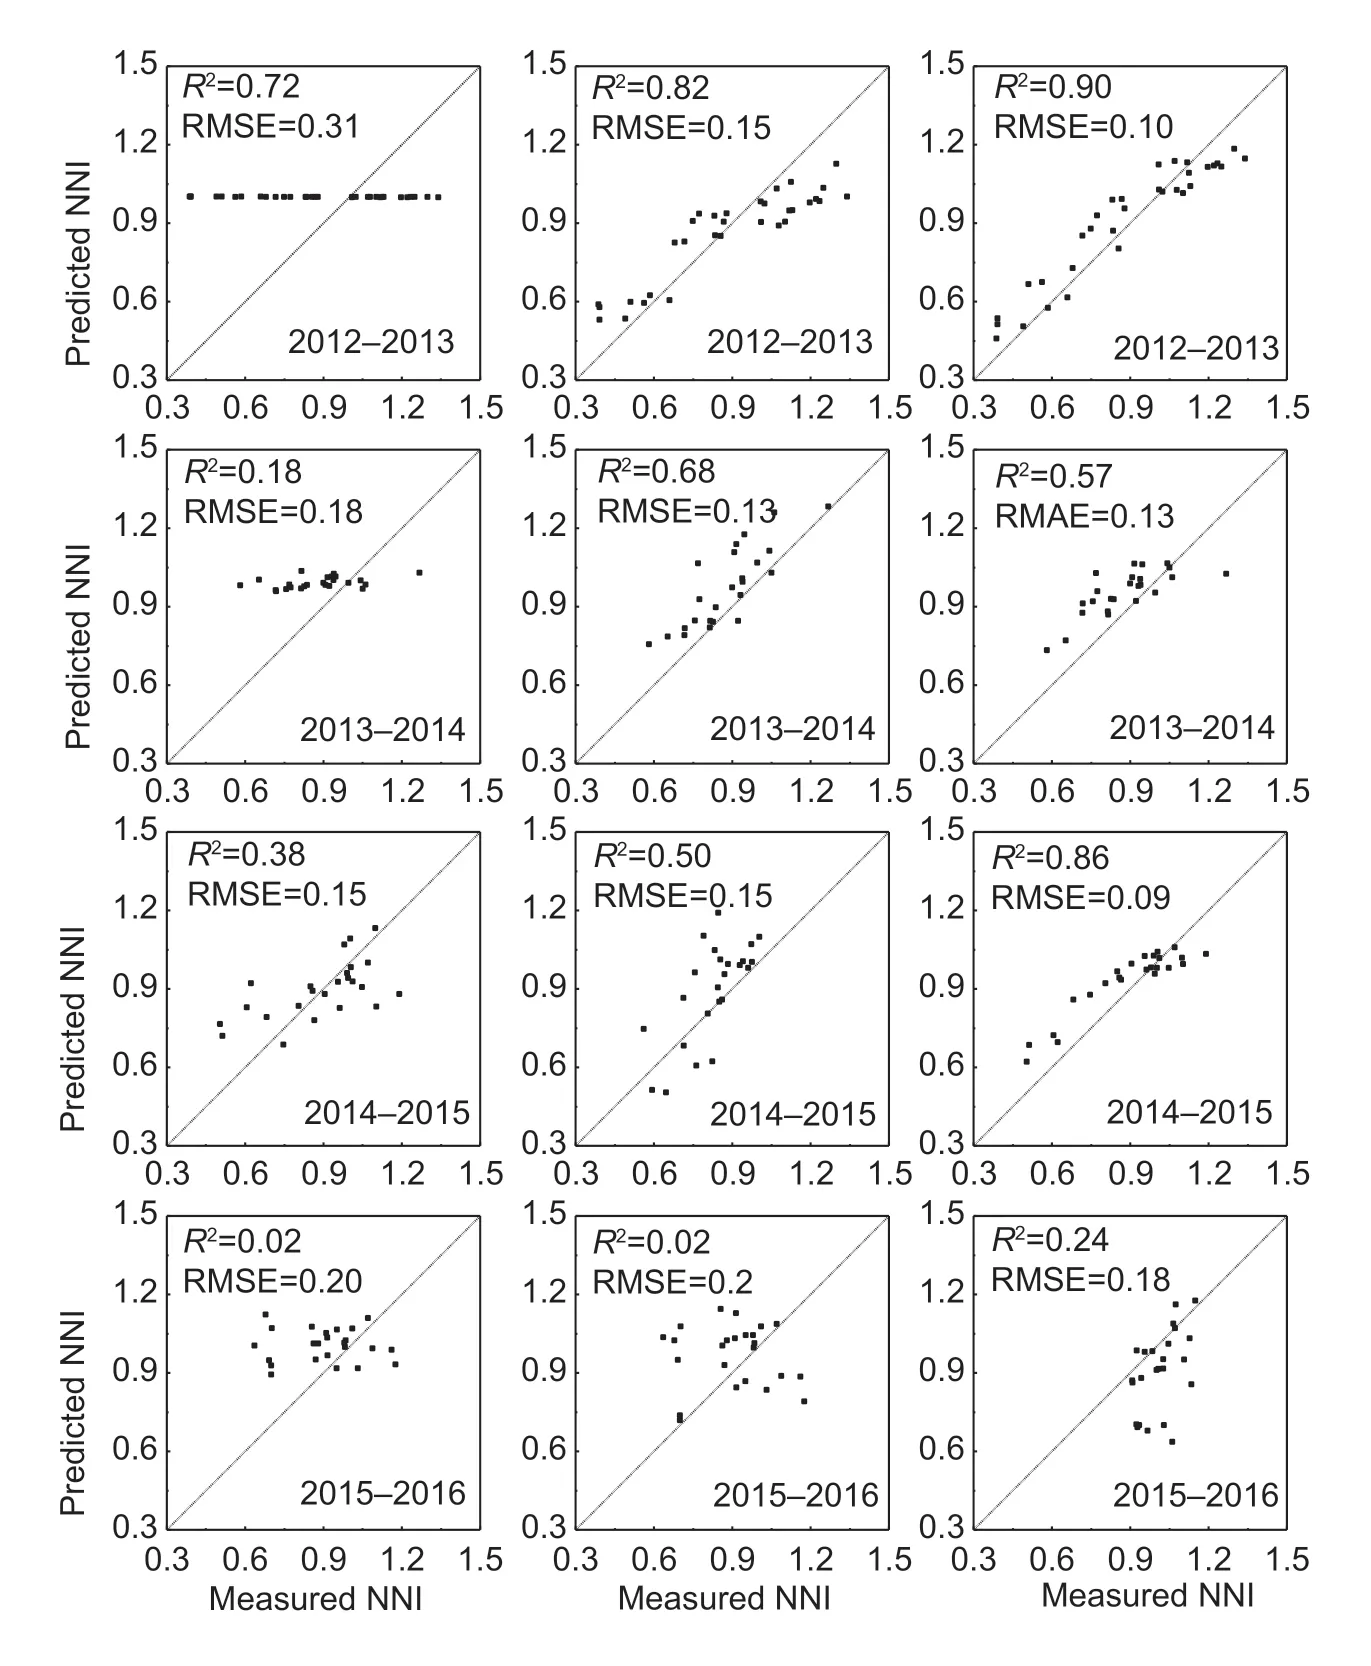
Fig.10 Relationships between measured N nutrition index (NNI) and predicted NNI by the NNIT1 method (A,D,G and J),the NNIT2 method (B,E,H and K),and the NNIRS method (C,F,I and L).NNIT1,traditional direct NNI inversion method;NNIT2,traditional indirect NNI inversion method;NNIRS,NNI remote sensing index.
4.Discussion
4.1.Agronomic N nutrition index
The Ncdilution curve of winter wheat was expressed using the negative power relationship between AGB and PNC in this study.There was no significant difference in parameters“a” and “b” of the Ncdilution curve between most varieties.Lemaireet al.(2008b) and Chenet al.(2013) stated that the Ncdilution curve remained relatively stable across different cultivars grown in the same region.The Ncdilution curves in the current study were lower than that of Justeset al.(1994).The reasons for this discrepancy could be related to the relatively long growing period and more favorable weather conditions (lower spring temperature and more rainfall) in Europe.However,the Ncdilution curves in this study were similar to that constructed by Yueet al.(2012).In that study,the two experimental sites were both located in the North China Plain with a continental monsoon climate.Therefore,climatic conditions may explain some of the differences in various published Ncdilution curves.
NNI is recognized as a reliable,plant-based indicator for diagnosing crop N status since it integrates AGB and PNC(Justeset al.1994;Chen 2015).The NNI value increased with an increasing N supply (Fig.6).Analogous results for the response of NNI to N levels had been reported in previous studies on wheat (Justeset al.1994;Yueet al.2012;Ata-Ul-Karimet al.2014;Wanget al.2017).The tendency of NNI decreased from the F6 stage to the F10.5 stage,consistent with the results of Heet al.(2017) and Lemaire and Gastal (1997).This tendency may be ascribed to an increase in PNC after topdressing at the jointing stage,leading to a large NNI.
4.2.Comparison of NNlRS and previous NNl research results
Most of the existing vegetation indices contain limited band information and are created for a certain crop parameter.For the NNIT1method,the best vegetation indices should be chosen to estimate NNI.Previous investigations achieved a high precision in NNI monitoring for a single growth period,but the applicability of NNI model across multiple growth periods needs to be further strengthened (Chen 2015;Liuet al.2019).The index constructed by Xiaet al.(2016),combined with the RI-VI,has obtained satisfactory results in the multi-period inversion of NNI.The research progress of RI-VI is similar to NNIRS,but the main difference is that RIVI requires the vegetation index of the plot with sufficient N fertilizer as the control.After Nc_RSdilution curve calibration,the application efficiency and widespread use of NNIRSwill be improved.
In this study,the relationship between vegetation indices and agronomic parameters was not as robust as in other studies,because several varieties and different growth stages were employed in the experiments.NNIT2was calculated based on the estimated values of AGB and PNC,which meant that multiple estimation errors were accumulated.Moreover,AGB and PNC were replaced by the vegetation indices to reduce the accumulation of such errors.Liet al.(2010) also concluded that the performance of vegetation indices differs with growth stages.They found that the best index explains 51% of the variation in PNC at later growth stages when the canopy is fully closed,but only 22% at earlier stages when the canopy partially covers the field.At different growth stages,the canopy structure and background information of winter wheat are different,which results in the differential sensitivity of the vegetation indices constructed in different growth stages to the agronomic indices.This complication leads to the difficulty in accurately assembling an agronomic parameter monitoring model of leaves across the whole growth stage through a single vegetation index.Zhaoet al.(2013) corroborated the appeal of this viewpoint.Therefore,it is reasonable that NNIT2also did not achieve an excellent performance in NNI monitoring.
However,two vegetation indices,sLAIDI and CIrededge,were used here to construct the NNIRSmodel.CIrededgeis derived from 720 and 750 nm,which successfully reduces the effect of differences in leaf surface reflectance.CIrededgeis a vegetation index designed to monitor chlorophyll.Since it is well known that chlorophyll has a strong correlation with N (Evans 1983),it is reasonable to use CIrededgeto represent PNC.This index is also relatively insensitive to species and leaf structure variation (Sims and Gamon 2002),which is why CIrededgestands out.The sLAIDI is expressed by the ratio of R1050to R1250.This index was initially used as an indicator of leaf area index (Delalieuxet al.2008).The sLAIDI is constructed from the near-infrared band,and in general,near-infrared bands have a good relationship with biomass.The previous findings indicated that a vegetation index based on the combination of two wavelengths (1 250 and 1 050 nm,respectively) was reasonably stable under changing stages of phonological development (Delalieuxet al.2008).In this study,the experimental datasets of four growing seasons were cross-validated to NNI models,and the vegetation indices in the NNIRSmodel were sLAIDI as AGB and CIrededgeas PNC,which had high stability across years.In summary,our results provided a novel method to predict NNI,which could be useful for precise N management.
4.3.Application potential of NNlRS
The existing NNI models were built at the organ scale and canopy scale,but this study mainly considered the canopy scale.In the future,NNIRSalso can be explored in leaves,stems and spikes according to different needs.The four bands involved in sLAIDI and CIrededgeare in the red band and the near-infrared band,respectively,which are easy to obtain from satellites.GF-5,which has 330 bands,was launched by China in 2018 and it will be of great significance in future agricultural applications.Many previous studies have shown that the spectral reflectance obtained from different satellites is consistent,and the bands of Sentinel-2,Landsat-8 and Worldview-2 can be used together if necessary.Besides,it is sensible to develop professional N diagnostic instruments on the ground.Overall,the application of NNIRSconstructed in this study can be expanded to a broader region.
5.Conclusion
In this study,Nc_RSdilution curve was constructed by replacing AGB and PNC with two related vegetation indices.The resulting NNIRSbased on selected PNC related vegetation indices and Nc_RSdilution index was calculated to diagnose plant N status in winter wheat.The significant results of this work are summarized as follows:
(1) The Ncdilution curve in the study area could be calculated as Nc=4.84×AGB–0.40withR2=0.74.
(2) The NNIRSmodel was combined with sLAIDI and CIrededgein the form of NNIRS=CIrededge/(a×sLAIDIb),where “a”is equal to 2.06,2.10,2.08 and 2.02 and “b” is equal to 0.66,0.73,0.67 and 0.62 for Exp.1/2/4,Exp.1/2/3,Exp.1/3/4 and Exp.2/3/4,respectively.
(3) The accuracy of NNIRSresults are higher than that of the other two NNI inversion methods with remote sensing.
Our results confirmed the utility of the NNIRSmodel for precise N management in the field.Future work should develop the ability to provide recommendations about fertilizer dosage using the NNIRSmodel.
Acknowledgements
This research was supported by the earmarked fund for China Agriculture Research System (CARS-03),the National Key Research and Development Program of China(2017YFD0201501 and 2016YFD020060306) and the National Natural Science Foundation of China (41701375 and 61661136003).
Declaration of competing interest
The authors declare that they have no conflict of interest.
杂志排行
Journal of Integrative Agriculture的其它文章
- Errata regarding previously published articles
- Mental accounting and consumption of self-produced food
- Do credit constraints affect households’ economic vulnerability?Empirical evidence from rural China
- Fate of low-molecular-weight organic phosphorus compounds in the P-rich and P-poor paddy soils
- Changes in soil organic carbon pools following long-term fertilization under a rain-fed cropping system in the Loess Plateau,China
- Peanut yield,nutrient uptake and nutrient requirements in different regions of China
