Peanut yield,nutrient uptake and nutrient requirements in different regions of China
2021-07-24ZHAOShichengJilongXUXinpengLINXiaomaoLuizMoroROSSOQIUShaojunIgnacioCIAMPITTIHEPing
ZHAO Shi-cheng,LÜ Ji-long,XU Xin-peng,LIN Xiao-mao,Luiz Moro ROSSO,QIU Shao-jun,Ignacio CIAMPITTI,HE Ping
1 Key Laboratory of Plant Nutrition and Fertilizer,Ministry of Agriculture and Rural Affairs/Institute of Agricultural Resources and Regional Planning,Chinese Academy of Agricultural Sciences,Beijing 100081,P.R.China
2 Department of Agronomy,Kansas State University,Manhattan,KS 66506,USA
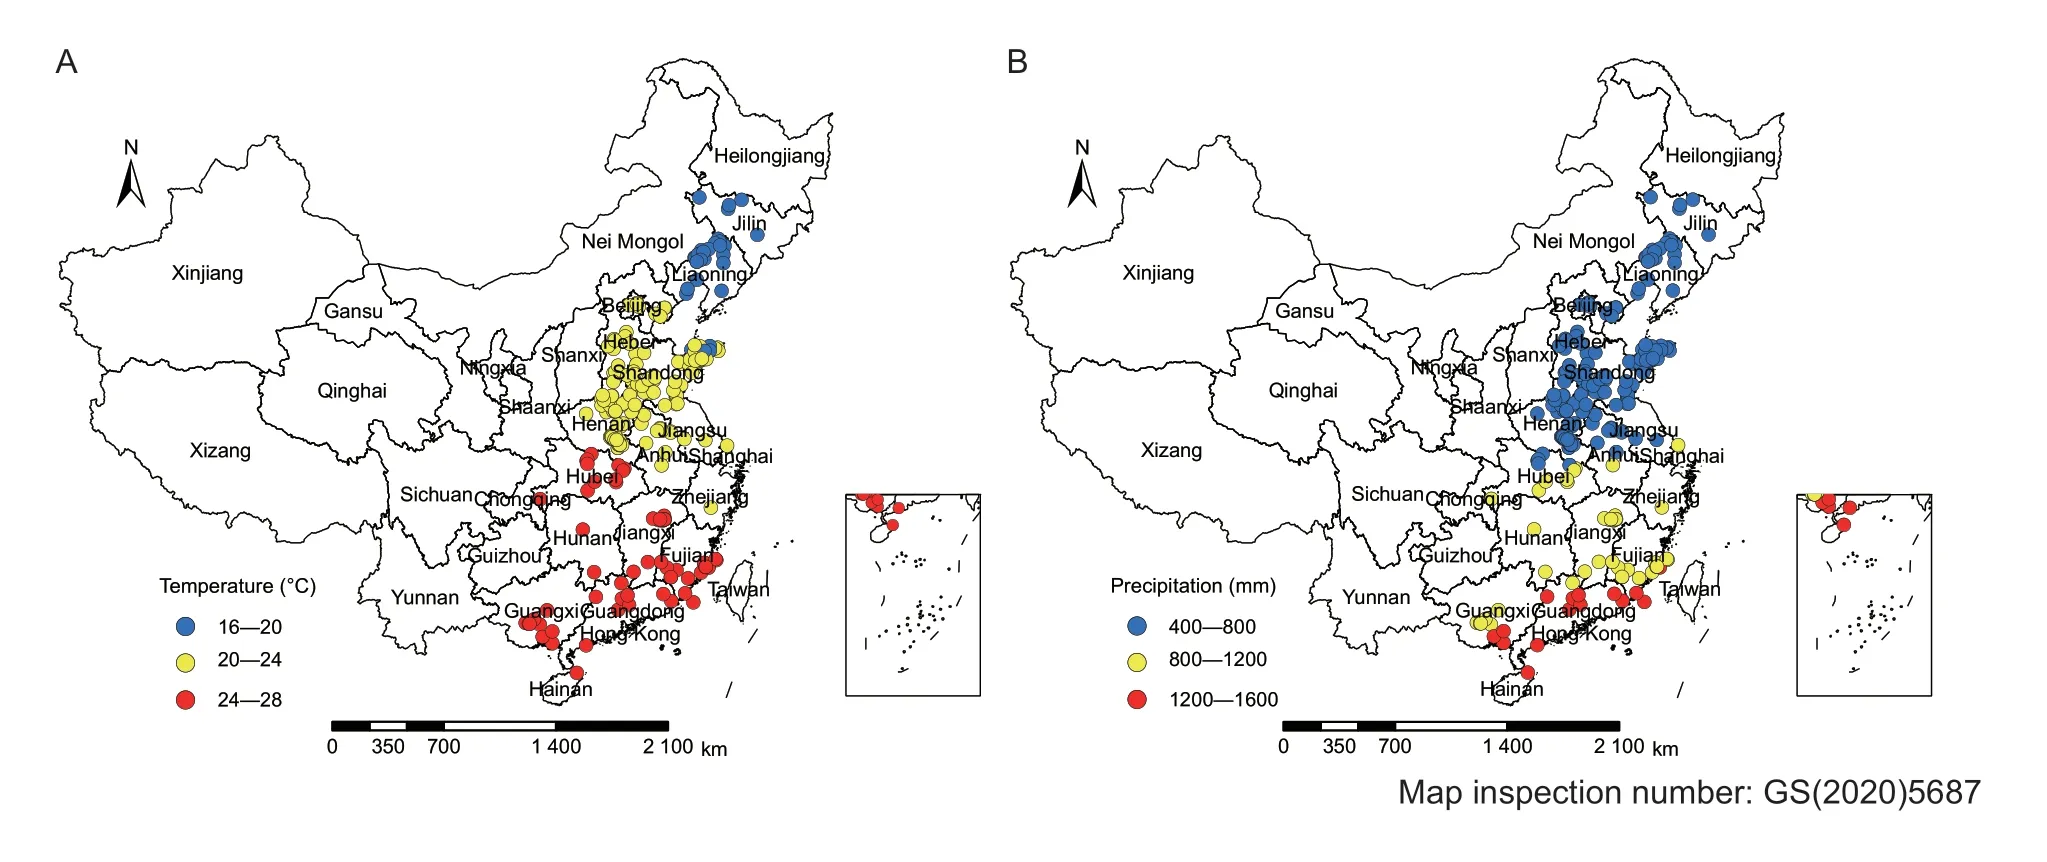
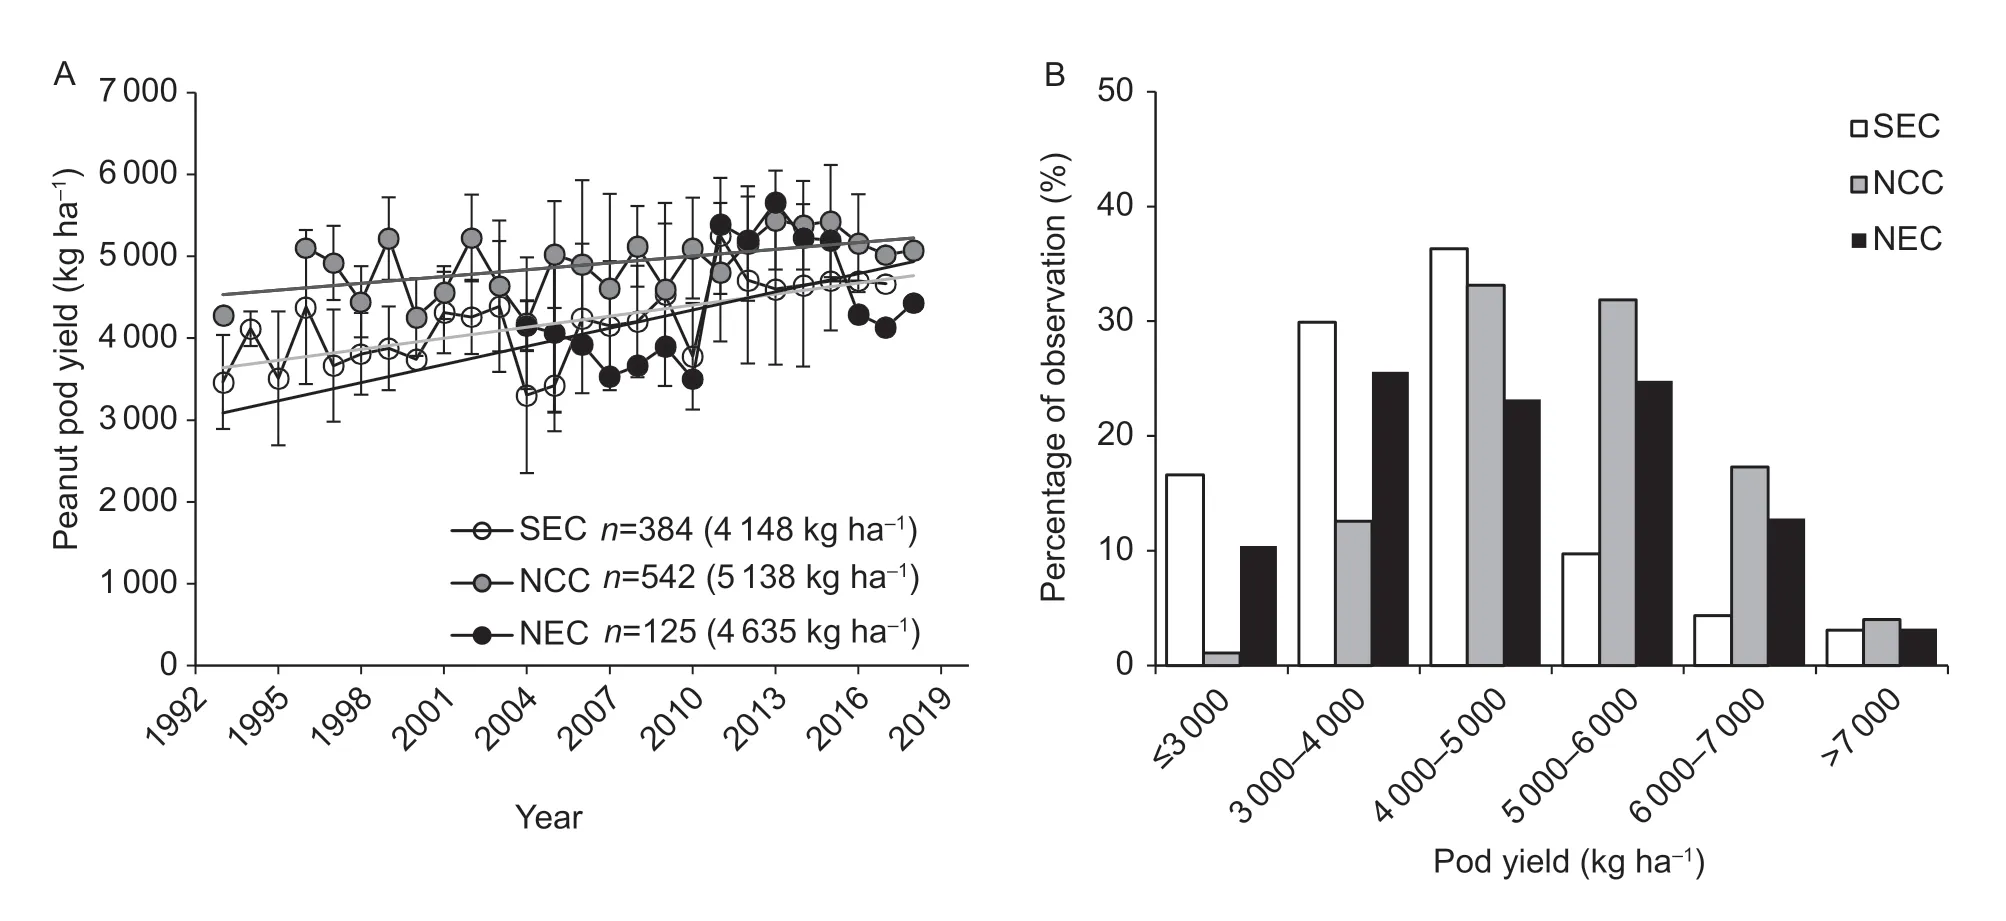
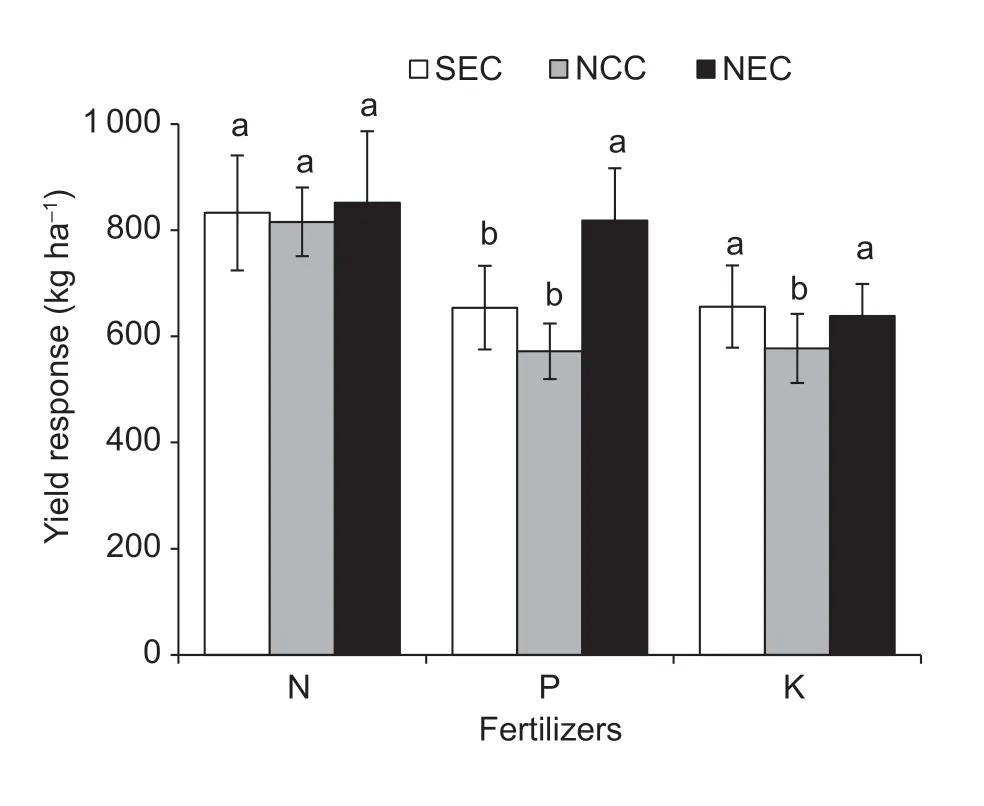
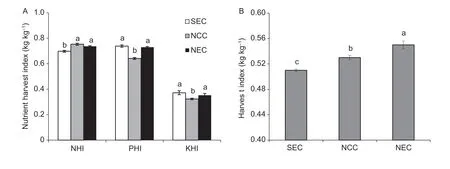
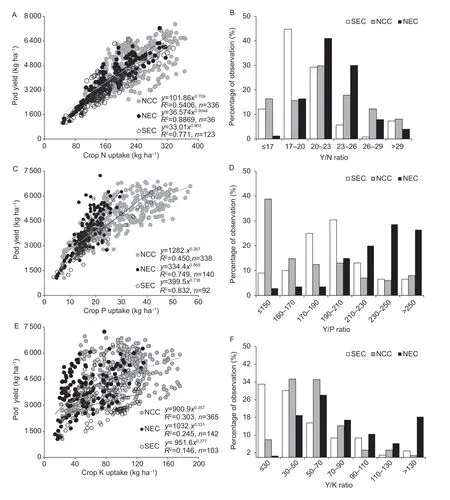
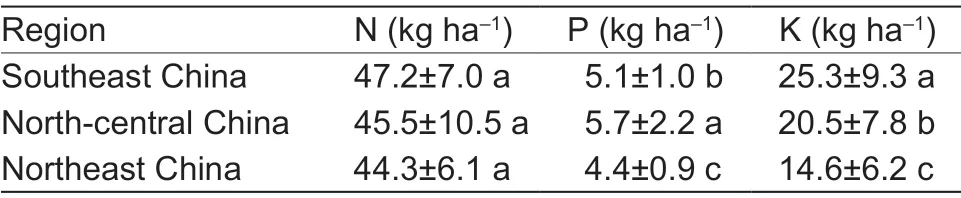
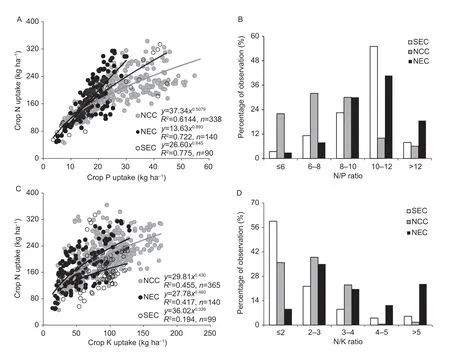
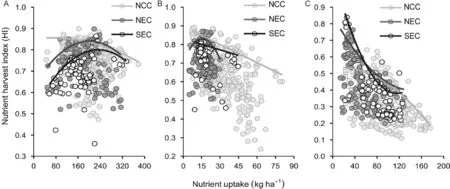
Abstract Nutrient balance is essential for attaining high yield and improving profits in agricultural farming systems,and crop nutrient uptake ratio and stoichiometry can indicate crop nutrient limitations in the field.We collected a large amount of field data to study the variations in yield,nutrient uptake and nutrient stoichiometry of peanut (Arachis hypogaea L.) in Southeast China (SEC),North-central China (NCC),and Northeast China (NEC),during 1993 to 2018.Peanut pod yield gradually increased from 1993 to 2018,with average yields of 4 148,5 138,and 4 635 kg ha–1 in SEC,NCC,and NEC,respectively.The nitrogen (N) internal efficiency (NIE,yield to N uptake ratio) was similar among the three regions,but phosphorus(P) IE (PIE,yield to P uptake ratio) changed from low to high among regions:NCC Keywords:peanut,pod yield,nutrient internal efficiency,nutrient stoichiometry,harvest index Peanut (ArachishypogaeaL.) is an important grain legume grown worldwide,mainly as a source of edible oil and vegetable protein for humans.Global consumption of peanuts is increasing at a rate of 3% per year,and increasing yield is essential for securing edible oil production(Agegnehuet al.2015).Crop yield potential is determined by a combination of solar radiation,temperature,soil fertility,plant variety and density at a given location (van Ittersum and Rabbinge 1997;Southworthet al.2002).Optimum field nutrient management is one key management practice to reduce the yield gap between potential and attained yields.The legume crop has a high nitrogen (N) requirement due to its high grain protein content (Bellalouiet al.2015).Peanut can only fix N from the atmosphere by rhizobia,but the contribution of Nviabiological N fixation (BNF)is not sufficient to meet the plant’s N demand,especially under high yield or when N fixation is inhibited,therefore,application of chemical fertilizer N is necessary to attain high yield.Additionally,phosphorus (P) is closely related to N due to P deposition (phytate) with protein bodies in the grains(Araújo and Teixeira 2003).Besides P plays a key role in the functionality of the BNF process (Singletonet al.1985). Balanced nutrition is crucial for attaining high yield,and the assessment of soil nutrient supply and peanut nutrient demand is the premise for developing optimum nutrient management decision support tools.The relationship between yield and nutrient uptake,expressed as the nutrient internal efficiency (IE,yield to nutrient uptake ratio) and plant nutrient ratio (e.g.,N/P and N/K),can be utilized to assess crop nutrient limitations in the field (Ciampitti and Vyn 2012;Chuanet al.2013;Xuet al.2013).Xuet al.(2013) indicated that maize P uptake was luxury in most fields of China,while Chuanet al.(2013) reported that K uptake was excessive in spring wheat in Northwest China based on the Quantitative Evaluation of the Fertility of Tropical Soils (QUEFTS) model.The N/P ratio has been proposed as a diagnostic tool for nutrient limitations in natural vegetation (Verhoevenet al.1996;Gusewellet al.2003).In legumes,Sadras (2006)documented that changes in P rather than N better explained variations in N/P ratio,since N is more closely regulated than P.Tamagnoet al.(2017) documented that end-of-the season variations in nutrient ratios in soybean (GlycinemaxL.) were closely related to their seed and stover partitioning,with nutrient concentrations in the stover better explaining the variation in nutrient ratios. China is the top country for peanut production,accounting for 20% of the planting area and 40% of the yield globally(Zhuet al.2019).North-central China (NCC) is the main production area,followed by Northeast China (NEC) and Southeast China (SEC).Different varieties of peanut and cropping systems are used in different regions due to varied regional climate conditions;for example,pearl peanut is prevalent in southern China and is planted in spring,summer,or autumn,while the peanut with big seeds,planted in summer,is popular in NCC (Donget al.2012).Such variations result in large differences in peanut yield and nutrient uptake (Liuet al.2017);but,so far,the copious data on nutrient uptake in peanut over a range of genotypes and environments in China has not yet been synthesized.Here,we collected data from 374 field trials of peanut in the main production area to investigate the variations in pod yield and nutrient uptake across those regions of China.These assessments can provide a relevant basis for optimum nutrient management to increase peanut production. The database of peanut trials used in this study consisted of 374 field experiments conducted by the International Plant Nutrition Institute (IPNI) China Program,the National Key Research and Development Program of China,and papers published in academic journals from 1993 to 2018(e.g.,Gaoet al.2011;Lianget al.2016;Siet al.2017).The experimental treatments in these studies included optimum nutrient combinations (the rates of N,P,and K applied were based on soil test results combined with target yield),different fertilization rates,nutrient omission treatments (lack of nutrient applications) based on optimum nutrient treatments.The measurements included across all studies were pod yield,pod and stover nutrient uptake,and above-ground biomass (total biomass) at maturity.Peanut varieties utilized in these research trials were all commonly planted in local production.The average daily temperature and total precipitation during the peanut growth seasons of each experimental site are shown in Fig.1. Fig.1 Average air temperature (A) and total precipitation (B) during the peanut growth season of each experimental site in China(1993–2018).These climatic data came from China Meteorological Administration. A cropping system is significantly affected by climatic conditions.Based on the average air temperature during peanut growth and sowing seasons,we divided the experimental sites in three regions of China,NEC (including Jilin,and Liaoning provinces,average temperature≤20°C,sown in later April or early May as spring peanut),NCC(including Hebei,Henan,Shandong,Anhui,Jiangsu provinces,Beijing and Tianjin cities,20°C HI=Pod yield/(Pod yield+Stover yield) Nutrient HI=Pod nutrient uptake/Total nutrient uptake IE (kg kg–1)=Pod yield/Total nutrient uptake where total nutrient uptake refers to the nutrient accumulation in the above-ground biomass. Differences in average pod yield,yield response,HI,and nutrient HI among regions were analyzed using one-way analysis of variance,and their means were compared based on the least significant difference (LSD) test atP<0.05 using the SPSS 19.0 Software package for Windows (SPSS,Inc.,Chicago,IL,USA).Relationships between pod yield and nutrient uptake (for N,P,and K) were implemented with SPSS 19.0 Software package for Windows using the power function.Relationships between nutrient uptake (for N/P and N/K ratios) were fitted using linear functions with Microsoft Excel for Windows.A frontier analysis for nutrient HI×uptake was performed using the R Software (R Core Team,2017),with the “quantreg” package (Koenker 2005).The boundary functions were fitted for each region by calculating the 90th percentile for the nutrient HI×uptake dispersion and the best model was selected using the Akaike information criterion,among linear,quadratic,and exponential fits. Peanut pod yield gradually increased from 1993 to 2018 across all three regions,averaging 4 148,5 138,and 4 635 kg ha–1in SEC,NCC,and NEC,respectively (Fig.2-A).There was great variation in peanut yield among the different regions,with 76% of all the sites distributed in the yield range of 3 000–5 000 kg ha–1in SEC,65% of sites distributed within 4 000–6 000 kg ha–1in NCC,and 74% of sites distributed within 3 000–6 000 kg ha–1in NEC (Fig.2-B). Fig.2 Change in average peanut pod yield (A) and frequency (in percentage) of observations (B) in the three regions of China(1993–2018).SEC,Southeast China;NCC,North-central China;NEC,Northeast China.Bars in A indicate SE (n=5–65).Yield data are from the optimum nutrient combination treatments,and the data in brackets in A are average pod yields. Peanut yield response to N fertilizer did not present significant differences among the three regions (Fig.3).The P yield response was greater in NEC,and both P and K yield responses were lower in NCC relative to other regions. Fig.3 Yield response to fertilizers (N,nitrogen;P,phosphorus;K,potassium) for peanut in the three regions of China (1993–2018).SEC,Southeast China;NCC,North-central China;NEC,Northeast China.Bars indicate SE (n=12–56).Different letters indicate significant differences among regions (P<0.05). The overall N harvest index (NHI) was similar between the NCC and NEC but larger in relation to the mean value documented for SEC (Fig.4-A).The overall P harvest index(PHI) and K harvest index (KHI) were similar between SEC and NCC,and these values were greater than those in NCC.The HI for peanuts changed from low to high values following the order of SEC Fig.4 Nutrient harvest index (A) and harvest index (B) for peanut in the three regions of China (1993–2018).NHI,nitrogen harvest index;PHI,phosphorus harvest index;KHI,potassium harvest index;SEC,Southeast China;NCC,North-central China;NEC,Northeast China.Bars indicate SE (n=24–57).Different letters indicate significant differences among regions (P<0.05). Peanut yield and above-ground N uptake (NIE,slope) fitted a similar model across all three regions (Fig.5-A),but the NIE presented greater variation in NCC relative to the other regions.While 75% of the NIE data ranged from 17 to 23 kg pod kg–1N in SEC,and 70% ranged from 20 to 26 kg pod kg–1N in NEC,only 30% ranged from 20 to 26 kg pod kg–1N in NCC (Fig.5-B).The average NIE was 21.2,22.0,and 22.8 kg pod kg–1N in SEC,NCC,and NEC,respectively. The relationship between pod yield and P uptake differed significantly among the three regions based on the slopes of the fitted curves (Fig.5-C).For the P internal efficiency(PIE),55% of the data ranged from 170 to 210 kg pod kg–1P in SEC,75% above 210 kg pod kg–1P in NE,and 39%below 150 kg pod kg–1P in NCC (Fig.5-D).The average PIE was 195.6,175.2,and 233.3 kg pod kg–1P in SEC,NCC,and NEC,respectively. The relationship between pod yield and K uptake (KIE)differed significantly among three regions (Fig.5-E).For the KIE,63% of the data were below 50 kg pod kg–1K in SEC,70% ranged from 30 to 70 kg pod kg–1K in NCC,and 64% ranged from 30 to 90 kg pod kg–1K in NEC (Fig.5-F).On average,KIE was 49.8,56.1,and 85.4 kg pod kg–1K in SEC,NCC,and NEC,respectively. Fig.5 The relationship between peanut yield and total above-ground nutrient uptake (A,C and E) and frequency (in percentage)of observations (B,D and F) in different regions of China (1993–2018) (the trend line has the same color as the treatment data).SEC,Southeast China;NCC,North-central China;NEC,Northeast China.Y/N,pod yield/N uptake;Y/P,pod yield/P uptake ;Y/K,pod yield/K uptake.Due to lack of significant differences (P>0.05) in the slopes of different treatments,the data of all treatments in the same region were pooled. Based on the nutrient IE,to produce 1 Mg of pod yield,the average N,P,and K requirements of peanuts were 47.2,5.1,and 25.5 kg in SEC,but 44.8,5.7,and 20.6 kg in NCC,and 44.6,4.4,and 14.7 kg in NEC,respectively (Table 1). Table 1 The nutrient requirement rate per Mg peanut pod yield in the three regions of China For the relationship between N and P uptake of peanut,the slopes of the fitted curves were greater in SEC and NEC compared with that in NCC (Fig.6-A).For the N/P ratio,more than 70% of the data ranged from 8 to 12 in SEC and NEC;however,87% of the N/P data were below 10 in NCC(Fig.6-B).The average N/P ratios were 10,7.2,and 10 in SEC,NCC,and NEC,respectively.The average N/K ratios were 2.3,2.5,and 3.7 in SEC,NCC,and NEC,respectively(Fig.6-C).In addition,75% of the data were below 4 in SEC and NCC;however,56% ranged from 2 to 4,and 24% were above 5 in NEC (Fig.6-D). Fig.6 Relationship between peanut total nutrient uptake (A and C) and frequency (in percentage) of observations (B and D) in different regions of China (1993–2018) (the trend line has the same color as the treatment data).SEC,Southeast China;NCC,North-central China;NEC,Northeast China.Due to lack of significant differences (P>0.05) in the slopes of different treatments,the data of all treatments in the same region were pooled. The NHI presented distinct changes with increasing crop N uptake in the three regions (Fig.7-A).The frontier analysis for NHI showed that this factor increased under low crop N uptake and then declined under high N uptake with the increase in crop N uptake in SEC and NEC.The 90%boundary did however vary with the region evaluated in China.Likewise,the potential maximum PHI declined with the increasing P uptake.On average,PHI did not change significantly in NEC but it gradually declined in NCC and SEC with increasing P uptake,and the rate of decrease was greater in NCC than in SEC (Fig.7-B).Lastly,the KHI showed a large decline due to increases in plant K uptake with changes across all the regions evaluated (Fig.7-C). Fig.7 Relationship between nutrient harvest index and total nutrient uptake of peanut in different regions of China (1993–2018).A,nitrogen.B,phosphorus.C,potassium.NCC,North-central China;NEC,Northeast China;SEC,Southeast China.Due to lack of significant difference (P>0.05) in slope of different treatments,the data of all treatments were pooled in the same region.Boundary functions were fitted for the 90th percentile with the quadratic model presenting the best fit for all the locations and nutrient combinations,except for P in NCC and SEC (linear fit). Peanut pod yield gradually increased from 1993 to 2018 in the three regions of China,consistent with the reports of Donget al.(2012),who attributed the yield increase to the improvement in peanut varieties,application of balanced fertilization,and the combination with other agricultural technologies.The highest attainable yield under optional conditions can represent the crop potential yield (Caiet al.2010).The highest attainable pod yield of peanut gradually increased from 1993 to 2018 across the three regions (Appendix A),meaning the potential yield gradually increased due to updated varieties of peanut.The NCC presented greater peanut yield relative to both SEC and NEC.The warm climate,adequate precipitation,and sandy soil are favorable for peanut growth (Chenet al.2011),and Yanget al.(2019) indicated that the North China Plain was the most suitable area for the growth and high yield of peanut production based on 13 estimated indexes (temperature,precipitation,soil fertility,etc.) in China.According to our data,soil total P,total K and available P were higher in NCC relative to those in SEC and NEC (Appendix B),which in turn resulted in lower yield responses to P and K fertilizers in NCC relative to those in SEC and NEC,which was supported by the negative correlation between yield response and soil endogenous nutrient supply (Xuet al.2014).In NCC and NEC,the average peanut pod yield gradually increased from 1993 to 2018,but the rate of N,P,and K fertilizers did not significantly change during this period of time,highlighting that other factors besides fertilization have driven yield changes over time (e.g.,new varieties). Crop nutrient uptake and stoichiometry are mainly influenced by soil nutrient supply and crop genotypes.Notwithstanding the differences in soil N content and N fertilization among the three regions,the NIE did not differ (Appendix C)potentially due to a compensation between N contribution from BNF and soil N supply to meet the plant N demand.The PIE among the three regions changed from low to high as:NCC The nutrient ratio can help predict nutrient limitations for biomass production better than individual nutrient contents(Koerselman and Meuleman 1996;Balboaet al.2018).By combining it with NIE and PIE,the difference in the N/P ratio of peanut indicated that the ratio was mainly influenced by crop P uptake.Sadras (2006) also found that the variation in the N/P ratio was primarily explained by P rather than N uptake in legumes.In addition,the N concentration in the reproductive organs of legume crops is a conservative trait,presenting a small variation (Long 2013;Balboaet al.2018).Similarly,the variation in the N/K ratio of peanut was mainly regulated by crop K uptake,related to the amount of variation observed in KHI and the ability of the plant toallocate K to the stover fraction. Nutrient availability and nutrient uptake for immediate use and storage in crops are major sources of variation in the nutrient ratio (Bollons and Barraclough 1999;Ågren 2008).The HI was greater in NCC relative to SEC;however,the PHI and KHI were lower in NCC compared with SEC,while PHI and KHI declined with increasing peanut P and K uptake in all regions except for PHI in NEC.Clover and Mallarino(2013) indicated that higher yield was associated with a substantial increment in stover K accumulation,reductions in seed K uptake and KHI for soybean.Potassium is easily translocated among organelles,cells,and organs of crops,and K is translocated from stem to seed when soil is K deficient,and more K is accumulated in stover when K uptake exceeds the crop K requirement (Rengel and Damon 2008;Ciampitti and Vyn 2012).Penget al.(2013)reported that pod K did not significantly change,but stover K increased with K fertilization rate although no yield response occurred in peanut.Lastly,as the nutrient supply increases,the efficiency in partitioning nutrients to the reproductive organs decreases as reflected in the upper limit for nutrient HI factor (Voset al.1997;Milroyet al.2019). From the nutrient management standpoint,the peanut cultivated in NCC attained the highest yield relative to both SEC and NEC,but the KIE was greater relative to SEC and lower to NEC.These results suggested that K was deficient in NEC,so K fertilization should be decreased in SEC but increased in NEC to attain high yields and improve profits of peanut.Lastly for P,the average N/P ratio reported for legume crops was 8.7 (Sadras 2006),with a lower N/P ratio(7.2) in NCC indicating that P luxury uptake existed and the rate of P fertilization should be decreased in this region,consequently increasing profits and decreasing the risk of environmental pollution. Our results showed that peanut yield gradually increased over time in the main production areas since 1993 and the highest yield was attained in NCC.There were no differences in NIE among the three regions,but the PIE was lower in NCC and KIE was greater in NEC compared with those in other regions.The N/P and N/K ratios presented similar changes to those in PIE and KIE among peanut production regions.The low PIE and N/P ratios in NCC can be explained by the low PHI due to great proportion of P accumulation in stover,and the high KIE and N/K ratios in NEC might be caused by low soil K supply capacity.The frontier analysis highlighted that the increase in nutrient uptake decreased nutrient use efficiency in the reproductive organs,but with low levels in N uptake (<150 kg ha–1),N allocation in the pod increased with increasing N uptake in SEC and NEC.This study demonstrated potential deficiencies and excesses of nutrients for peanut plant nutrition in different regions of China,providing a useful foundational knowledge for implementing nutrient management strategies and new support decision tools. Acknowledgements This project was supported by the National Key Research and Development Program of China (2018YFD0201001 and 2016YFD0200102) and the Kansas Agricultural Experiment Station,USA (21-079-J). Declaration of competing interest The authors declare that they have no conflict of interest. Appendicesassociated with this paper are available on http://www.ChinaAgriSci.com/V2/En/appendix.htm1.Introduction
2.Materials and methods
2.1.Data sources
2.2.Data analysis
2.3.Statistical analysis
3.Results
3.1.Peanut yield
3.2.Yield response,harvest index,and nutrient harvest index
3.3.Internal nutrient efficiency and nutrient requirements per Mg peanut yield
3.4.Nutrient stoichiometry
3.5.Relationship between NHI and total nutrient uptake
4.Discussion
4.1.Peanut yield
4.2.Nutrient uptake and stoichiometry
5.Conclusion
杂志排行
Journal of Integrative Agriculture的其它文章
- Errata regarding previously published articles
- Mental accounting and consumption of self-produced food
- Do credit constraints affect households’ economic vulnerability?Empirical evidence from rural China
- An entirely new approach based on remote sensing data to calculate the nitrogen nutrition index of winter wheat
- Fate of low-molecular-weight organic phosphorus compounds in the P-rich and P-poor paddy soils
- Changes in soil organic carbon pools following long-term fertilization under a rain-fed cropping system in the Loess Plateau,China