ldentifying SNPs associated with birth weight and days to 100 kg traits in Yorkshire pigs based on genotyping-by-sequencing
2021-07-24WUPingxianZHOUJieWANGKaiCHENDejuanYANGXidiLlUYihuiJlANGAnanSHENLinyuanJlNLongXlAOWeihangJlANGYanzhiLlMingzhouZHULiZENGYangshuangXUXuQlUXiaotianLlXueweiTANGGuoqing
WU Ping-xian,ZHOU Jie,WANG Kai,CHEN De-juan,YANG Xi-di,LlU Yi-hui,JlANG An-an,SHEN Lin-yuan,JlN Long,XlAO Wei-hang,JlANG Yan-zhi,Ll Ming-zhou,ZHU Li,ZENG Yang-shuang,XU Xu,QlU Xiao-tian,Ll Xue-wei,TANG Guo-qing
1 Farm Animal Genetic Resources Exploration and Innovation Key Laboratory of Sichuan Province,Sichuan Agricultural University,Chengdu 611130,P.R.China
2 College of Life Science,Sichuan Agricultural University,Ya’an 625014,P.R.China
3 Sichuan Animal Husbandry Station,Chengdu 610041,P.R.China
4 National Animal Husbandry Service,Beijing 100125,P.R.China
Abstract Birth weight (BW) and days to 100 kg (D100) are important economic traits that are both affected by polygenes.However,the genetic architecture of these quantitative traits is still elusive.Genotyping-by-sequencing (GBS) data containing a large number of single nucleotide polymorphisms (SNPs) have become a powerful tool in genomic analysis.To better understand their complex genetic structure,a total of 600 Yorkshire pigs were sequenced using GBS technology.After quality control,279 787 SNPs were generated for subsequent genome-wide association study (GWAS).A total of 30 genome-wide SNPs(P<1.79E–07) were identified for D100.Furthermore,a total of 22 and 2 suggestive SNPs (P<3.57E–06) were detected for D100 and BW,respectively.Of these,one locus located on SSC12 (position:46 226 512 bp) were evaluated to affect both BW and D100 in Yorkshire pigs,indicating the pleiotropism in different traits.Considering the function of candidate genes,two genes,NSRP1 and DOCK7,were suggested as the most promising candidate genes involved in growth traits.Thus,use of GBS is able to identify novel variants and potential candidate genes for BW and D100,and provide an opportunity for improving pig growth traits using genomic selection in pigs.
Keywords:genotyping-by-sequencing,GWAS,birth weight,days to 100 kg,Yorkshire pigs
1.lntroduction
Growth rate is an important indicator of the profitability of commercial swine production.Days to 100 kg (D100)provides a direct quantification of the growth rate of domestic pigs (Sus scrofa) and is one of the most important traits for maximizing productivity and breeding potential,as reducing D100 can greatly reduce costs.Birth weight (BW) indirectly influences growth rate because higher BW leads to faster growth at later stages and reduces the time needed for individuals to reach market-ready condition (Beaulieuet al.2010).There is an established negative correlation between BW and litter size (Roehe 1999;Beaulieuet al.2010),suggesting that BW might also reflect sow reproductive ability.BW has also been linked to the mortality rate of piglets (De Passilleet al.1993);indeed,low BW has been shown to increase the incidence of inferior quality pigs (Fixet al.2010).Generally,BW is an important indicator of the reproductive capacity of sows.If the BW of piglets can be maintained within a suitable range,the growth rate of piglets and the litter size of sows can be optimized,thereby improving the overall efficiency of sow production.
Numerous quantitative trait loci (QTLs) have been reported from domestic pigs over the past decades.To date,a total of 29 045 QTLs have been reported from database(https://www.animalgenome.org/cgi-bin/QTLdb/SS/index/).Among these QTLs,155 and 130 QTLs have been shown to be associated with D100 and BW,respectively.Following the development of sequencing and chip technology,genome-wide association studies (GWAS) have been successfully implemented in livestock.For swine,GWAS have been shown to be a powerful method for detecting genetic variants associated with complex traits,such as growth (Kimet al.2000;Bidanelet al.2001;Fernandezet al.2012;Guoet al.2015),meat quality (Kimet al.2005;Van Wijket al.2007) and reproductive traits (Sell-Kubiaket al.2015).
To date,numerous studies have identified several SNPs and potential candidate genes for D100 and BW in pigs.Separate QTLs associated with BW have been documented at different positions on SSC3 (Bidanelet al.2001;Maleket al.2001;Quintanillaet al.2002).For example,Wanget al.(2015) detected 85 SNPs associate with D100 and six candidate genes.Among these genes,DOCK7has been reported to be associated with D100(Wanget al.2015),body weight and backfat between the 3rd and 4th to last ribs (Yanget al.2018).Much research has been based on chip data (Doet al.2014;Jianget al.2018);however,there are limits to population size and SNP density.Therefore,genotyping-by-sequencing (GBS) data containing a large number of SNPs have become powerful for performing GWAS (Johnsonet al.2015;Sakiroglu and Brummer 2017).GBS uses restriction enzymes to facilitate complexity reduction followed by multiplex sequencing to produce high-quality polymorphism data at a relatively low per-sample cost.Although it was originally designed for SNP genotyping in plant species with sequenced genomes,GBS has also been applied to study pigs (Tanet al.2017;Wang Let al.2017).Here,we used GBS to conduct a GWAS on D100 and BW of pigs to increase the detection of SNPs associated with these phenotypes.
Although previous studies using chip array have identified some QTLs and genes for BW and D100,the genetic architectures of two traits are still poorly understood.And,the BW and D100 are highly correlated and may be controlled by some common genes.However,few studies identify common loci and genes associated with both BW and D100.We hypothesized that some common loci and reported QTLs associated with both BW and D100 would be detected in a Yorkshire population using the GBS data.Thus,the objective of this study was to identify the common genetic variants and candidate genes that contribute to the phenotypic variability of BW and D100 using GWAS based on the GBS data of 600 purebred Yorkshire pigs.
2.Materials and methods
2.1.Animals and collection of phenotypic data
A total of 600 purebred Yorkshire pigs including 300 males and 300 females were used in this study.Among them,49,146,99 and 306 pigs were born in 2012,2013,2014 and 2015,respectively.All pigs had the common genetic background.During the period of 2012–2016,the phenotype records were collected from Sichuan Tianzow Breeding Technology Co.,Ltd.,a national core pig breeding farm in China.All pigs were selected to uniform feeding conditions for measurement of growth traits from 30 to 110 kg of body weight using the Osborne FIRE Pig Performance Testing System (Osborne,KS,USA).During the period of performance test,all pigs were grouped in cement-floor pens(20 pigs in each pen),located in a temperature-controlled room ((25±2)°C) and relative humidity between 65 and 80%.The automatic feeder and low-pressure nipple drinker were provide in each pen,and the nutrient requirements for pigs were met as recommended by the National Research Council (NRC 2012).
BW was directly recorded at birth for each pig.D100 was measured using the following method (referring to Canadian Centre for Swine Improvement):
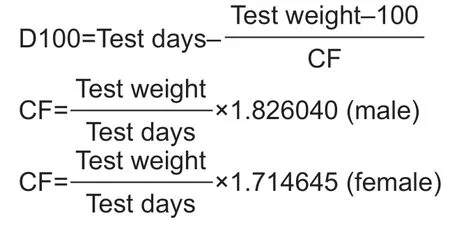
where Test days are the duration of the performance test in days;Test weight is the weight at end of performance test;CF is the correction coefficient in the pig breeding program.
2.2.Genotyping and quality control
The genomic DNA was extracted from ear tissue samples using the OMEGA Tissue DNA Kit (Omega Bio-Tek,USA)according to the manufacturer’s instructions.The genomic DNA samples with the ratio of light absorption (OD260/OD280)between 1.8 and 2.0,concentration more than 50 ng µL–1and total volume less than 50 µL were used for sequencing.Genotyping was conducted by GBS.A total of 487.34 Gb clean data was obtained (Appendix A).Then the clean data was aligned to the pig reference genome using Burrows-Wheeler Aligner (BWA,version 0.7.15) Software (Li and Durbin 2009) with the parameters mem -t 4 -k 32 M.GATK Software (De Pristoet al.2011) was used to detect SNPs.A total of 10 445 924 SNPs were called by GATK Software.SNPs with a minor allele frequency (MAF) lower than 0.01,a rate of missing genotypes higher than 0.2,aP-value for Hardy-Weinberg equilibrium (HWE) testing less than 1×10⁻⁶,a mean depth less than 3,and the sites with no position information and located on sex chromosomes were excluded from our dataset.After these filtering steps,the missing genotypes were imputed by Beagle 5.1 Software (Browninget al.2018).Finally,a total of 279 787 SNPs were remained for association study.
2.3.Genome-wide association studies
GWAS were implemented independently for BW and D100 in Yorkshire pigs.Using GEMMA Software (Zhou and Stephens 2012),a univariate linear mixed model was used to detect associations between studied traits and SNPs.
For BW were analyzed using the following model:

where y is the vector of the trait values;α is the vector of fixed effects,including sex,birth parity,birth year and birth month;β is the SNP effects;μ is the vector of residual polygenic effects following the distribution (μ~(0,δ2µ));p is a random material effects vector:(p~(0,δp2));X,Z,W and M are incidence matrices for α,β,μ and p,respectively;T is the vector of total number born (as a covariate);γis the regression coefficient;e is the vector of random residual effects with (e~(0,δθ2)).
For D100,the model was as follows:

The definitions of model see eq.(1).The Bonferroni correction method was used to determine the significant level in our study.The genome-wide and suggestive significant threshold values were set as 1.79E–07 (0.05/279 787) and 3.57E–06 (1.00/279 787),respectively.The Manhattan and QQ plots were drawn by R package “qqman” (Turner 2014).The genomic inflation factor (λ=The observedP-values/The expectedP-values) was calculated to evaluate the extent of false positive signals using the GenABEL package in R(Aulchenkoet al.2007).
2.4.Haplotype block analysis
In our study,the ±20 kb region around each top SNP (with the highestP-value) was chosen as a QTL.For significant QTLs with the number of significant SNPs more than 3,we performed linkage disequilibrium analyses using Haploview version 4.1 (Barrettet al.2005),and the solid spin algorithm following the criteria of Gabrielet al.(2002).
2.5.Candidate genes search
A 40-kb region centering on each identified SNP was used to search candidate genes in Ensemble Sscrofa11.1 (https://asia.ensembl.org/Sus_scrofa/Info/Index).The biological functions of candidate genes were investigated on PubMed(https://www.ncbi.nlm.nih.gov/pubmed) and the reported literatures.
3.Results
3.1.Phenotype data statistics
We considered two growth traits including BW and D100 in a Yorkshire population.Summary statistical for these traits were listed in Table 1.For BW,we found substantial phenotype variation with 18.90% coefficient of variation(CV).And there existed a small phenotype variation with 7.05% CV for D100.
3.2.SNPs detected by GWAS
Based on GBS data,a single marker test using univariate linear mixed model was conducted to detect SNPs associated with BW.At a more lenient threshold (P<3.57E–06) for suggestive associations,we identified two SNPs for BW in Yorkshire pigs (Fig.1-A;Table 2).In 46.21–46.25 Mb on chromosome 12,the identified SNP (position:46 226 512 bp,P=2.97E–06) was located inNSRP1gene.
For D100,a total of 52 SNPs hadP-value less than 3.57E–06,of which 30 SNPs hadP-value less than 1.79E–07(Fig.1-B;Table 2).A total of two peaks were found for D100 (Fig.1-B).The first significant region was at position 149.86–149.90 Mb on SSC6,where nine consecutive SNPs were detected.Its most significant SNP (position:149 876 706 bp) had aP-value of 7.47×10⁻¹⁹.The second significant region was at position 44.26–44.30 Mb on SSC13,and its most significant SNP (position:44 279 022 bp) had aP-value of 5.02×10⁻¹⁸.And eight consecutive SNPs were detected in this region.QQ plots and the calculated genomic inflation factors (λ) of BW and D100 showed no evidence of population stratification in our study (Pearson and Thomas 2008) (Fig.1).
3.3.Common loci affecting BW and D100
Growth traits are correlated with each other in pigs.Our GWAS results showed that one overlapped chromosome region (SSC12:46.21–46.25 Mb) was identified for BW and D100 (Fig.1;Table 2).In this region,one SNP (position:46 226 512 bp,P<3.57×10⁻⁶) located on SSC12 in common were shared by both BW and D100 in Yorkshire pigs,and a potential candidate geneNSRP1was found here,indicating the pleiotropism in different traits.

Table 1 Summary statistics of the analyzed phenotypes in Yorkshire pigs1)
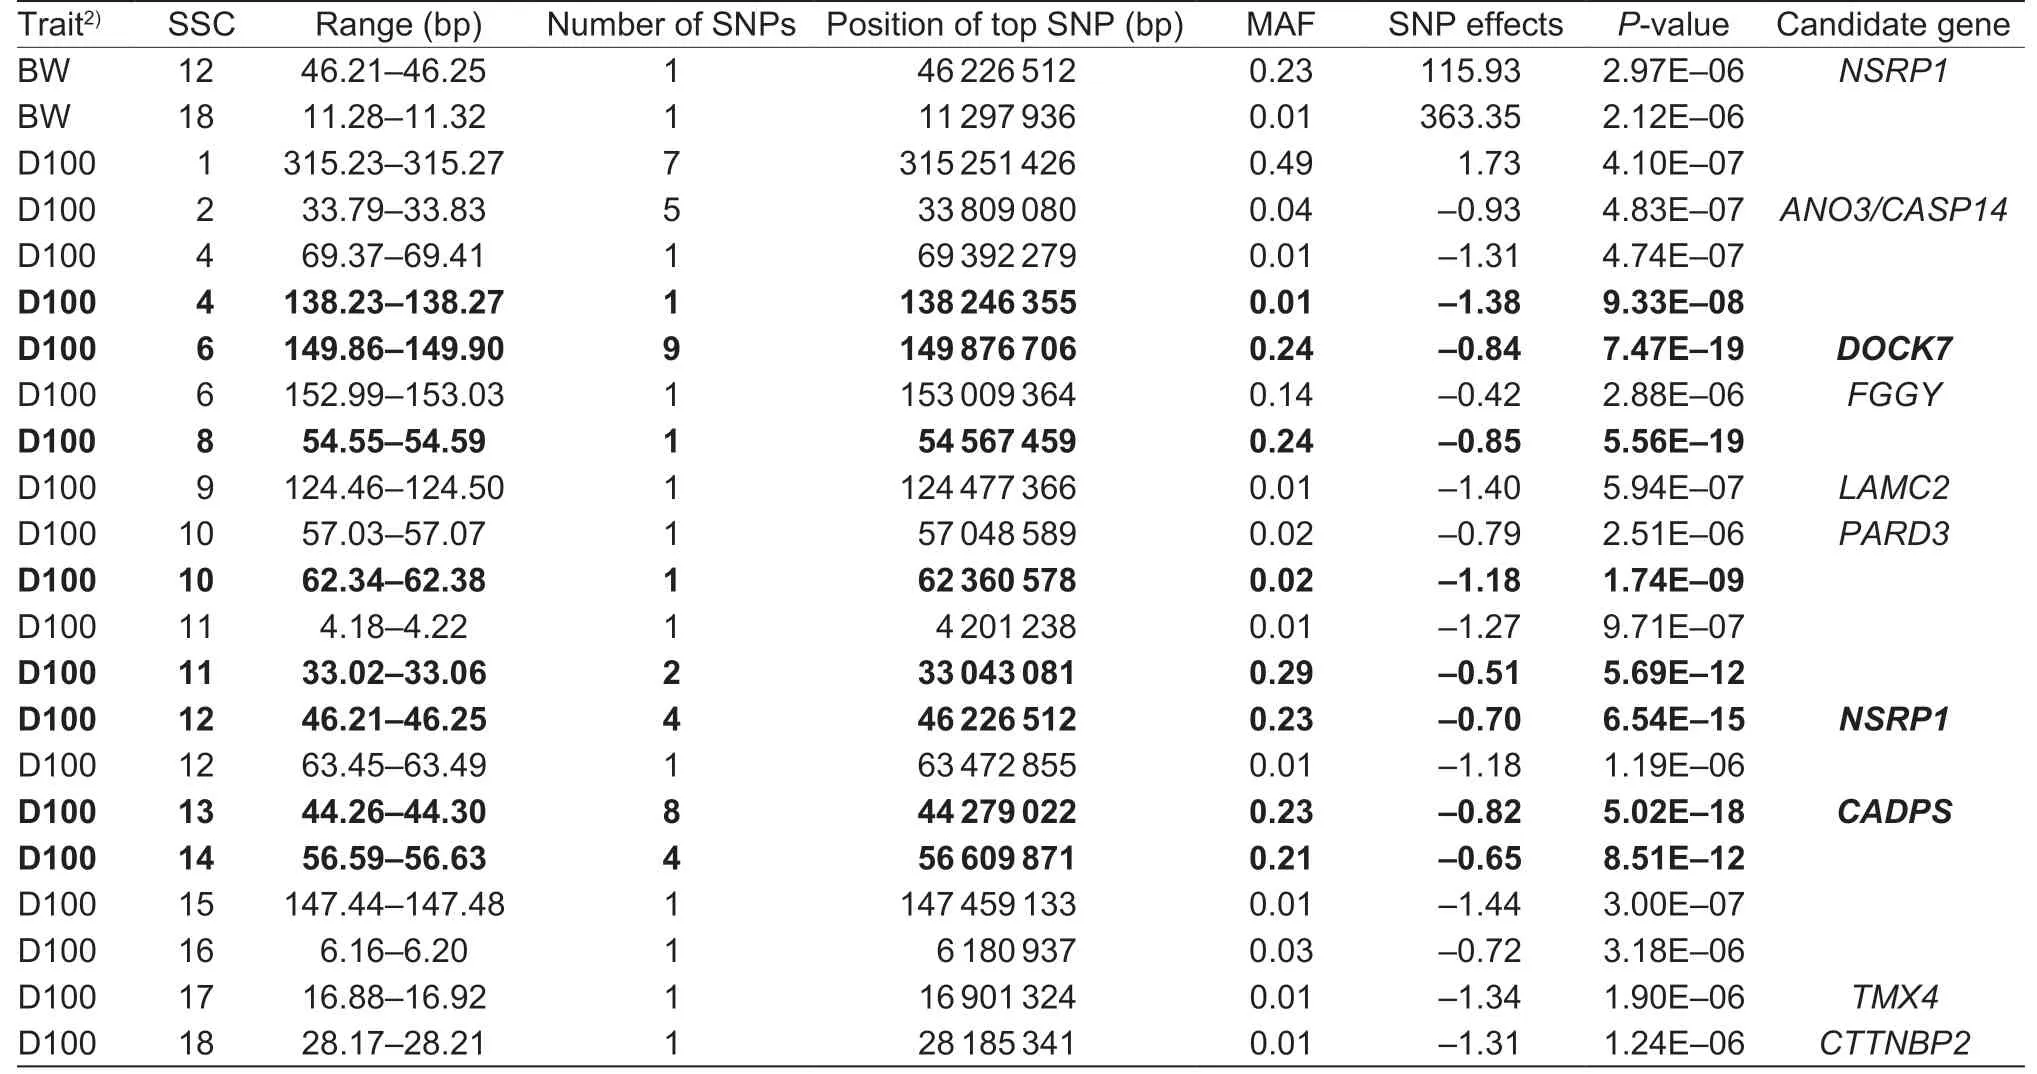
Table 2 All identified SNPs for birth weight (BW) and days to 100 kg (D100) traits in Yorkshire pigs1)
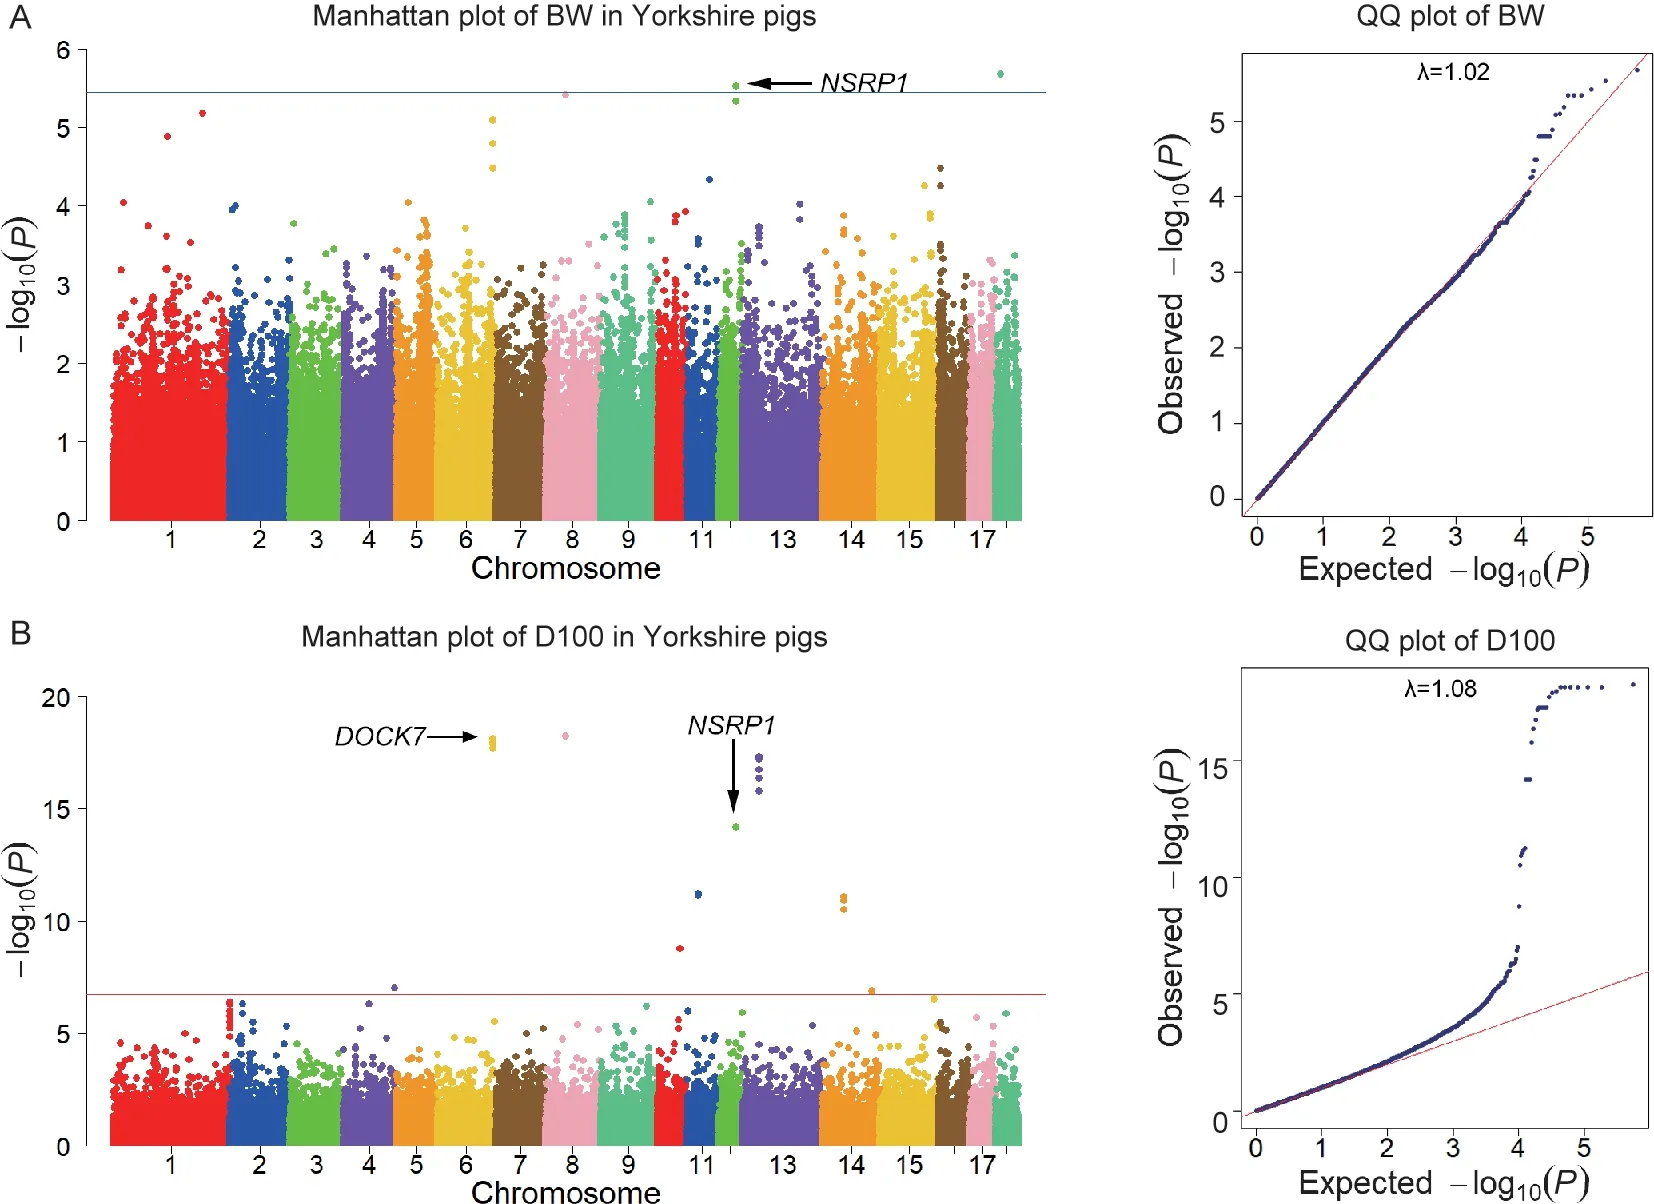
Fig.1 Genome-wide association study (GWAS) results for birth weight (BW) and days to 100 kg (D100) traits in Yorkshire pigs.A,Manhattan plot for BW trait.B Manhattan plot for D100 trait.Each dot on this figure corresponds to a SNP within the dataset,while the horizontal red and blue lines denote the genome-wide significance (1.79×10⁻⁷) and suggestive significance threshold(3.57×10⁻⁶),respectively.
3.4.Haplotype block analysis
A total of three haplotype blocks were detected for D100(Fig.2).We found nine significant SNPs located on SSC6,and detected a 259-bp haplotype block (from 149 876 507 to 149 876 766 bp).TheDOCK7gene is located in this region.The second haplotype block was detected in 46 226 484–46 226 580 bp on SSC12,and these four significant SNPs were located inNSRP1gene.On chromosome 13,eight significant SNPs were situated in a 234-bp block (from 44 278 872 to 44 279 106 bp),and these SNPs were located inCADPSgene.
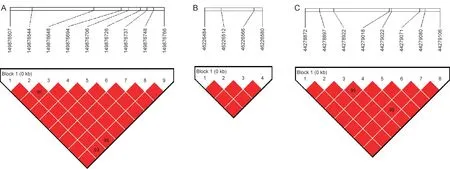
Fig.2 Haplotype plots for significant single nucleotide polymorphisms (SNPs) for days to 100 kg (D100).A,a haplotype block composed of significant SNPs on SSC6:149.86–149.90 Mb.B,a haplotype block composed of significant SNPs on SSC12:44.21–44.25 Mb.C,a haplotype block composed of significant SNPs on SSC13:44.26–44.30 Mb.
4.Discussion
The quantitative traits are controlled by polygenes.To identify important loci associated with BW and D100,we used GBS data to identify SNPs associated with these traits in a Yorkshire pig population.This study indicated that the GBS data containing large number of SNPs are efficient for identification genetic variants of quantitative traits in pigs.Use of the GBS data is able to identify novel genetic variants for BW and D100 traits.In this study,a number of significant SNPs and candidate genes were detected for BW and D100 traits.In particular,one common genetic variant and candidate gene were identified for these studied traits.Although theP-value of SNPs differ for both traits,SNP associated with D100 also have a significant effect for BW.Here,these results validate that BW and D100 are controlled by common genetic variants and genes in pigs.In summary,the above results from the present study have supported our hypothesis that some common loci and reported QTLs associated with both BW and D100 would be detected in a Yorkshire population using the GBS data.These results will also be given more attentions in genomic selection programs of BW and D100.
The porcine complex traits are related with each other.Identification of common loci and genes are expected to play a crucial role in genomic selection programs of these traits.The previous studies have shown that some common loci and genes shared by porcine complex traits were identified using SNP chip genotype data (Wang Yet al.2017;Zhanget al.2021).However,based on GBS data,none of common SNPs were identified for BW and D100 in previous study.In our study,one common SNP associated with BW and D100 was reported for the first time.Furthermore,we also identified some significant loci associated with these traits.In order to evaluate whether loci related to BW and D100 trait in our study replicate any reported QTLs,this study searched the PigQTLdb (https://www.animalgenome.org/cgi-bin/QTLdb/SS/index/) based on the location of SNPs and QTLs.As mentioned above,one SNP located on SSC12 shared by D100 and BW.At position 46.21–46.25 Mb on SSC12,six QTLs have been reported to be related to growth traits in pigs.Among these,two QTLs have been shown to be associated with BW (Liuet al.2007,2008),three with body weight at different periods (Yooet al.2014),and one with average daily weight gain (De Koninget al.2001).Wanget al.(2015) reported that a QTL located in 149.9–149.9 Mb on chromosome 6 was associated with D100 in a Duroc population.Our GWAS identified that nine significant SNPs associated with D100 located on this reported QTL.Piglets with high BW could reach 100 kg faster because there is a positive correlation between BW and D100 (Beaulieuet al.2010).We detected one SNP in common between BW and D100,but theirP-values were different.Thus,this SNP may make important contributions to growth trait in pigs.From 44.26 to 44.30 Mb,a clear GWAS peak was observed on chromosome 13 for D100 in our study.A total of five reported QTLs were found in this region for weight (Yanget al.2018)and average daily weight gain (Knottet al.1998;De Koninget al.2001).From 6.16 to 6.20 Mb on chromosome 16,three reported QTLs were detected for BW (Guoet al.2008),feed conversion ratio (Liuet al.2007) and daily feed intake (Liuet al.2008).These overlaps may be considered with QTLs for growth traits as evidence for replication.
BW and D100 are important economic traits that directly affects the economy efficacy in pig production.In our study,a total of 10 candidate genes includingNSRP1,DOCK7,ANO3,CASP14,FGGY,LAMC2,PARD3,CADPS,TMX4andCTTNBP2that were within or near (within 40 kb) the identified SNPs were detected based on Sus scrofa 11.1 genome assembly.Among these genes found by GWAS,two important genes,NSRP1andDOCK7,may have biochemical and physiological roles that were related to growth traits.NSRP1,which is known to be the storage site of components of the pre-mRNA splicing machinery,was found at position 46.21–46.25 Mb on SSC12.Kimet al.(2011) have shown thatNSRP1gene was an essential gene for early embryonic development,and knockout ofNSRP1resulted in embryonic lethality.DOCK7gene is a proteincoding gene,which is a guanine nucleotide exchange factor(GEF) and plays a key role in axon formation and neuronal polarization.The lipids,amino acids and glucose is the basic of growing development (Brettet al.2014).Hence,the genes related to energy metabolism may influence piglet birth weight and growth.The previous literatures have shown thatDOCK7gene was associated with lipid metabolism (such as serum lipids and cholesterol) in human(Aulchenkoet al.2009;Jeemonet al.2011;Guoet al.2016).And cholesterol plays an crucial roles in fetal growth(Woollett 2011).Furthermore,numerous previous studies showed thatDOCK7was associated with growth traits in pigs.Edeaet al.(2017) reported thatDOCK7was under directional selection and associated with growth traits.Wanget al.(2015) showed thatDOCK7was related to D100 in a male population of Duroc pigs.These two candidate genes may play critical roles in fetal growth,and affect postnatal growth.Thus,based on the functional studies ofNSRP1andDOCK7,we suggested thatNSRP1andDOCK7may be promising candidate genes affecting growth traits in pigs.
5.Conclusion
Results in present study showed that,GWAS using GBS data was efficient to identify novel loci associated with BW and D100 and provide new information on genetic determinism of growth traits in pigs.One common locus shared by BW and D100 may be used as important marker information in genomic selection,which will be helpful in improving pig breeding programs.Furthermore,considering the known functions ofNSRP1andDOCK7,these two genes are suggested as potential candidate genes for BW and D100 in pigs.However,functional studies remain to be conducted to determine mechanisms of how the loci and genes affect BW and D100 in pigs.
Acknowledgements
This study was supported by grants from the Sichuan Science and Technology Program,China (2020YFN0024),the Sichuan Innovation Team of Pig,Farm Animal Genetic Resources Exploration and Innovation Key Laboratory of Sichuan Province (sccxtd-2020-08),the National Key R&D Program of China (2018YFD0501204),the National Natural Science Foundation of China (31530073 and C170102),and the the China Agricultural Research System of MOF and MARA (CARS-35-01A).
Declaration of competing interest
The authors declare that they have no conflict of interest.
Ethical approval
All experimental procedures were performed in accordance with the Institutional Review Board (IRB14044) and the Institutional Animal Care and Use Committee of the Sichuan Agricultural University,China,under permit number DKY-B20140302.
Appendixassociated with this paper is available on http://www.ChinaAgriSci.com/V2/En/appendix.htm
杂志排行
Journal of Integrative Agriculture的其它文章
- Molecular characteristics and structure–activity relationships of food-derived bioactive peptides
- lntegrating the physical and genetic map of bread wheat facilitates the detection of chromosomal rearrangements
- Physiological response of flag leaf and yield formation of winter wheat under different spring restrictive irrigation regimes in the Haihe Plain,China
- Variation of carbon partitioning in newly expanded maize leaves and plant adaptive growth under extended darkness
- Effects of plant density and mepiquat chloride application on cotton boll setting in wheat–cotton double cropping system
- Interactive effect of shade and PEG-induced osmotic stress on physiological responses of soybean seedlings
