Optical design of the Lyman alpha based beam emission spectroscopy(LAB)diagnostic on the HL-2A tokamak
2021-07-07YixuanZHOU周艺轩HuajieWANG王华杰YiYU余羿YihangCHEN陈逸航RuiKE柯锐MinXU许敏ChijieXIAO肖池阶ZhanhuiWANG王占辉JiquanLI李继全XuruDUAN段旭如andMinyouYE叶民友
Yixuan ZHOU(周艺轩),Huajie WANG(王华杰),Yi YU(余羿),,Yihang CHEN(陈逸航),Rui KE(柯锐),Min XU(许敏),Chijie XIAO(肖池阶),Zhanhui WANG(王占辉),Jiquan LI(李继全),Xuru DUAN(段旭如) and Minyou YE(叶民友)
1 Southwestern Institute of Physics,Chengdu 610041,People’s Republic of China
2 School of Nuclear Science and Technology,University of Science and Technology of China,Hefei 230026,People’s Republic of China
3 State Key Laboratory of Nuclear Physics and Technology,School of Physics,Peking University,Beijing 100871,People’s Republic of China
Abstract In this article,we present the optical design of a novel diagnostic on the HL-2A tokamak,i.e.the 20-channel edge Lyman-alpha beam emission spectroscopy,which is a promising solution for edge density turbulence research on tokamaks,as it offers the possibility of density fluctuation measurement with a 3.3 mm spatial resolution while maintains a high temporal resolution of 1 μs.The optical path,including the reflective collection optics,the high-dispersion spectrometer,and the linear detector array,is carefully optimized to obtain a good image quality and a high throughput.The maximum root mean square radius of the collection optics is 64 μm.The detected photon flux is estimated to be about 1011 photons/s/channel.
Keywords:Lyman-alpha line,LAB,BES,density fluctuation diagnostic
1.Introduction
Neutral beam injection(NBI)is one of the main heating measures in modern tokamaks,and many important physical phenomena can be observed in NBI heated plasmas,such as plasma rotation[1]and L-H transition[2].NBI also provides abundant lines for kinds of passive diagnostics,such as beam emission spectroscopy(BES)[3],charge exchange recombination spectroscopy(CXRS)[4],fast ion Dα(FIDA)[5],motional stark effect(MSE)[6],and so on.Among these diagnostics,BES now works as a powerful tool to measure density fluctuation in tokamaks because of its high spatial and temporal resolutions at the orders of centimeters and microseconds,respectively.One of the main characteristics of plasma turbulence in tokamaks is multi-scale,which implies that BES is not suitable to investigate some small-scale physics,i.e.turbulence at the scale of millimeters.Many factors contribute to the spatial resolution of BES channels,such as optics,local pitch angle,local plasma parameters,and natural line width of emitting atoms[7].BES developers would try their best to enhance the spatial resolution of the BES system.For example,by means of adjusting a suitable viewing sightline to meet the local pitch angle and designing an expansive fiber bundle to eliminate the usage of optical lenses,the BES on HL-2A tokamak can promise an excellent radial spatial resolution of 8 mm[8,9],which is probably the best one in the world according to the reported papers worldwide.It is very difficult to further enhance the spatial resolution because of the intrinsic spatial resolution limit of BES.This traditional BES is to measure the Doppler-shifted Balmer-alpha line(n=3→2,656.10 nm)which is emitted during the de-excitation of excited deuterium atoms.These atoms move along the NBI trace over the de-excitation,which causes the projection in the radial direction.The radial spatial resolutionΔris determined by the length of the projection which is proportional to the lifetime τ of the excited atoms following:wherevstands for the speed of neutral beam atoms andγstands for the angle between the radial direction and the NBI trace.So,the radial spatial resolution can be effectively enhanced by means of choosing another de-excitation line which has a much shorter lifetime than that of the Balmer-alpha line.From this point of view,the Lyman-alpha line(n=2→1)with about one-tenth of the lifetime of the Balmer-alpha line is the best choice,which was conceived by G R McKee firstly twenty years ago[10].Unfortunately,the wavelength of the Lyman-alpha line is 121.53 nm,which makes it a vacuum ultraviolet(VUV)line.It is very difficult to transmit and detect this line,which makes the development of the spectroscopy diagnostic based on this VUV line a great challenge.
Recently,for the first time,a novel 20-channel Lyman alpha based(LAB)BES diagnostic for edge density fluctuation measurement is under development on the HL-2A tokamak,making G R McKee’ idea a reality.The key of this diagnostic is to develop excellent optics,which can transmit the VUV line out of the vacuum chamber and promise sufficient light intensity for detectors.In this article,we present the detailed optical design of LAB on HL-2A,together with near-future plans.The rest of this article is arranged as follows.In section 2,the HL-2A tokamak and the vacuum port for LAB are introduced.Section 3 is devoted to the detailed design of optics.In section 4,a brief summary is given.
2.Design requirements of LAB on HL-2A
HL-2A is a conventional tokamak with a major radius and a minor radius ofR0=1.65 m anda=0.4 m,respectively.The mission of HL-2A is to explore the key physical topics relevant to the advanced operation of tokamaks,such as the access of L-H mode transition and ELM(edge localized mode)suppression.These physical topics require diagnostics which can measure main plasma parameters with high spatial and temporal resolutions.There are two NBI lines on HL-2A,with a total injection power of higher than 1.2 MW.One of the NBI lines,which has a typical injection energy of 45 keV and a typical current of 23 A,provides a good diagnosing beam for BES and LAB.
LAB on HL-2A should meet following requirements:
(1)The LAB should have a better spatial resolution than that of BES,without a great decrease of temporal resolution.
(2)A suitable port should be chosen,taking spatial limitation around the HL-2A vacuum vessel and the NBI port into account.
(3)The optical path should have a sufficient transmitting efficiency,ensuring strong enough light intensity for detectors.
(4)Because of the angle between the viewing sight and NBI trace,there is a Doppler-shift in the wavelength of the Lyman-alpha line.Measures should be taken to distinguish the shifted target line from the background Lyman-alpha line.
(5)The LAB is to investigate small-scale localized edge plasma physics,such as the shaping of the pedestal,turbulence during ELM burst,etc.Compared with 2 BES diagnostic channels in the ~2 cm pedestal region on HL-2A,the LAB is expected to provide a superior diagnosing capacity of 6–7 spatial channels.Therefore,detailed in-depth research on edge localized modes and L-H transition could be carried out.Based on the physical goal,the optics of LAB should be designed with a viewing field of edge plasma i.e.fromR=1.98 m to 2.05 m(ρ=r/a=0.83–1.0 for typical HL-2A shots).
3.Optical design of LAB
3.1.Location of LAB
The neutral beam is injected into plasma through the ‘NW’port on HL-2A with a 150 mm diameter circular cross section.The angle between NBI trace and the normal direction of the port flange is 36°.After comparison,the ‘NNW’ port,which is located next to the NBI port,is chosen for LAB.The diameter of the ‘NNW’ flange is 600 mm.LAB window is located at the down part of this flange and shares this flange with one MSE,one CXRS,and two FIDAs,as shown in figure 1.This arrangement makes LAB a tilted viewing sightline with an upward angle of 7° between the sightlineand the horizontal plane to tangentially match the magnetic field pitch angle.So,the sightline is along the direction of the magnetic field line which is beneficial for a higher spatial resolution[7].
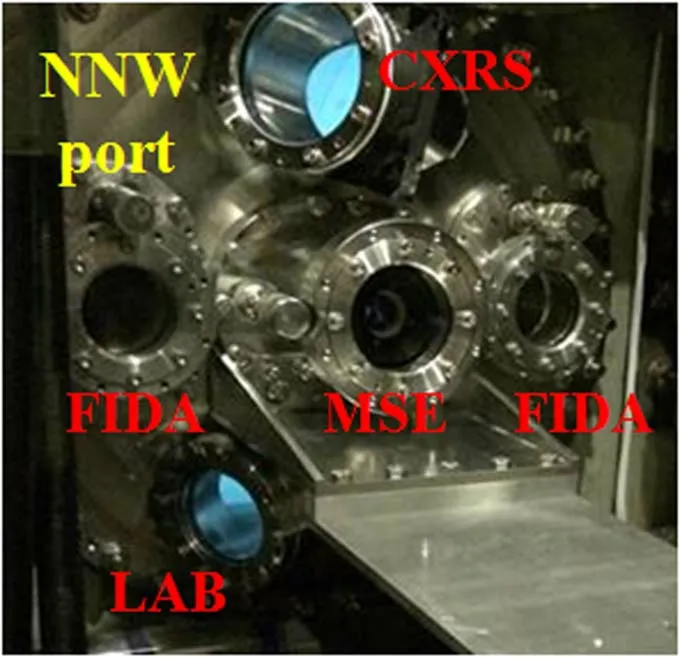
Figure 1.The flange for spectroscopy diagnostics based on NBI on the HL-2A tokamak.The window for LAB is located at the bottom left.
3.2.Transmission optics
The main difficulty of developing spectrum diagnostics on tokamaks is how to lead the light out of the vacuum vessel without significant intensity loss and image aberration.There are mainly two kinds of transmission optics for BES diagnostics.One is the lens group[11,12],and the other is the combination usage of a few light-collection lenses and fibers[3,13].Unfortunately,this rich experience is not suitable for LAB development.The reason comes from the fact that no material is transparent enough to the VUV line.It is also to be noted that the space for LAB optics is limited not only by the size and angle of the viewing window but also by the tight quarters between the last closed field surface and the window,and the narrow space between the nearbyBtcoils outside of the vacuum vessel(figure 2).
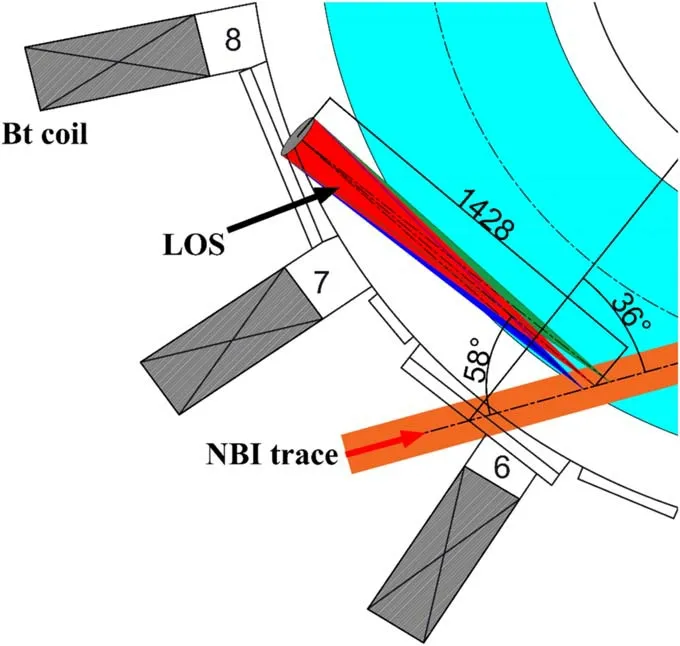
Figure 2.Layout of the edge LAB system on HL-2A.
Two-toroidal-mirror structure(U-shaped and Z-shaped arrangements)which has been theoretically proposed to be used in the benchmark design of the VUV-BES system in the pioneer[10],was considered and tried for the LAB on HL-2A.However,this design scheme does not work so well,either with large image aberrations or with unacceptable space to lay,no matter how it is optimized.In order to be compact and correct aberrations,the collection optics with a tworeflective-telescope system and a plane mirror,was designed and optimized for the LAB system.The simulated optical path of the collection optics is shown in figure 4,and marked by the green rectangle.It is partially zoomed in to show more details.
In the design of the two-reflective-telescope configuration,the structural parameters were preliminarily determined according to the third-order aberration theory[14,15]and the practical requirements of the LAB system.Then the tworeflective-telescope system was simulated and optimized by the ray-tracing software of Zemax Optic Studio,so as to eliminate the spherical aberration,coma aberration,field obliquity,and astigmatism to an acceptable level.The tworeflective-telescope system is composed of a 180 mm diameter ellipsoidal mirror as the primary mirror,and a 90 mm diameter hyperboloid mirror as the secondary mirror.The primary mirror was optimized to have a maximum size under a comprehensive consideration,in order to be installed in the vacuum chamber and have a high optical throughput.The optimized primary mirror is located about 1428 mm away from the NBI,with an angle of acceptance of 6.8°.The angle between the axis of the collection optics and the injection direction of the NBI trace is about 58°.The ellipsoidal mirror and the hyperboloid mirror are designed to be coaxial,with the purpose of obtaining a better image quality.Limited by the available diagnostic space,an 84 mm diameter circular plane mirror is arranged behind the two-reflective-telescope system with the function of deflecting the optical axis merely,without introducing any additional aberrations.In order to realize the matching between the spatial channel and the detector element which will be presented later,the magnification of the collection optics is set to be 1/4.
The radial spatial resolutionΔrof one LAB channel can be derived fromwherev=stands for the speed of neutral beam atoms,cstands for light speed,mDstands for the mass of the deuterium atom,Estands for the NBI energy,τ stands for the lifetime of the excited atoms[16]which emit the Lyman-alpha line,andγstands for the angle between the radial direction and the NBI trace on HL-2A.So for theγangle of 43.12°in this edge LAB system,the spatial resolution is 3.3 mm which is inspiring comparing with that of BES.It is to be noted that the spatial resolution of BES can be improved in high-density plasmas,due to the shortened lifetime of the excited atoms[17].According to the calculations done by Hutchinson[17],the LAB is superior than the BES in spatial resolution when the electron density is lower than 1020m-3.The designed channel number of this edge LAB diagnostic is 20.
Although the lines of sight are designed to be as parallel as possible to the magnetic field line,the magnetic field pitch angle can change under different discharge configurations and parameters.For most of the discharges on HL-2A,the edge magnetic field pitch angle ranges from 3°to 7°,which means that the angle between the line of sight and the local magnetic field line can be as large as 4°.The mismatch between the line of sight and the local magnetic field line may cause the wavenumber cutoff due to the parallel integration effect[18],which is analyzed in the optical design of LAB.The wavenumber components parallel and perpendicular to the line of sight can be expressed asandrespectively,wherek⊥andk//are the parallel and perpendicular wavenumbers to the magnetic field direction,α stands for the angle between the line of sight and the magnetic field line.Directionzstands for the direction along the line of sight and directionxrefers to the direction of the wave propagation perpendicular to the line of sight.On HL-2A,the edge parallel wavenumber is estimated to be ~5×10⁻³of the perpendicular wavenumber.The fluctuation amplitude of light emission intensity from the sampling volume is proportional to the product of the parallel integral and the perpendicular integral[18]:

wherex=rcosθ,∣n˜e∣is the electron density fluctuation,ω is the wave frequency,nbis the neutral beam density,rand θ refer to the polar coordinates on the cross section perpendicular to the line of sight.The parallel integral,perpendicular integral and their product are evaluated for the edge LAB diagnostic,as shown in figure 3 as a function ofk⊥and α.The result shows that the wavenumber cutoff,which refers to the perpendicular wavenumber decided by the half decay of the fluctuation amplitude,decreases fromk⊥=11.6 cm-1at α=0°tok⊥=9.9 cm-1at α=4°,as indicated by the bold black curve in figure 3(c).The wavenumber cutoff of LAB depends not so highly on α,which is different from the results of the BES on LHD[18].This may result from a smaller α and a shorter integration length of the LAB,along which the neutral beam density differs not so much,compared with that of the BES on LHD.
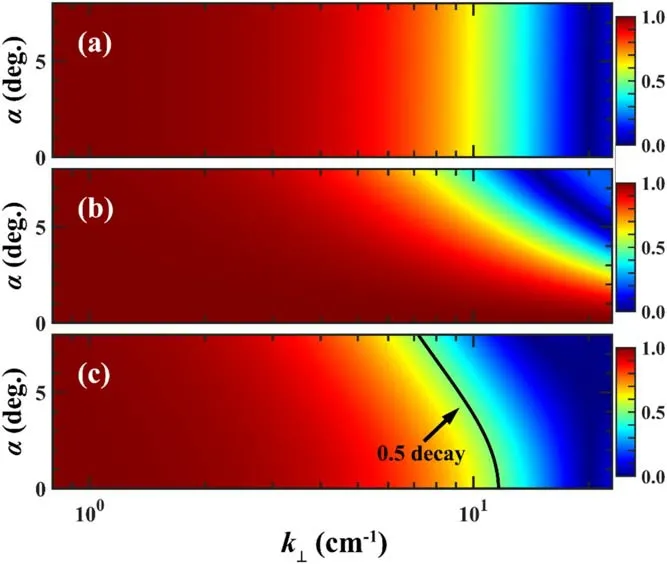
Figure 3.Calculation of(a)the perpendicular integral,(b)the parallel integral,and(c)their product of the edge LAB system.
The paths of the light emitted from 10 edge locations(10 of the 20 channels)in the observation area along the neutral beam are simulated,as shown in figure 4.The light is firstly collected by the ellipsoidal mirror,which has a curvature radius of 360 mm and a surface coefficiente12of 0.96.Subsequently,the light is converged onto the hyperboloid mirror,which has a curvature radius of 407 mm and a surface coefficiente22of 16,and then is transmitted through the 84 mm diameter circular aperture in the center of the ellipsoidal mirror.Finally,the light from a certain position in the NBIplasma interaction zone will be imaged to a corresponding position on the entrance slit,after the reflection of the plane mirror.Here the plane mirror is only used for light ray bending,due to limited LAB system space.TheF-number of the telescope system is 1.8 and the focal length is 322 mm.The area of the imaged observation region is 20.4 mm×0.8 mm,which provides the benchmark size of the entrance slit.The proportion of optical loss due to the shielding of the secondary mirror is about 30%.
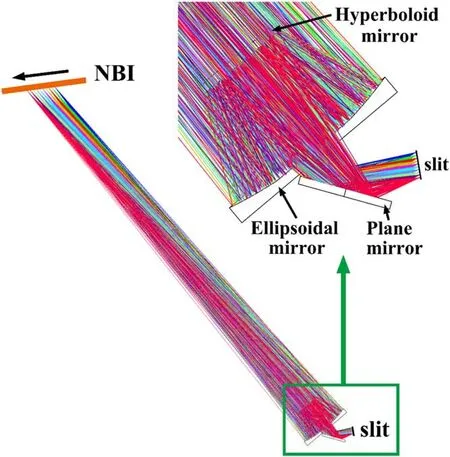
Figure 4.Schematic optics layout of the collection optics and the partial enlarged drawing of the edge LAB system on HL-2A.
The main parameters of the three reflecting mirrors are listed in table 1.The shape and size of these mirrors are shown in figure 5.Because these mirrors are located inside the HL-2A vacuum vessel,measures must be taken to ensure them a long lifetime.The substrate for mirrors is pure copper,ensuring a good heat conduction and avoiding charge accumulation.An aluminum layer is coated onto the mirror surface,providing a good reflecting efficiency for the VUV line.Another MgF2layer is then coated onto the aluminum layer to protect it from oxidization.By these optical and hardware designs,the optics reaches a good reflectivity of about 78%.
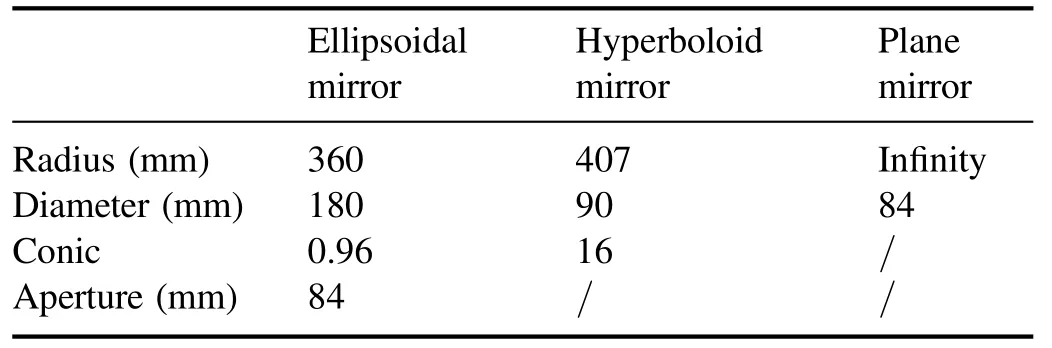
Table 1.The parameters of reflecting mirrors.

Figure 5.Schematic diagram of the reflecting mirrors.
3.3.Performance check of transmission optics
The aim of optimization in optical design is to obtain a better image quality with good corrections for aberrations.By means of using optimization operands and the merit function decided according to the requirements,the adjustable optical parameters could be optimized by the Zemax software under a setting range.The spot diagram,which can show the concentration and dispersion degree of point source on the image plane,is used to evaluate the imaging quality.The performance of LAB collection optics is simulated and ten spot diagrams of different fields of view are indicated in figure 6.The result shows that the maximum root mean square(rms)radius of the spot in each field of view is 64 μm,which meets the requirements of system resolution in the image field of view.The maximum geometric(GEO)radius is less 3 times than the rms value.
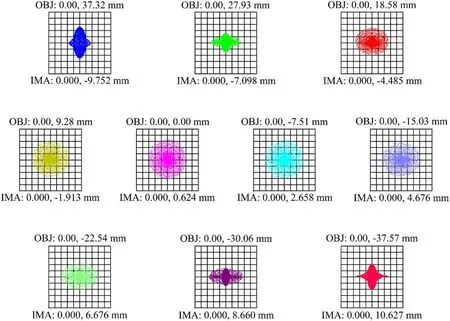
Figure 6.Spot diagrams of the collection optics.
The optical modulation transfer function(MTF),which refers to the ratio of the modulation in the image to that in the object as a function of the frequency(cycles per unit of length)of the sine-wave pattern,contains valuable information about the resolving power of the optics and the contrast in the image.Figure 7 shows the MTF of the optimized collection optics at 122 nm,the MTF values at 200 lp mm-1are greater than 0.7 for all fields of view,which satisfies the imaging requirements.
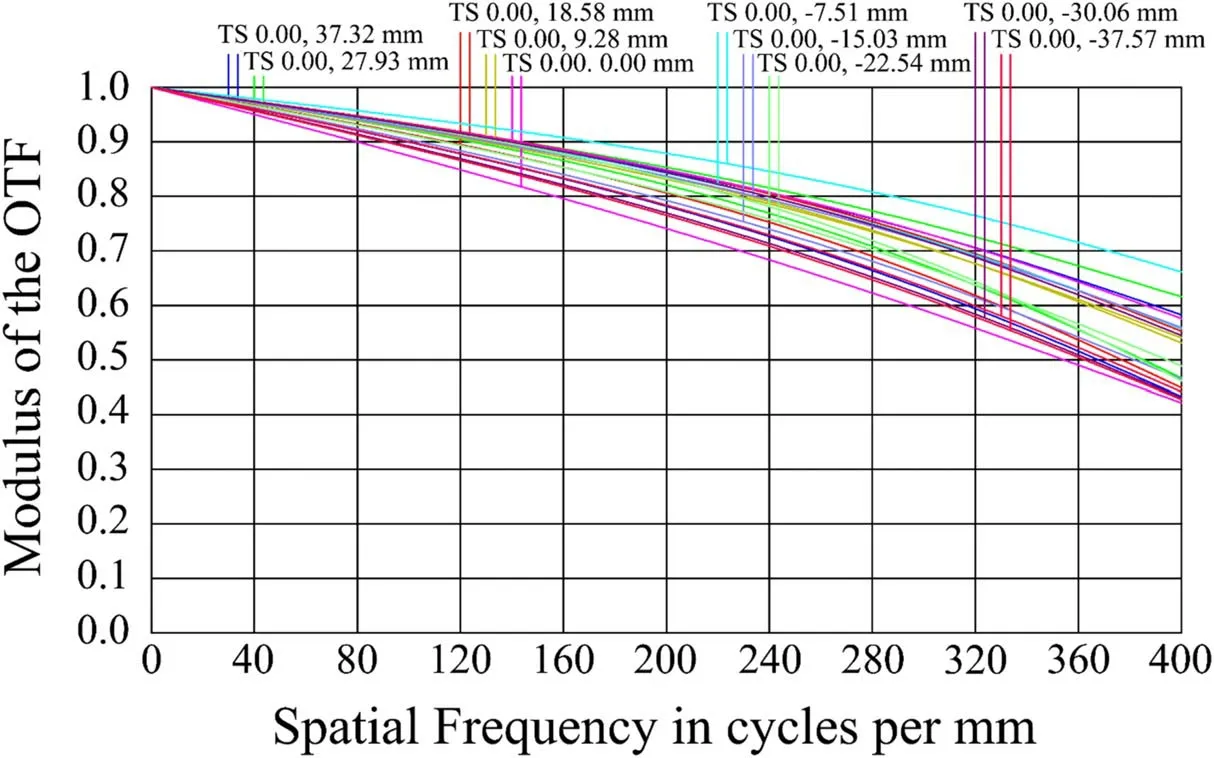
Figure 7.The modulation transfer function(MTF)of the collection optics.
3.4.Spectrometer and detector
Traditional BES uses bandwidth filters to pick the Dopplershifted target line out of the strong un-wanted background lines.As one can see from figure 2,the LAB is located at the Doppler-red-shift side of the neutral beam.The wavelength ofthe Lyman-alpha line is shifted to 121.98 nm,which differs a little according to radial locations.It is obvious that filters are not suitable for LAB.Instead,the high-linear-dispersion aberration-corrected VUV spectrometer with a single toroidal uniform-line-spaced grating is carefully designed.Not only could this single-reflection design give the highest spectrometer efficiency,but also provides the requisite spectral separation and spatial reimaging of the entrance slit.The toroidal surface type is adopted for the grating to realize the simultaneous focus of the spectral and spatial image over the bandpass of interest,by using different radii of curvature in the tangential direction and in the sagittal direction.
Based on the light-path function and Fermat’s principle of least time,several stigmatic spectral image focusing formulas could be obtained,which will not be discussed in this paper.From main first order focusing conditions,the toroidal grating equation could be derived as follows:
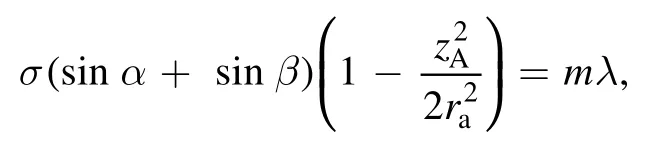
where σ stands for the grating constant,α stands for the incidence angle,β stands for the diffraction angle,zAstands for the coordinate in the slit-height direction of the point on the entrance slit,rastands for the entrance arm length,mstands for the diffraction order and λ stands for the reference wavelength value.Besides,under a small angle approximation,the linear dispersion equation could be estimated as:
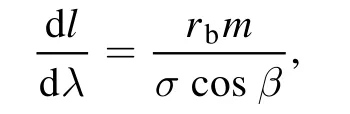
whererbstands for the exit arm length.
The design of the spectrometer must take the parameters of the detector array into account.After comparison,a linear 20-element absolute extremeultraviolet silicon photodiode array[19]which promises a responsivity of 0.16(A W-1)@121.98 nm is chosen as the detector for LAB.
The size of one element of the 20-channel linear detector array of the LAB system is 0.75 mm(spatial dimension)×4.1 mm(spectral dimension)with a 0.2 mm gap between the adjacent two.The necessary linear dispersion for spectral separation on the detector is ~0.14 nm mm-1.The structure parameters of the toroidal grating are optimized,as listed in table 2.The detailed designed parameters of the optimized LAB spectrometer are listed in table 3,and the optical schematic of the spectrometer is shown in figure 8.The input light from the entrance slit is dispersed by the reflective toroidal grating,and the fluorescence in the spectral region of interest will finally be focused on the detector for photovoltaic conversion.Previous work on HL-2A indicates that there is a rather strong OIV(2×60.9829 nm)impurity line because of the existence of residual H2O and O2,which would pollute the Doppler-shifted Lyman-alpha line.Therefore,for current HL-2A plasma,the VUV spectrometer is designed to operate at second-order diffraction.This design also makes the spectrometer more compact.The etendue is defined as ε=π·S·NA2,whereSrefers to the area of one spatial andNAstands for the numerical aperture.For the VUV spectrometer of LAB,ε=0.07 mm2sr,which is matched with the collection optics for the maximum optical transmission.With this spectrometer,the high spectral resolving power of over 1000 can be achieved.After transmitted by the collection optics and the spectrometer,the detected photon flux is estimated to be ~1011photons/s/channel.

Table 2.Structure parameters of the optimized toroidal grating.
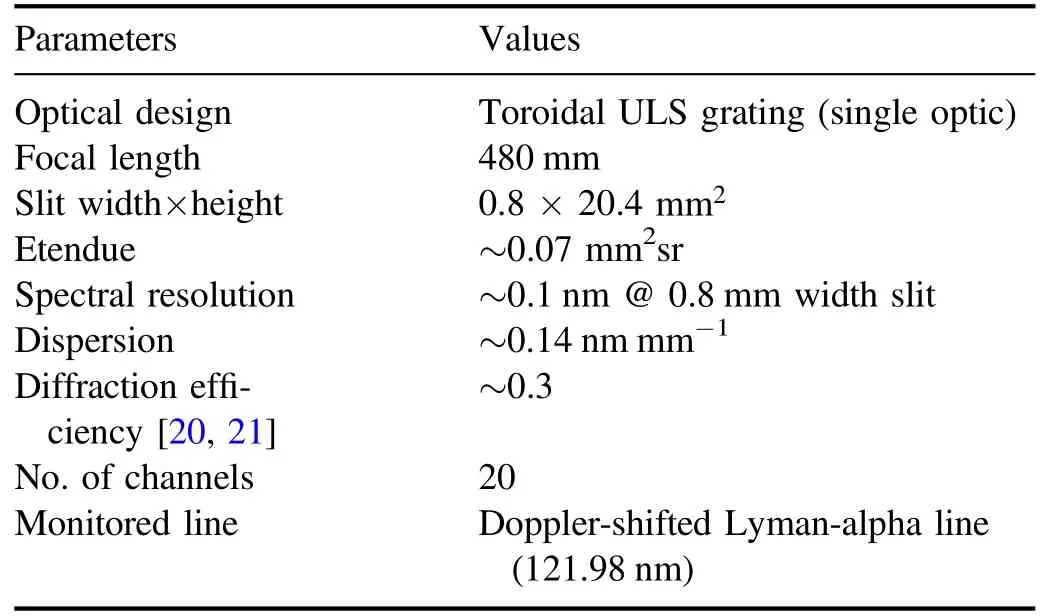
Table 3.Main parameters of the LAB spectrometer.
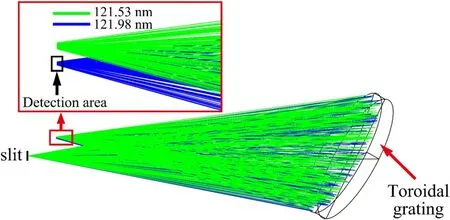
Figure 8.Optical diagram of the high-dispersion spectrometer.
In order to check if the dispersion and resolution capabilities of the spectrometer system could meet the requirements of the LAB system,the paths of the light with wavelengths of 121.98 nm and 121.53 nm were simulated,as indicated by the blue and green rays in figure 8 respectively.The two-wavelength fluorescence could be separated obviously on the detector,as shown at the upper left of figure 8.The detector array will be positioned precisely,so as to receive the ~121.98 nm Doppler-shifted Lyman-alpha fluorescence merely.
A further performance assessment for the integral optical design(collection optics and spectrometer system)of the LAB system is performed.Figure 9 shows the diffraction result of the light originated from the observed NBI-plasma interaction area(R=1.98–2.05 m),which is recorded by the detector after the imaging of the collection optics and diffraction of the spectrometer of the LAB system.The green shows the image of the background Lyman-alpha line with a wavelength of 121.53 nm,while the blue shows the image of the Doppler-shifted Lyman-alpha line with a wavelength of 121.98 nm.The result shows a good coupling and coherence between the optical system and the detector array,which also confirms the reliability of the LAB optical system.The broadening of the beam/edge light in the spectral direction is resulting from the optical aberration and the fixed size of a spatial channel.
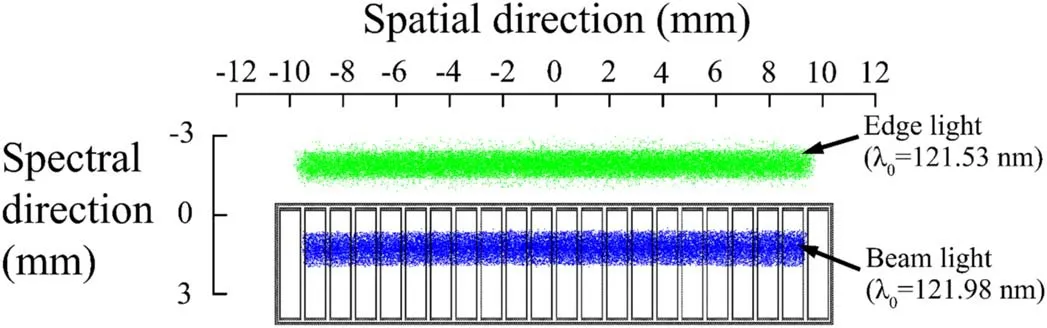
Figure 9.Diffraction result on the detector.
4.Summary
The optical design of the first LAB diagnostic on the HL-2A tokamak has been presented in this article.Different to traditional BES,LAB is to detect the deuterium Lyman-alpha line which has a wavelength of 121.53 nm.The window for LAB is located at the Doppler-red-shift side with a wavelength-shift of about 0.45 nm.Lenses,fibers,and filters,which are common in traditional NBI-based spectroscopy diagnostics are not used in the LAB system.Reflective-telescope system which has two aspherical mirrors works as the collection optics.A high dispersion spectrometer with a single toroidal grating,together with a 20-channel silicon photodiode linear array,is designed to distinguish the Doppler-shifted 121.98 nm target line from the 121.53 nm background line.This system is expected to diagnose plasma density fluctuation with a spatial resolution of about 3.3 mm and a temporal resolution of 1 μs in a total radial viewing range of fromR=1.98 to 2.05 m on the HL-2A tokamak.
It is to be noted that although optical components of LAB are presented in order of light transmission in this article,all parameters of components are considered wholly and selfconsistently.
Now,this diagnostic is under development.The optical path and the main components will be tested in a newly constructed linear plasma device LEAD[22],because the VUV line cannot propagate in the ambient air.Another separated cylindrical vacuum chamber which has a length of 1060 mm and a diameter of 400 mm,is in processing to hold the LAB components.This chamber has its own pump system and will be linked to the main vacuum vessel of the HL-2A tokamak.
Acknowledgments
This work is supported by the National Key R&D Program of China(Nos.2017YFE0301201 and 2018YFE0303102),National Natural Science Foundation of China(Nos.11875124 and 12075241).
杂志排行

Plasma Science and Technology的其它文章
- Rice plant growth and yield:foliar application of plasma activated water
- Three-dimensional non-equilibrium modeling of a DC multi-cathode arc plasma torch
- Magnetic field induction and magnetic force distribution profiles in plasma focus discharge device
- Comparison of sample temperature effect on femtosecond and nanosecond laser-induced breakdown spectroscopy
- An active tunable Fano switch in a plasmafilled superlattice array
- Enhanced removal of ultrafine particles from kerosene combustion using a dielectric barrier discharge reactor packed with porous alumina balls